The Sunburst Arc: Direct Lyman escape observed in the brightest known lensed galaxyThanks: Based on observations obtained at the Magellan I (Baade) Telescope at Las Campanas Observatory, Chile.
Abstract
We present rest-frame ultraviolet and optical spectroscopy of the brightest lensed galaxy yet discovered, at redshift . The source reveals a characteristic, triple-peaked Lyman profile which has been predicted in various theoretical works but to our knowledge has not been unambiguously observed previously. The feature is well fit by a superposition of two components: a double-peak profile emerging from substantial radiative transfer, and a narrow, central component resulting from directly escaping Lyman photons; but is poorly fit by either component alone. We demonstrate that the feature is unlikely to contain contamination from nearby sources, and that the central peak is unaffected by radiative transfer effects apart from very slight absorption. The feature is detected at signal-to-noise ratios exceeding 80 per pixel at line center, and bears strong resemblance to synthetic profiles predicted by numerical models.
Key Words.
galaxies: starburst – galaxies: high-redshift – galaxies: individual: PSZ1-ARC G311.660218.4624 – galaxies: ISM1 Introduction
Young, star-forming galaxies are generally believed to be the most important source of the Lyman continuum (LyC) radiation responsible for the reionization of the early Universe (Bouwens et al. 2012; Faisst 2016, e.g.). However, faint galaxies of high star formation rates tend to contain large amounts of neutral Hydrogen, which is opaque to LyC at column densities (Osterbrock & Ferland 2006, e.g.). Exactly where in the galaxy this radiation originates, and how it finds its way into the intergalactic medium, remains one of the most important unsolved problems in Astrophysics.
Lyman continuum can be allowed to escape a galaxy mainly by two means. In one scenario, the source regions can be surrounded by a largely isotropic gas with column density of neutral Hydrogen sufficiently low to not completely attenuate the passing LyC radiation. This is usually referred to as the density bounded medium. In a second scenario, the neutral medium is optically thick, but not completely covering the ionizing sources. This scenario has been referred to as the picket fence model (Conselice et al. 2000; Heckman et al. 2011, e.g.), the riddled ionization-bounded medium (Verhamme et al. 2015), or the ionization-bounded medium with holes (Zackrisson et al. 2013). The latter scenario can be subdivided into two cases: One quasi-isotropic, where the medium consists of clumps with a combined covering fraction below unity. This scenario will potentially have a large number of narrow, direct lines of sight (LOS) in random directions (Hansen & Oh 2006; Duval et al. 2014; Gronke et al. 2016). In the other, the medium is closer to an optically thick shell, perforated in few places by channels of very low optical depth (Zackrisson et al. 2013; Behrens et al. 2014, e.g.). The clumpy and the perforated shell cases are not always well distinguished in the literature; we here reserve the term picket fence model for the clumpy scenario. While these three scenarios have similar observational signatures in LyC, they have different spectral signatures in Lyman , which is shaped by resonant interactions with the H i that also governs escape of LyC, although in different ways (see e.g. Dijkstra 2014, and references therein).
Figure 1 shows a cartoon depiction of these three scenarios and their emerging Ly spectral shapes. Blue arrows signify Ly, and red arrows LyC radiation. The left panel shows the density bounded model. Lyman , which has an interaction cross section orders of magnitude higher at line center, undergoes substantial radiative transfer before escaping as a broadened, double-peaked profile, while LyC escapes due to the low optical depth of the medium (Jaskot & Oey 2013; Jaskot & Oey 2014; Verhamme et al. 2015). Most local LyC leakers display Ly line shapes similar to this (Verhamme et al. 2015), and also in metal absorption are more consistent with this scenario (Chisholm et al. 2017). The central panel shows the picket fence model, in which LyC can escape only through open sight lines between dense clumps, while Ly can bounce off boundaries of clumps and thus escape after few scatterings and only weak radiative transfer effects. The resulting Ly spectrum is a narrow, single peaked line, with the intrinsic shape nearly intact (Gronke et al. 2016, e.g.). The right panel shows the perforated shell model. Here, LyC and a central Ly peak are also escaping directly through an open channel. In addition to this, Ly photons are captured scattering in the denser neutral gas, leading to substantial radiative transfer effects. The resulting Ly line shape is a narrow, central peak escaping through the uncovered sight lines, superimposed on the characteristic double peak profile emerging from the optically thick gas(Duval et al. 2014; Behrens et al. 2014; Gronke et al. 2016, e.g.). Herenz et al. (2017) report a possible observation of such ionized channels seen from the side in the nearby galaxy SBS 0335052E.
In this letter, we present rest-frame UV and optical spectroscopy of the lensed galaxy PSZ1-ARC G311.660218.4624, which we nickname the Sunburst Arc11 1 A sunburst being a “direct view at the sun through rifted clouds”.. We find that it contains strong evidence for direct escape of Lyman photons through a perforated, optically thick medium. The galaxy was serendipitously discovered in follow-up imaging of its lensing cluster, which was discovered through its Sunyaev-Zel’dovich effect in the Planck data (Planck Collaboration et al. 2014) and was first reported and described by Dahle et al. (2016). This is to our knowledge the first unambiguous detection of this type of spectral signature, and it bears remarkable resemblance to theoretical predictions of e.g. Behrens et al. (2014).
2 Observations and data reduction
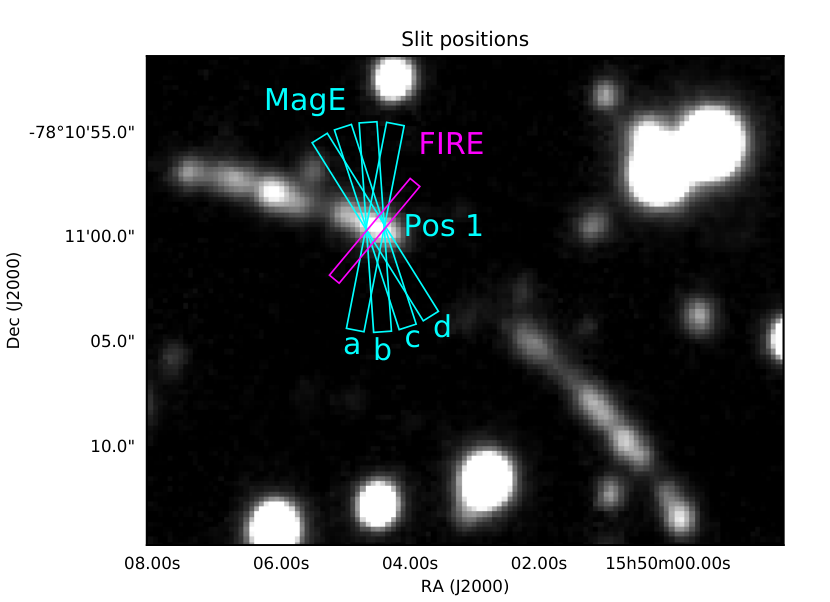
We observed PSZ1-ARC G311.660218.4624 through variable cloud cover on UT 24 May 2017, beginning at 03:31, with the Magellan Echellette (MagE) spectrograph (Marshall et al. 2008) on the Magellan-I (Baade) telescope. MagE was configured with the 10 slit, which delivers a constant spectral resolution as a function of wavelength, R ( km s-1) as measured by Gaussian fits to night sky lines. We performed an alternating sequence of four 2700s science frames and 6s reference arc lamp calibration frames, with the slit position angle being rotated between exposures to match the parallactic angle at the midpoint of each science frame (see Fig. 2). The seeing varied between 11–15, and the cloud cover increased significantly over the course of the observations (see Fig. 3). We also observed a flux calibrator star, CD-23d (Hamuy et al. 1992; Hamuy et al. 1994), at three different airmasses bracketing those of the science observations, as well as a second standard, EG131, for correcting telluric absorption lines. The MagE spectra were processed using the MagE pipeline, which is part of the Carnegie Python Distribution22 2 Described at http://code.obs.carnegiescience.edu/, and were fluxed as described in Rigby et al. (2017). Due to the variable cloud cover we only recover a relative flux calibration as a function of wavelength, with no constraint on the absolute flux normalization.
We also observed the arc on UT 30 March 2016, beginning at 09:06 hrs, with the Folded-port InfraRed Echelle (FIRE) spectrograph (Simcoe et al. 2013) on the Baade telescope. Observations were performed with the echelle grating and the 06 slit as a pair of 1800s exposures with the target nodded between two positions along the slit, and the slit aligned perpendicular to the arc (see Fig. 2). Conditions were clear throughout the observations, with seeing averaging 08. We also observed standard star HIP77712 immediately before the science observations to provide a flux calibration and telluric corrections. The data were reduced using the FireHose v2 data reduction pipeline (Gagné et al. 2015). The final reduced spectrum has a spectral resolution of R ( km s-1). The wavelength ranges covered are Å for MagE and for FIRE. A more comprehensive analysis of these and additional observations is to be presented in a subsequent paper (Rivera-Thorsen et al., in prep).
We determined the systemic redshift of the arc based on the FIRE spectrum by fitting a single Gaussian profile to each of the four strong emission lines H, [O III] (4959, 5007), and H. We then computed an uncertainty-weighted average of the four redshifts to be .
3 Results
3.1 Triple-peaked Lyman emission
Figure 3 shows cutouts of Ly from the reduced 2D MagE spectra of the four pointings shown in Fig. 2. The top panel contains the coadded and extracted 1D profile on the same scale. The bright, narrow peak at km s-1 is immediately evident for all of the position angles, and the strongly similar line morphologies point to the flux originating in the same spatial region, at least down to the scale of the seeing. The 1D profile is a textbook example of the kind of line shape we would expect to observe when looking through a clear channel in an otherwise optically thick neutral medium; consisting of a double-peaked profile typical for the Ly profile emerging through a large number of scatterings with a narrow, non-scattered emission peak at line center superimposed onto it, as shown in e.g. Fig. 7 of Behrens et al. (2014). Note that Behrens et al. (2014) have not systematically evaluated their models in a region of parameter space, so a quantitative comparison is not possible at the moment, but we plan to model this in Rivera-Thorsen et al., in prep. It is however clear that unlike the typical optically thin, density-bounded scenario, this profile also shows strong signs of radiative transfer in at least a modestly thick, surrounding neutral medium.
3.2 Lyman radiative transfer modeling
To test whether the observed profile is consistent with the perforated neutral shell scenario, we have attempted to fit the grid of spherically symmetric, isotropic expanding shell models presented in Gronke et al. (2015) (Ahn et al. 2003; Verhamme et al. 2006; Schaerer et al. 2011, inspired by similar models by ), to the observed Ly profile (see Fig. 4). As a prior to the intrinsic profile, we used the width and position of observed H. We first attempted to fit the full, observed Ly profile to the shell model grid (left panel), but could not even approximately reproduce it, even though shell models are able to reproduce the vast majority of Ly emission profiles remarkably well (Gronke 2017, e.g.). We then fit the central, narrow peak to a single Gaussian profile, which was subtracted, and the remaining profile, similar to typical, double-peaked Ly profiles, was again fitted to the shell model grid (right panel). Unlike the full observed profile, we were able to reproduce the approximated double-peak profile. The fit should not be taken too literally, as the subtraction of the central peak is a coarse approximation, but it does support the hypothesis of a double-peak profile resulting from substantial radiative transfer, with a largely unaltered, intrinsic component superimposed upon it.
We then compare the narrow central peak to the shape of H to test whether this component is consistent with direct escape. If no neutral hydrogen is encountered along the LOS, these two profiles will be identical up to a multiplicative constant. Significant amounts of H I, on the other hand, will result in an altered Ly line shape, broadened by frequency diffusion. The upper panel in Fig. 5 shows for comparison the normalized Ly and H profiles. H, observed with FIRE, has been smoothed to match the poorer instrument resolution of MagE and scaled to match the height of Ly. The profiles of H and the central Ly peak follow each other very well on the red side, as would be expected from the perforated, optically thick scenario. Surprisingly, Ly is narrower than the intrinsic line shape on the blue side, suggesting a weak interaction with neutral gas, absorbing a minor fraction of the light. We interpret this as being due to a residual neutral component in diffuse ionized interstellar or circumgalactic gas along the LOS and note that the low-velocity Si iv feature in Fig. 5 lines up well with the blue edge of the central Ly peak.
3.3 Interstellar metal lines
The lower two panels of Fig. 5 show a selection of metal lines of the neutral and ionized phase. These lines were normalized by fitting a linear function to the local continuum and dividing by the resulting line. We have omitted transitions blueward of rest frame Ly due to Ly forest absorption. The shown data has been smoothed by a boxcar kernel of 3 pixels width. Two main components of absorbing gas are evident in the Si IV spectra; one at low velocity ( km s-1), and one at intermediate velocity ( km s-1). The neutral line profiles are much shallower but follow the general morphology of the ionized medium, reflecting that the majority of ionized gas is likely to be found in the same cloud systems as the neutral gas, on the side facing the central ionizing source.
The neutral lines in the low-velocity component have approximately the same depth, suggesting that the gas is concentrated in optically thick clumps of low velocity-binned covering fraction (Rivera-Thorsen et al. 2017, see e.g.). In contrast, the strong and weak absorption lines behave very differently in the km s-1 component, with the weak lines being either non-detections or extremely shallow. A quantitative analysis of this is to be made in our follow-up paper, but this shows that at least in the blue end, the neutral gas is optically thin, at least to the weaker transitions, and thus might cover the background fully. At this velocity, it has little impact on the line shape of Ly, but may still affect LyC escape substantially.
All the ions shown in the middle panel of Fig. 5 have fine structure split ground levels and thus some amount of fluorescent emission is expected. As argued by Jaskot & Oey (2014), a comparison of resonant absorption depth and fluorescent emission strength can hint at the possible presence of neutral gas within the spectrograph aperture, but off the LOS. We have shown the approximate expected centroids of fluorescent emission in Fig. 5. Despite very shallow absorption, at least some of these lines show significant fluorescent emission, suggesting the presence of significant amounts of off-LOS neutral gas, in agreement with what is expected from the radiative transfer effects seen in Ly.
3.4 Conditions for Lyman continuum escape
The presence of empty or highly ionized lines of sight makes the Sunburst Arc a prime candidate for spatially resolved observation of LyC. Some uncertainty arises from the component at km s-1. Looking at Fig. 5, the Si ii lines have strongly differing depth, implying that this component is optically thin at least in and possibly also in , in which case the neutral gas component could be covering the entire background source. Due to the high velocity, this has little impact on Ly escape, but LyC is sensitive to neutral gas at any velocity and could possibly be blocked by this system. A full analysis of this is planned for a follow-up paper, but as a first test, we have modelled the theoretical Ly absorption profile arising from a gas component at km s-1 with cm-2 (corresponding to , )) and K. The resulting profile, convolved with the MagE instrument profile, is shown in magenta in the inset of Fig. 5. The theoretical line is too strong to be consistent with the observed feature. We tentatively conclude that the neutral component at km s-1 has either too low column density or covering fraction to effectively block LyC escape.
An HST mid-cycle proposal to image the arc in rest-frame LyC has recently been accepted.
4 Summary
We have presented Magellan/MagE and Magellan/FIRE spectra of the extremely bright, strongly lensed galaxy PSZ1-ARC G311.660218.4624, which we nickname the “Sunburst Arc”. By comparing the 2D spectra of four different position angles, we find it is unlikely that any contamination from nearby objects is present. Based on strong Balmer- and [O III] emission lines, we have improved the precision of previous redshift estimates. From this, we have found that the Ly line shape in the combined MagE spectrum is a close match to theoretical predictions for direct Ly escape through a perforated neutral medium. By comparing to the H emission feature, we have found that most likely, this narrow, central peak has undergone no other radiative transfer than very slight absorption, probably by a residual neutral fraction of H I in the ionized medium along the open line of sight. The observed line profile cannot be modeled by isotropic expanding shell models, but a reasonable fit can be obtained by removing the central peak. A medium-velocity neutral gas component at km s-1 causes some uncertainty as to whether the LOS seen in Ly would also be transparent in LyC, but the absorption feature it leaves in the Ly continuum suggests it is either optically thin to LyC or not fully covering.
Acknowledgements.
We thank the anonymous referee for thorough and constructive suggestions, and E. C. Herenz for useful comments and ideas. ER-T thanks Stockholm University for their kind hospitality. ER-T and HD acknowledge support from the Research Council of Norway.References
- Ahn et al. (2003) Ahn, S.-H., Lee, H.-W., & Lee, H. M. 2003, MNRAS, 340, 863
- Behrens et al. (2014) Behrens, C., Dijkstra, M., & Niemeyer, J. C. 2014, A&A, 563, A77
- Bouwens et al. (2012) Bouwens, R. J., Illingworth, G. D., Oesch, P. A., et al. 2012, ApJ, 752, L5
- Chisholm et al. (2017) Chisholm, J., Orlitová, I., Schaerer, D., et al. 2017, A&A, 605, A67
- Conselice et al. (2000) Conselice, C. J., Gallagher, J. S., Calzetti, D., Homeier, N., & Kinney, A. 2000, AJ, 119, 79
- Dahle et al. (2016) Dahle, H., Aghanim, N., Guennou, L., et al. 2016, A&A, 590, L4
- Dijkstra (2014) Dijkstra, M. 2014, PASA, 31, 40
- Duval et al. (2014) Duval, F., Schaerer, D., Östlin, G., & Laursen, P. 2014, A&A, 562, A52
- Faisst (2016) Faisst, A. L. 2016, ApJ, 829, 99
- Gagné et al. (2015) Gagné, J., Lambrides, E., Faherty, J. K., & Simcoe, R. 2015, Firehose v2.0
- Gronke (2017) Gronke, M. 2017, ArXiv e-prints [arXiv:1709.07008]
- Gronke et al. (2015) Gronke, M., Bull, P., & Dijkstra, M. 2015, ApJ, 812, 123
- Gronke et al. (2016) Gronke, M., Dijkstra, M., McCourt, M., & Oh, S. P. 2016, ApJ, 833, L26
- Hamuy et al. (1994) Hamuy, M., Suntzeff, N. B., Heathcote, S. R., et al. 1994, PASP, 106, 566
- Hamuy et al. (1992) Hamuy, M., Walker, A. R., Suntzeff, N. B., et al. 1992, PASP, 104, 533
- Hansen & Oh (2006) Hansen, M. & Oh, S. P. 2006, MNRAS, 367, 979
- Heckman et al. (2011) Heckman, T. M., Borthakur, S., Overzier, R., et al. 2011, ApJ, 730, 5
- Herenz et al. (2017) Herenz, E. C., Hayes, M., Papaderos, P., et al. 2017, ArXiv e-prints [arXiv:1708.07007]
- Jaskot & Oey (2013) Jaskot, A. E. & Oey, M. S. 2013, ApJ, 766, 91
- Jaskot & Oey (2014) Jaskot, A. E. & Oey, M. S. 2014, ArXiv e-prints [arXiv:1406.4413]
- Marshall et al. (2008) Marshall, J. L., Burles, S., Thompson, I. B., et al. 2008, in Proc. SPIE, Vol. 7014, Ground-based and Airborne Instrumentation for Astronomy II, 701454
- Osterbrock & Ferland (2006) Osterbrock, D. E. & Ferland, G. J. 2006, Astrophysics of gaseous nebulae and active galactic nuclei
- Planck Collaboration et al. (2014) Planck Collaboration, Ade, P. A. R., Aghanim, N., et al. 2014, A&A, 571, A29
- Rigby et al. (2017) Rigby, J. R., Bayliss, M. B., Sharon, K., et al. 2017, ArXiv e-prints [arXiv:1710.07294]
- Rivera-Thorsen et al. (2017) Rivera-Thorsen, T. E., Östlin, G., Hayes, M., & Puschnig, J. 2017, ApJ, 837, 29
- Schaerer et al. (2011) Schaerer, D., Hayes, M., Verhamme, A., & Teyssier, R. 2011, A&A, 531, A12
- Simcoe et al. (2013) Simcoe, R. A., Burgasser, A. J., Schechter, P. L., et al. 2013, PASP, 125, 270
- Verhamme et al. (2015) Verhamme, A., Orlitová, I., Schaerer, D., & Hayes, M. 2015, A&A, 578, A7
- Verhamme et al. (2006) Verhamme, A., Schaerer, D., & Maselli, A. 2006, A&A, 460, 397
- Zackrisson et al. (2013) Zackrisson, E., Inoue, A. K., & Jensen, H. 2013, ApJ, 777, 39