The Graphical User Interface of the Operator of the Cherenkov Telescope Array
Abstract
The Cherenkov Telescope Array (CTA) is the next generation gamma-ray observatory. CTA will incorporate about 100 imaging atmospheric Cherenkov telescopes (IACTs) at a southern site, and about 20 in the north. Previous IACT experiments have used up to five telescopes. Subsequently, the design of a graphical user interface (GUI) for the operator of CTA poses an interesting challenge. In order to create an effective interface, the CTA team is collaborating with experts from the field of Human-Computer Interaction. We present here our GUI prototype. The back-end of the prototype is a Python Web server. It is integrated with the observation execution system of CTA, which is based on the Alma Common Software (ACS). The back-end incorporates a redis database, which facilitates synchronization of GUI panels. redis is also used to buffer information collected from various software components and databases. The front-end of the prototype is based on Web technology. Communication between Web server and clients is performed using Web Sockets, where graphics are generated with the d3.js Javascript library.
1 Introduction
The Cherenkov Telescope Array (CTA) [1] is the next generation observatory for very high-energy gamma-rays (-rays). CTA will be sensitive to photon energies from GeV, up to a few hundred TeV. As they impact the atmosphere, -rays induce particle showers. A part of these cascades is Cherenkov radiation, which is emitted as charged particles travel faster than the speed of light in the atmosphere. The Cherenkov radiation can be detected by imaging atmospheric Cherenkov telescopes (IACTs) [2]. Using multiple telescopes together, the particle showers can stereoscopically be reconstructed. This allows one to derive the properties of the initial -ray that initiated the shower.
CTA will include three types of primary instruments. These correspond to three telescope sizes, large-, mid- and small-size, respectively called LSTs, MSTs, and SSTs. The different telescope types will be sensitive to different -ray energy ranges, where smaller mirror areas correspond to higher energies. CTA telescope arrays will be deployed in two sites in the southern and northern hemispheres, respectively consisting of and telescopes. This represents a substantial increase in the number of instruments compared to existing IACT experiments (H.E.S.S. [3], VERITAS [4], and MAGIC [5]), which incorporate between two to five telescopes.
The focus of this paper is the graphical user interface (GUI) for the operator of a CTA site. As mentioned above, CTA will include a large number of telescopes. In addition, several variations of SST and MST designs will be used. This further increases the diversity of hardware which needs to be controlled by an operator. The complexity of CTA makes for an interesting challenge in designing an effective user interface. In the following, the development process of the operator GUI is detailed. We describe the way in which the GUI is foreseen to be integrated with other CTA systems. In addition, we showcase a few of the features of the current prototype implementation11 1 Media resources illustrating panels from the prototype are available at https://www-zeuthen.desy.de/~sadeh/ . .
2 Design and development process
Nominally, on-site observing operations with CTA will be automated. The purpose of the operator GUI can therefore be summarised as follows: {Enumerate}
start and end observations;
override the automated scheduled operations in order to perform a specific task, or for safety reasons (could require manual control over instruments);
monitor the state of the array during operations, including hardware status and simple scientific metrics;
identify, diagnose, and if possible resolve, problems with specific systems or processes.
The development process of the GUI is inspired by the model used by the Atacama Large Millimeter/submillimeter Array (ALMA) [6]. ALMA is an astronomical interferometer of radio telescopes in the Atacama desert of northern Chile. It is similar in complexity to CTA, comprising radio antennas of three general types. One of the main lessons learned from ALMA, is that it is important to take into account advances in Human-Computer Interaction (HCI) when designing an interface [7].
The design process is thus driven by participatory workshops. These bring together several groups of people: experts from the field of HCI; experienced telescope operators; control software experts; and astroparticle physicists. The purpose of the workshops is to refine the requirements on the GUI; to better understand what the GUI should enable users to accomplish; and to work out how best to implement these ideas, without causing unnecessary cognitive load. The outcome of the first two workshops, including a set of initial requirements, is described in detail in [8].
3 Incorporating the GUI within Central-Control
3.1 A Prototype for the GUI
The current prototype for the operator GUI is based on HTML5 Web technologies. The back-end of the prototype is a Python server, based on the Pyramid [9] framework. The front-end is displayed in a Web browser. The design is implemented using Polymer [10], a Web Component application programming interface, developed by Google. Data are displayed using an open-source Javascript library, called d3.js [11]. Asynchronous communication between the back-end and the front-end of the GUI is performed using Web Sockets.
3.2 The Observation Execution System
The operator GUI is part of the Observation Execution System (OES) of CTA. The purpose of OES is to monitor and control telescopes and auxiliary devices; to schedule and execute observations and calibrations; and to time-stamp, read-out, filter, and store the collected data. OES is comprised of several sub-systems in addition to the GUI. These are: Manager and Central Control; Short-Term and ToO (target of opportunity) Scheduler; Data Handling; Configuration; Reporting and Diagnosis; and Monitoring.
At the high-level, OES is implemented upon the Alma Common Software (ACS) framework. ACS is a distributed middleware framework, based on a container-component model. It supports Python, Java, and C++, and constitutes a thoroughly tested platform for distributed data acquisition and instrumentation control.
3.3 Interfaces Between the GUI and OES
Interfaces between the GUI and each of the sub-systems of OES are already envisioned. For example: - Manager and Central Control: The GUI will monitor the status of the observing blocks which are currently being executed. The latter are logical units, which define a specific observing or calibration task. They include information, such as the time-span in which to carry out the task, the required resources (e.g., telescopes), etc. - Short-term and ToO Scheduler: The GUI will have access to the plan for future observations. It will also have the functionality to modify this plan on the short-term, by e.g., creating or cancelling observing blocks. - Monitoring: The GUI will display all monitoring data which are e.g., deemed necessary for discovering and diagnosing potential hardware problems.
The main users of the GUI will be a single or several operators, who will occupy the CTA control-room. However, additional users are also foreseen, such as off-site engineers. The potentially large number of users increases the load on OES. For example, one may consider the case of a detailed monitoring view for a telescope. For such a panel, hundreds of data-points are displayed, each updated with a rate. A simple architecture may entail a communication channel being opened between the GUI and the telescope, for each one of the requested properties. Such an approach has an obvious downside; it would result in a large demand on resources, whenever multiple users access the same panel at the same time.
In order to avoid such problems, a part of the infrastructure of the GUI will be a dedicated database. The primary purpose of the latter is to act as a buffer, and reduce the traffic between the GUI and other OES components. For the current prototype, we chose redis for this purpose. redis is an in-memory data structure store, which can achieve high write and read speeds. redis has several advantages over other database solutions. Primarily, it is optimised for quickly updating and querying large numbers of non-complex data elements, such as strings.

Figure 1 shows a schematic illustration of the functionality of the redis database. In this example, two users request monitoring information. The users may ask for the same, or for different data. In any case, communication between the users and OES is mediated through redis, avoiding direct links to other part of the system. In turn, redis is filled by accessing lower-level components. In this example, the data partly originate from a direct link to telescopes, and partly from the monitoring database (another component of OES).
Considering the scope of the data stored in the database, two general approaches for resource management are possible. One option is for redis to continuously be filled by all available properties which could potentially be requested by any panel of the GUI. Alternatively, properties may be monitored on-demand. That is, specific data will only be stored and updated in redis, if they are required by at least a single user at a given time. The first option is more simple, and therefore less prone to errors. On the other hand, the second path has the advantage of requiring significantly less resources. Both configurations are currently being explored.
4 Front-end design features of the GUI prototype
4.1 Example Telescope Monitoring Panel

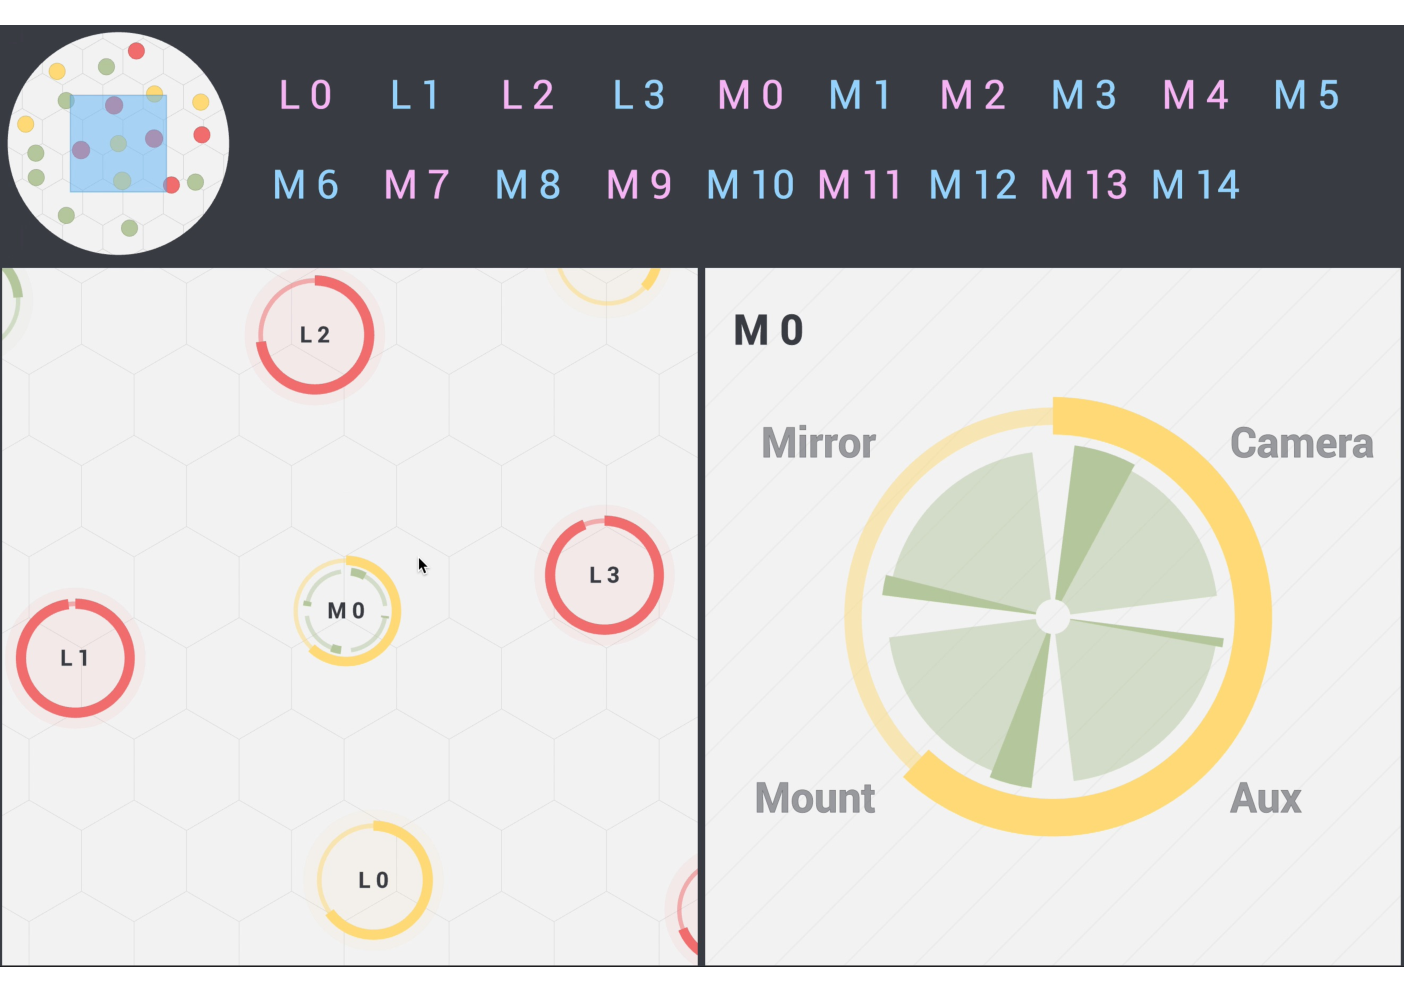
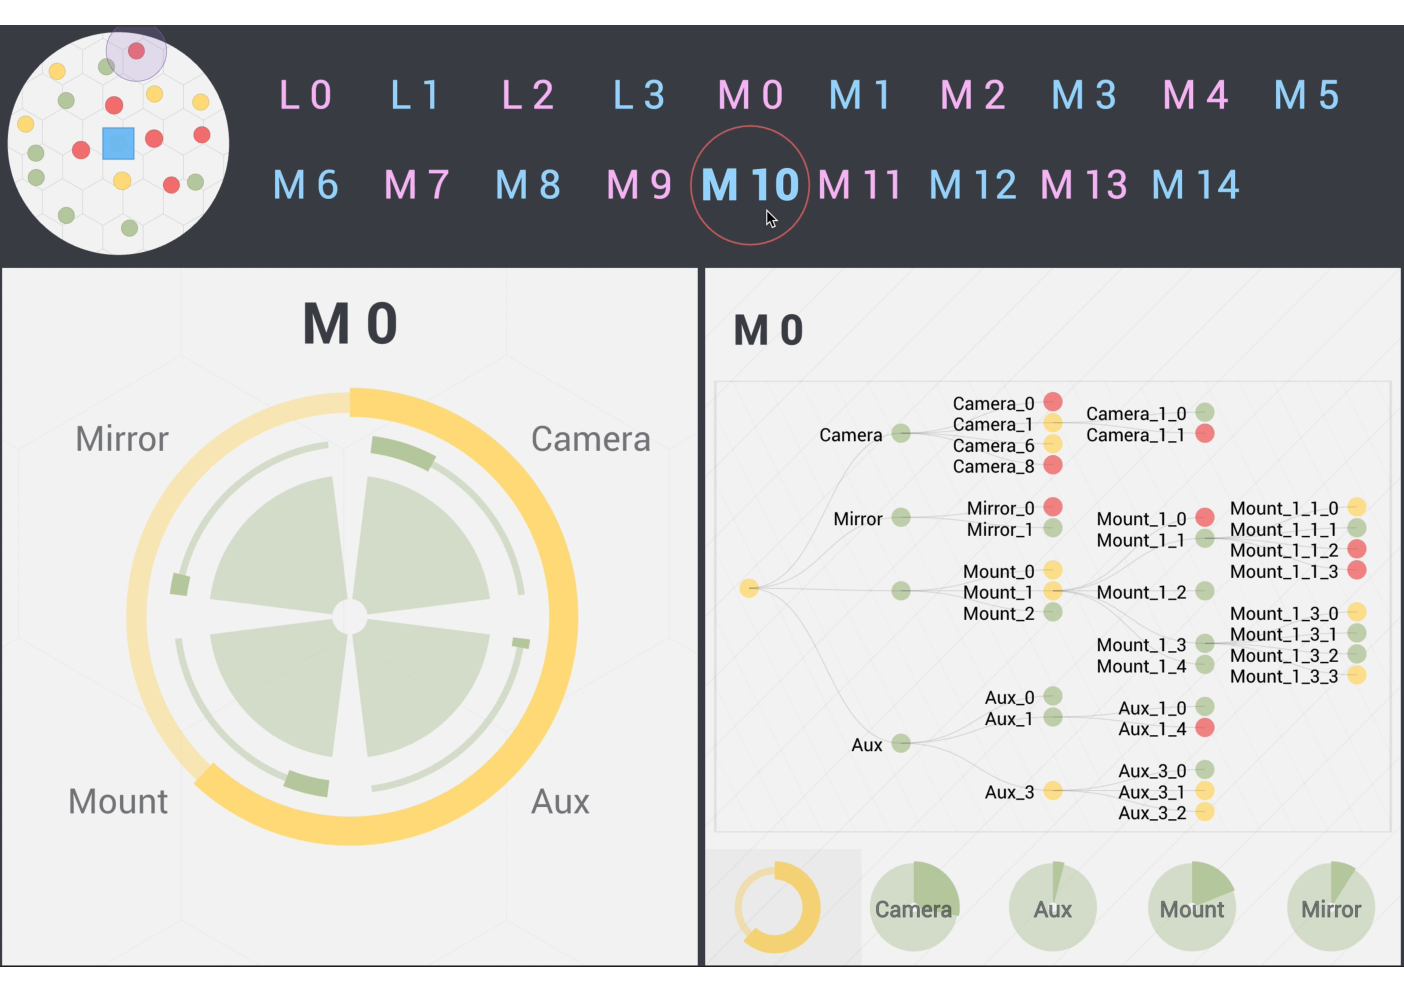

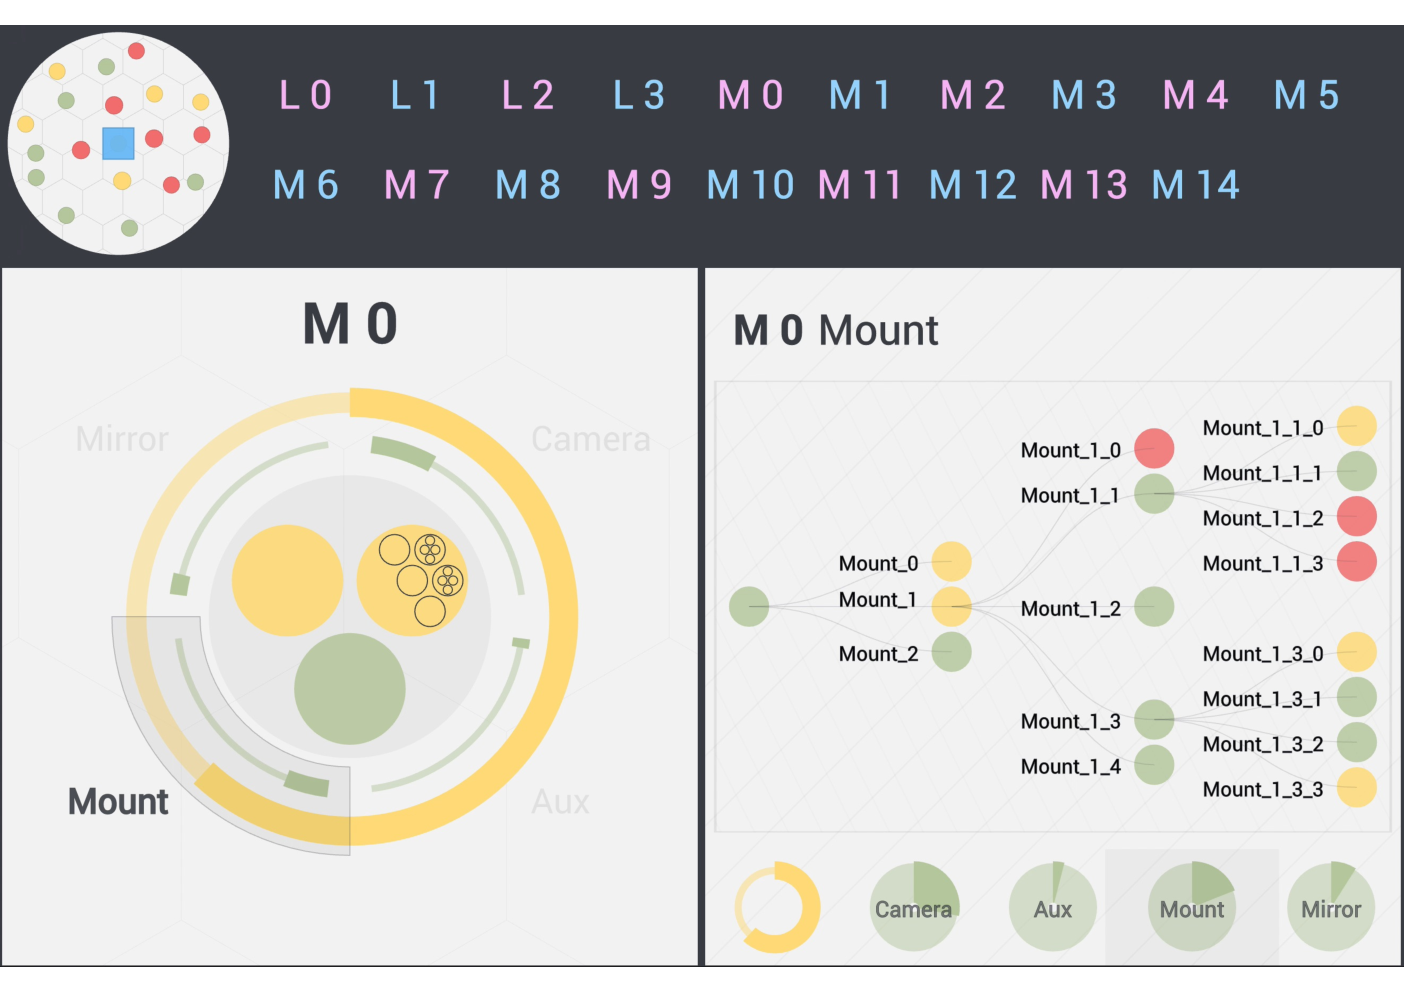


Several panels have already been implemented as part of the prototype of the operator GUI. As an example, a telescope monitoring panel is presented in Fig. 2, using the array layout of the northern CTA site. The view is composed of several sub-panels, as described in the following.
Several view-points of the same panel are shown in the figure. Figure 2 illustrates the initial view. The top left corner contains a mini-map, which is a fixed perspective of the entire array. Each circle represents a single telescope, where the different units are arranged in a pseudo-geographic layout. The colours represent global status indicators for each telescope, green (normal operations), yellow (some problems), and red (device failure). The wide dark area on the top (from centre to right corner) is a chess-board. The latter allows for quick selection of specific telescopes, based on their ID tag. The chess-board complements the functionality of the mini-map, which enables selection based on physical location.
The bottom right sub-panel in Fig. 2 shows a general status indicator for the entire array. In addition to a global metric, indicated by the outer yellow ring, four quadrants are shown, tagged as: Mirror, Camera, Aux (auxiliary), and Mount. These represent a generalized division of a telescope into four sub-systems, which have their own common functionality. The status of a given element is represented by two redundant indicators: the colours (green to red); and the relative shaded area in the outer ring, or in each of the inner quadrants.
The bottom left sub-panel in Fig. 2 shows a larger view of the pseudo-geographic layout of the array. Unlike the static mini-map, the larger view includes zooming functionality. The effect of zooming can be understood from Figure 2. In this case, telescope MST-0 (indicated by M 0) is selected and zoomed upon. The zoom action is also reflected in the mini-map as a shaded blue rectangle, which allows for the pseudo-geographic context to be kept. In addition, the bottom-right view reflects the selection action; the global array metrics have been replaced with the status indicators of the selected telescope, M 0.
The panel incorporates semantic zooming [12]. The latter is a technique that enables representing information at different levels of detail for a given visual element. This behaviour complements standard geometric zooming, where only the size of elements changes with the zoom-factor. As the view is zoomed-in on a specific area, the graphical representation is changed for each one of the enclosed telescopes, increasing the level of detail.
As the zoom-factor is further increased by the user, the display is updated again, as indicated in Fig. 2. The bottom left sub-panel shows the different metrics for each sub-system of M 0. The bottom right sub-panel shows a hierarchical tree diagram of the different components associated with each sub-system. For the current prototype, these components are not yet assigned to specific hardware elements. Place-holder names, such as Mount_0, are used instead. Figure 2 also shows a secondary functionality of the chess-board. As the user hovers over a given telescope, the latter is highlighted by a thin circle within the mini-map. This allows for a quick association between a specific telescope and its position within the map, even when the larger display is zoomed-in.
The two main sub-panels (bottom left and right) are synchronized using brushing and linking, following the principles of coordinated multiple views [13, 14]. A user-action in one is reflected in the other. The display allows a user to focus on a specific sub-system, by clicking on one of the quadrants from the bottom left display, or on one of the circles in the tree on the right. This is shown in Fig. 2 for the Mount. It is possible to further traverse the hierarchy of the tree, and focus on lower levels of components. Three such levels are shown in Figs. 2-. In addition to collapsing the tree into lower branches, the hierarchy is also represented by the enclosed circles inside the sub-panel on the left. This circle-packing display [15] allows for quick navigation, to higher or to lower branches of the tree.
The large array display on the bottom left can also be modified, such that telescopes are not mapped to a pseudo-geographic layout. Figure 2 illustrates one such arrangement, where the mini-map, chess-board and the detailed element view on the bottom right all remain unchanged. In this example, telescopes are grouped into sub-arrays, represented as an enclosure diagram. A sub-array is a collection of telescopes which perform a single task, corresponding to an observing block (e.g., observing an astronomical object). Regardless of the change in layout, the zoom-properties of the different visual elements in the display remain the same, preserving the basic functionality of the panel.
4.2 Example Observing Block Panel

Another example of a panel from the prototype is presented in Fig. 3. The purpose of this panel is to display the current execution status of different observing blocks. The different blocks are represented as squares in the panel. Each square is positioned within a rectangle, that indicates the execution status. The latter includes three categories: waiting blocks (top); running blocks (middle-left); and completed blocks (bottom). In addition, the middle section of the panel contains phase groups, which provide a detailed breakdown of the status of running blocks. These include a configure phase of the various telescope sub-systems; a take data phase, to indicate that e.g., observations are being performed; and a finish phase, where the different sub-systems go through any procedures which are e.g., needed as an observation ends.
As a user clicks on a given observing block within the view, detailed information regarding the block is displayed in another panel. The latter is currently being designed, and so is not shown here. An interface panel is also being developed, which will allow a user to create new observing blocks with customized parameters, and to cancel waiting or running blocks.
4.3 Synchronization of Panels
An important aspect of the design of the GUI is panel-synchronization. The purpose of synchronization is to enable robust interaction of a user with the GUI [13, 14]. A simple example of synchronization, is the coordinated behaviour of the two main sub-panels shown in Fig. 2. However, the full benefits of this technique are found in interconnecting separate panels, where different aspects of the system can share the same context.
To illustrate this, one may consider for example the connection between the telescope monitoring and the observing block panels. The two are synchronized, such that an event is transmitted from the telescope monitoring panel, when the user zooms-in on a particular telescope. This event is received by the observing block panel; it has the effect of highlighting the corresponding observing block, to which the selected telescope is assigned.
Work is currently under way to also extend the scope of the telescope monitoring panel. The objective is to synchronize it with a new view, which will contain monitoring plots.

A partial example of such a panel is shown in Fig. 4. In this case, the plots show time-series and a histogram, derived from data taken with a weather monitoring station.
For the purpose of a synchronised view with the panel shown in Fig. 2, the data would correspond to each of the monitoring-points within the tree diagram. By clicking on a given element from the tree, such as Mount_0, the respective distributions of the value of Mount_0 over time would appear. The plots would be arranged in such a way, that the hierarchy of monitored data elements will be visually emphasized. This will e.g., facilitate tracing of problems across a range of inter-connected hardware components.
5 Summary
The design of an effective GUI for the operator of CTA is an interesting and challenging task, due to the complexity of the observatory. This paper presents the status of the design process of the current prototype implementation of the GUI. Two aspect of the prototype are discussed, the back-end, and the front-end.
The back-end of the GUI is a Python Web server. Some of the interfaces of the server with the Observation Execution System of CTA are discussed. In particular, a description is given of the choice of using a redis database as a buffering layer between the GUI and other OES components.
The front-end of the GUI is a displayed in a Web browser. Two of the existing panels from the prototype are showcased, a detailed telescope monitoring view, and an observing block monitor. Some of the specific design details of these panels are illustrated, such as semantic zooming. In addition, a description is given of a general feature, panel synchronization, which allows different views to be interconnected.
Future work will include implementing additional interfaces between the GUI and the rest of OES. Concerning the front-end, existing GUI panels will be extended with e.g., new synchronization behaviour. New views will also be designed, in order to cover the full required functionality of the GUI, as briefly summarised above.
6 Acknowledgement
We would like to thank C. Appert, E. Barrios, A. Bulgarelli, A. Cabrera, F. Dazzi, G. Fasola, V. Fioretti, L. Font, M. Fuessling, S. Gabici, M. Garczarczyk, K. Kosack, R. Macias, R. White and the members of the CTA OES team, for their helpful comments and insights.
We gratefully acknowledge financial support from the agencies and organizations listed here:
http://www.cta-observatory.org/consortium_acknowledgments.
References
- [1] M. Actis et al., “Design concepts for the Cherenkov Telescope Array CTA: an advanced facility for ground-based high-energy gamma-ray astronomy,” Experimental Astronomy, vol. 32, pp. 193–316, Dec. 2011.
- [2] A. Hillas, “Evolution of ground-based gamma-ray astronomy from the early days to the cherenkov telescope arrays,” Astroparticle Physics, vol. 43, pp. 19 – 43, 2013. Seeing the High-Energy Universe with the Cherenkov Telescope Array - The Science Explored with the CTA.
- [3] F. Aharonian et al., “Observations of the Crab nebula with H.E.S.S.,” Astron.Astrophys, vol. 457, pp. 899–915, Oct. 2006.
- [4] J. Holder et al., “The first VERITAS telescope,” Astropart. Phys., vol. 25, pp. 391–401, 2006.
- [5] J. Albert et al., “VHE Gamma-Ray Observation of the Crab Nebula and Pulsar with MAGIC,” Astrophys. J., vol. 674, pp. 1037–1055, 2008.
- [6] A. Wootten and A. R. Thompson, “The Atacama Large Millimeter/Submillimeter Array,” IEEE Proceedings, vol. 97, pp. 1463–1471, Aug. 2009.
- [7] E. Pietriga et al., “Interaction design challenges and solutions for ALMA operations monitoring and control,” in SPIE Astronomical Telescopes and Instrumentation (SPIE, ed.), vol. 8451 of Proc. SPIE 8451, Software and Cyberinfrastructure for Astronomy II, (Amsterdam, Netherlands), SPIE, July 2012.
- [8] I. Sadeh et al., “Prototyping the graphical user interface for the operator of the Cherenkov Telescope Array,” Proc. SPIE Int. Soc. Opt. Eng., vol. 9913, p. 99130X, 2016.
- [9] http://docs.pylonsproject.org/projects/pyramid/
- [10] https://www.polymerproject.org/
- [11] https://d3js.org/
- [12] K. Perlin and D. Fox, “Pad: An alternative approach to the computer interface,” in Proceedings of the 20th Annual Conference on Computer Graphics and Interactive Techniques, SIGGRAPH ’93, pp. 57–64, ACM, 1993.
- [13] M. Q. Wang Baldonado, A. Woodruff, and A. Kuchinsky, “Guidelines for using multiple views in information visualization,” in Proceedings of the Working Conference on Advanced Visual Interfaces, AVI ’00, (New York, NY, USA), pp. 110–119, ACM, 2000.
- [14] C. North and B. Shneiderman, “Snap-together visualization: a user interface for coordinating visualizations via relational schemata,” in Proceedings of the working conference on Advanced visual interfaces, AVI ’00, pp. 128–135, ACM, 2000.
- [15] W. Wang, H. Wang, G. Dai, and H. Wang, “Visualization of large hierarchical data by circle packing,” in Proceedings of the SIGCHI Conference on Human Factors in Computing Systems, CHI ’06, (New York, NY, USA), pp. 517–520, ACM, 2006.