RESONANT TEMPERATURE FLUCTUATIONS IN NEBULAE IONIZED BY SHORT-PERIOD BINARY STARS
Abstract
A present prevailing open problem planetary nebulae research, and photoionized gaseous nebulae research at large, is the systematic discrepancies in ionic abundances derived from recombination and collisionally excited lines in many H II regions and planetary nebulae. Peimbert (1967) proposed that these discrepancies were due to ’temperature fluctuations’ in the plasma, but the amplitude of such fluctuations remain unexplained by standard phtoionization modeling. In this letter we show that large amplitude temperature oscillations are expected to form in gaseous nebulae photoionized by short-period binary stars. Such stars yield periodically varying ionizing radiation fields, which induce periodic oscillations in the heating-minus-cooling function across the nebula. For flux oscillation periods of a few days any temperature perturbations in the gas with frequencies similar to those of the ionizing source will undergo resonant amplification. In this case, the rate of growth of the perturbations increases with the amplitude of the variations of the ionizing flux and with decreasing nebular equilibrium temperature. We also present a line ratios diagnostic plot that combines [O III] collisional lines and O II recombination lines for diagnosing equilibrium and fluctuation amplitude temperatures in gaseous nebulae. When applying this diagnostic to the planetary nebula M 1–42 we find an equilibrium temperature of 6000 K and a resonant temperature fluctuation amplitude () of 4000 K. This equilibrium temperature is significantly lower than the temperature estimated when temperature perturbations are ignored.
Keywords:
ISM: general—planetary nebulae: general—HII regionsI INTRODUCTION
Arguably, the most intriguing question left unanswered in photoionization modeling in astronomy pertains the origin of systematic discrepancies in ionic abundances derived from recombination and collisionally excited lines in a large fraction of known H II regions and planetary nebulae (PNe). Such differences in derived abundances can reach up to factors of 10 to 20 for C, N, O, and Ne in some extreme PNe (Liu et al. 2000, 2001). Fifty years ago, Peimbert (1967) proposed that the discrepancies were due to ”temperature fluctuations” in the plasma, but the amplitude of such fluctuations needed to reconcile the abundance determination are too large, in general, to be reproduced by standard phtoionization modeling (Kingdon and Ferland 1995). The existence of temperature fluctuation of some sort has been supported by modern spectra from high sensitivity, high spatial resolution instruments, notably the Hubble Space Telescope (HST) among them. Liu et al. (2000, 2001) showed that the temperatures of PNe determined by ratios of collisionally excited lines (e.g. [O III], [N II], [S III]) are typically larger than the temperatures derived by fitting hydrogen recombination spectra (Te(Bac)). Moreover, the abundance discrepancy factors from collisional and recombination lines from optical and UV spectra of planetary nebulae and HII regions are correlated with the difference between Te([O III]) and Te(Bac). Further, temperature fluctuations from point-to-point determinations of electron temperature have been obtained for several high surface brightness PNe and H II regions (Rubin et al. 2002, 2003; Krabbe and Copetti 2002, 2005; O’Dell et al. 2003; Jones et al. 2016), though the fluctuations are generally too small to be spatially resolved in detail.
At present, the idea that is receiving the most attention in explaining the nature of temperature fluctuation is the hypothesis of nebular chemically inhomogenous. According to this hypothesis there would be in the nebula either pockets of cold very metal-rich plasma mixed with the gas (Liu et al. 2006) or an extended high metallicity gas embedded in a less dense ambient gas with lower metallicity (Tsamis et al. 2003). Though, these models are difficult to justify physically and lack workable models capable of making observationally testable predictions.
In recent years, it has been found that a large fraction of all intermediate-mass stars, PNe progenitors are known to be in binary systems (Liu et al. 2006). Moreover, there is now mounting observational evidence that binary stars play a significant role in the PN ejection process. In perticular, it seems like all PNe with extreme abundance discrepancy factors host short-period binary stars (Corradi et al. 2015; Wesson et al. 2016). (Observational searches for close binaries demonstrate that these are virtually all found in bipolar PNe (Tsamis et al. 2003). Though, because searches for binary stars are mostly limited to near edge-on systems with significant photometric variability it remains unproven whether all non-spherical PNe, which in fact are the large majority of PNe, are ejected from binary stars. Surveys have found that between 10% and 20% of all PNe central stars are close binary systems, with periods typically shorter than 3 days (Abt 1983).
Here we show that the periodically varying photoionizing radiation field of a short-period-binary-star will lead to resonant temperature fluctuations in ionized cloud. The mechanisms for this process are described in the next section. Further, Section 3 presents line ratios diagnostics to determine the equilibrium and resonant temperature fluctuation amplitude from observed spectra.
II Resonant Temperature Fluctuations
Let us assume a stationary, inviscid and nonconducting medium in plane parallel symmetry. The equations of conservation of momentum and energy are
| (1) |
and
| (2) |
Here, is the velocity, is the atomic density, is the average mass per particle, is the pressure, is the internal energy, is the heating-minus-cooling rate. If the pressure is mostly due to gas pressure and the internal energy follows the perfect gas law
and
where the temperature is given in units of energy. The factor of 2 in both relationships comes from the fact in a plasma where hydrogen is mostly ionized the number density of particles in the plasma is about twice the density of atoms.
Now, let us introduce a small temperature perturbation and assume that the density is constant through the cloud and in time, so that
Where is the steady state equilibrium temperature and is the time dependent perturbation. Re-writting equations (1) and (2) in terms of temperature and combining them
| (3) |
where, is the sound speed.
In steady state conditions is identically zero for and Hence, this term will damp any temperature fluctuations in the nebula.
On the other hand, if the nebular ionizing source varies with time so will the heating and cooling rates. Let us assume a periodically ionizing source with angular frequency , then heating-minus-cooling rates would oscillate around the equilibrium state as
| (4) |
In this case, the temperature fluctuation would have a solution
| (5) |
These are resonant temperature fluctuations (RTF) powered by the variability of the ionizing source the propagating through the nebula. The amplitude of such waves would resonate for . For short period binary stars with occultation periods of about 10 days the wavelength of the thermal waves is of the order of cm, which typically too small to be resolved observationally.

Figure 1 shows the results of a simulation for a binary star with occultation period of 3 days. Here, the top panel depicts the normalized light curve of the ionizing source. We assume an spectral energy distribution given by a black body at 50,000 K and an ionization parameter at the spectral maximum . The circumstellar nebula has a constant density cm-3 and a chemical mixture containing H, He, C, N, O, S, and Fe with solar abundances. The five lower panels of Figure 1 plot vs. time for various radii within the nebula. The simulation was done with the time-dependent version of the photoionization modeling code XSTAR (Ahmed 2017; Kallman and Bautista 1999). The simulations show clear phase shifts in the heating-cooling wave for different radii in the nebula. This shift is determined by the radiation propagation time (see García et al 2013).
Clearly, the above treatment neglects additional damping terms. Because temperature waves travel at sound speeds, density fluctuations are also expected to occur. These may be the most important damping terms of resonant temperature fluctuations.
Let us now consider the more general case of periodic perturbations to the system with the same frequency as the heating-minus-cooling function. This is,
Notice here that while the radiation and gas properties are expected to oscillate with the same frequency they travel at different speeds, such that .
The linearized perturbation equations are
This set of equations lead to the dispersion relation
| (6) |
For to be real the fluctuation’s wave number must be complex as and . Hence, the amplitude of the RTF amplitude is
| (7) |
This equation shows that RTFs increase with the amplitude of ionizing flux variations and are inversely proportional to the equilibrium temperature of the nebula and to the binary occultation period. A lower limit to is , where is propagation velocity of radiation fronts, which is of the order of (see García et al. 2013). As per the results shown in Figure 2, ergs.s-1. Then, for K and a radiation fluctuation period of 1 day one finds K.
There are limits to the minimum length scale in which temperature fluctuation occur. The scale is set by the electron mean free path, within which electron temperatures can deviate from average values. As estimated by Ferland et al. (2016), the electron mean free path is cm. This means that for sounds speeds cm/s, the maximum binary occultation period for temperature fluctuations is cm s cm days. Furthermore, resonant temperature fluctuation in photoionized nebulae are expected when ionized by short-period binary systems, with occultation periods of the order of days.
III Diagnostics of equilibrium and RTF temperatures
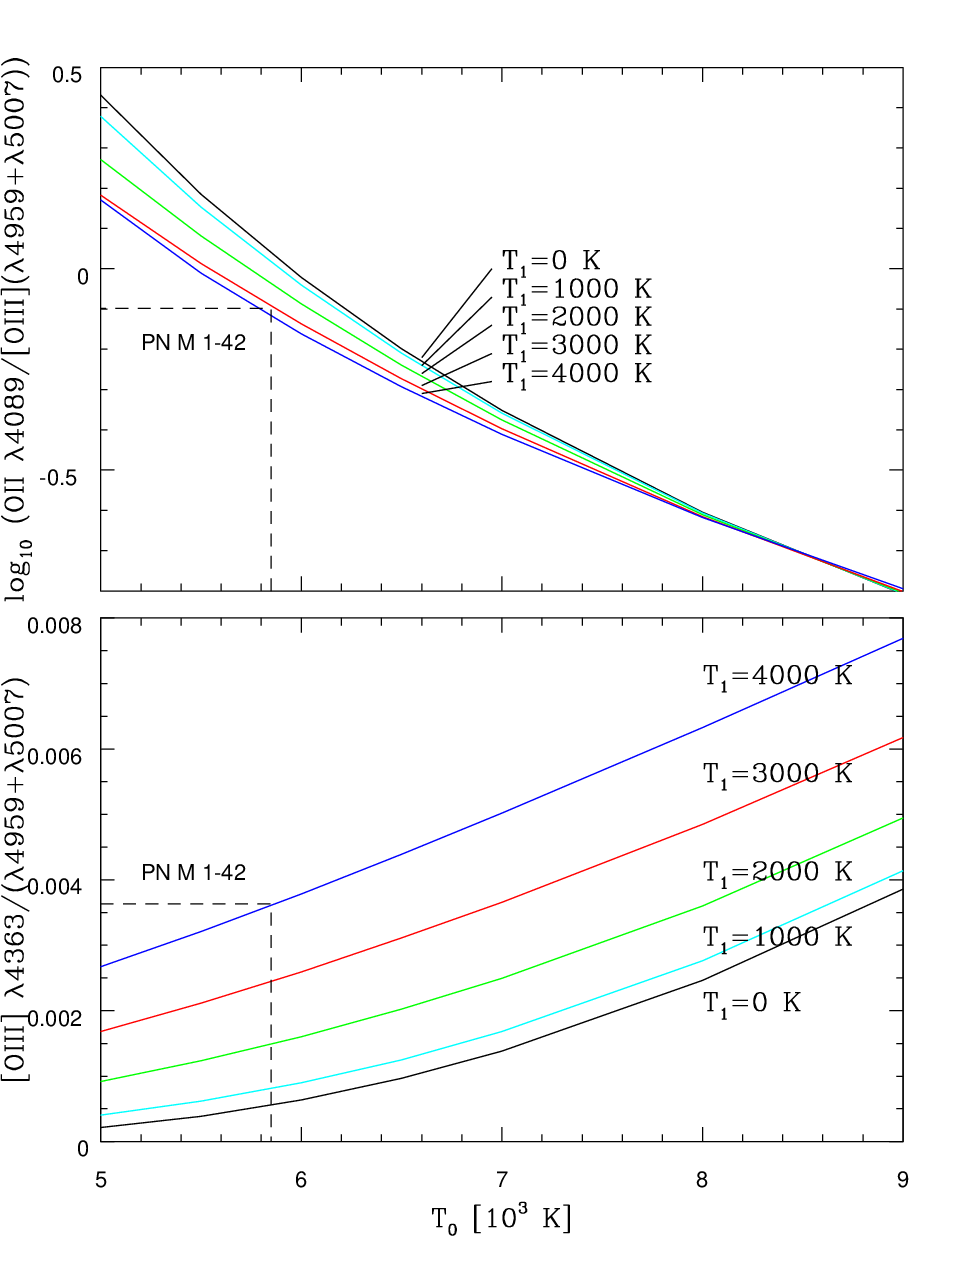
Figure 2 shows [O III] and recombination O II to [O III] line ratios as a function of the average electron temperature for various fluctuation temperature amplitudes. The [O III] spectrum was computed with atomic data from Mendoza and Bautista (2014) and the recombination lines are computed from effective recombination coefficients of Liu et al. (2001). Here the ratios are computed for a density cm-3. The observed ratios depicted in the figure correspond to the planetary nebula M 1–42 (Liu et al. 2001), which exhibits extreme oxygen abundance discrepancies, by about a factor of 20, as estimated from collisional and recombination lines. Our temperature diagnostics depicted in Figure 2 show that the nebula is consistent with an average temperature K and fluctuations with amplitude K. Though, more detailed diagnostics must allow for uncertainties in the measured line ratios as well as uncertainties in the atomic data and their propagation through the spectral models (see Bautista et al. 2013). The large RTF temperature foud in this object is explained by the relative low equilibrium temperature. The figure also shows that if temperature fluctuations are ignored the [O III] temperature diagnostic would indicate a temperature of about 9000 K and discrepancy in O2+ abundance determinations from collisional and recombination lines of about one order of magnitude, as found by Liu et al.
Our present model that explains nebular temperatures in terms of equilibrium and RTF temperatures is consistent with the model proposed by Peimbert (1967) in that Peimbert’s temperature fluctuation parameter
| (8) |
IV Conclusions
We show that large amplitude (a few thousand kelvin) resonant amplitude fluctuations are expected to form in gaseous nebulae photoionized by short-period-binary stars. Such systems yield a periodically varying ionizing radiation field, which induces periodic oscillations in the heating-minus-cooling function across the nebula. As a result, temperature perturbations in the gas with frequencies similar to those of the ionizing source will undergo resonant amplification.
Further study shows that the amplitude of the RTFs is proportional to the amplitude of the variations of the ionizing flux and inversely proportional to the equilibrium temperature of the gas. For typical conditions found in H II regions and planetary nebulae the amplitude of RTFs is of several thousand kelvin, in accord with current observational evidence of temperature fluctuations.
Further, we present a line ratios diagnostic plot that combines [O III] collisional lines and O II recombination lines for diagnosing equilibrium and fluctuation amplitude temperatures in gaseous nebulae. When applying this diagnostic to the planetary nebula M 1–42 we find and equilibrium temperature of 6000 K and a temperature fluctuation amplitude of 4000 K. This equilibrium temperature is significant lower than the 9000 - 10,000 K temperature diagnosed from [O III] collisional lines when temperature perturbations are ignored. PN M 1–42 is known to exhibit extreme temperature fluctuations, which is consistent with our prediction that resonant temperature perturbations should grow faster with decreasing nebular equilibrium temperature.
Clearly, variations in the ionizing radiation from binary stars are more complicated than a single mode plane wave. Though, these variations are periodic and as such they must be well reproduced by linear combinations of plane waves. Thus, the present treatment can be easily generalized to combinations of multiple modes of oscillation.
The temperature fluctuations described here are proper of nebulae ionized by sources that vary in intensity on a scale of few days. For sources varying on time scales of years, comparable to the ionization and temperature equilibration time scales of the gas, other type of temperature fluctuations will occur. These fluctuations are the result of thermal fronts that propagate supersonically through the nebula. These fluctuations will be the subject of future publications.
References
- [1] Abt, H.A. 1983, Ann. Rev. Astron. Astrophys. 21, 343
- [2] ElHoussieny, E.E. 2017, Ph.D. Dissertation, Western Michigan University
- [3] Bautista, M.A., Fivet, V., Quinet, P. Dunn, J., Gull, T.R, et al. 2013, ApJ 770, 15
- [4] Corradi, R.L.M., García-Rojas, J., Jones, D., Rodríguez-Gil, P. 2015, ApJ 803, 99 ElHoussieny, E.E. 2017, Ph.D. Dissertation, Western Michigan University
- [5] García, J., Elhoussieny, E.E., Bautista, M.A., Kallman, T.R. 2013, ApJ 775, 8
- [6] Ferland, G.J., Henney, W.J., O’Dell, C.R., Peimbert, M. 2016, Revista Mexicana de Astron. y Astrofis. 52, 261
- [7] Jones. D., Wesson, R., García-Rojas, J., Corradi, L.M., Boffin, H.M.J. 2016, MNRAS 455, 3263
- [8] Kallman, T. and Bautista, M. 2001, ApJS 133, 221
- [9] Kingdon, J.B. & Ferland, G.J. 1995, ApJ 450 691
- [10] Krabbe, A.C. & Copetti, M.V.F., 2002, A&A 387, 295
- [11] Krabbe, A.C. & Copetti, M.V.F., 2005, A&A 443, 981
- [12] Liu, X.-W., Storey, P.J., Barlow, M.J., Danzinger, I.J., Cohen, M., Bryce, M. 2000, MNRAS 312, 585
- [13] Liu, X.-W., Lou, S.-G., Barlow, M.J., Danzinger, I.J, Storey, P.J. 2001, MNRAS 327, 141
- [14] Liu, X.-W., Barlow, M.J., Zhang, Y., Bastin, R.J., Storey, P.J. 2006, MNRAS 368, 1959
- [15] Mendoza, C. and Bautista, M.A. 2014, ApJ 785, 91
- [16] O’Dell, C.R., Peimbert, M., Peimbert, A. 2003, AJ 125, 2590
- [17] Peimbert, M. 1967, ApJ 150, 825
- [18] Rubin, R.H., Bhatt, N.J., Dufiur, R.J., Buckalew, B.A., Barlow, M.J., et al. 2002, MNRAS 334, 777
- [19] Rubin, R.H., Martin, P.G., Dufour, R.J., Ferland, G.J., Blagrave, K.P.M., et al. 2003, MNRAS 340, 362
- [20] Tsamis, Y.G. Barlow, M.J., Liu, X.-W., Danzinger, I.J., Storey, P.J. 2003, MNRAS 345, 186
- [21] Tsamis, Y.G. & Pequignot, D. 2005, MNRAS 364, 687
- [22] Wesson, R.; Jones, D.; García-Rojas, J.; Corradi, R. L. M.; Boffin, H. M. J. 2016, arXiv:1612.02215