![[Uncaptioned image]](1709.02534v2/UofA.jpg)
Biological Cell Resonators
{tikzpicture}\shade[left color=cover,right color=grey95] (-10,0) rectangle (3.5,5);
\node(image) at (-0.7,2.5)
![[Uncaptioned image]](1709.02534v2/cel.jpg) ;
;
[left color=cover,right color=grey95] (-10,0) rectangle (3.5,0.2);
by
Dr. Jonathan Michael MacGillivray Hall, FRSA
Supervisors:
Prof. Tanya M. Monro
Assoc. Prof. Shahraam Afshar V.
Dr. Alexandre François
A thesis submitted to the degree of Doctor of Philosophy
in the
Faculty of Sciences
School of Physical Sciences
August 2017
Legal disclaimer: A digital copy of this thesis retaining copyright protection has been placed on the Cornell University arXiv, under the non-excusive distribution licence.
Academic website: http://drjonathanmmhallfrsa.wordpress.com
Declaration of Authorship
I, Jonathan Michael MacGillivray Hall, certify that this work contains no material which has been accepted for the award of any other degree or diploma in any university or other tertiary institution and, to the best of my knowledge and belief, contains no material previously published or written by another person, except where due reference has been made in the text.
I give consent to this copy of my thesis, when deposited in the University Library, being available for loan and photocopying, subject to the provisions of the Copyright Act 1968.
I also give permission for the digital version of my thesis to be made available on the web, via the University’s digital research repository, the Library catalogue and also through web search engines, unless permission has been granted by the University to restrict access for a period of time.
I acknowledge the support I have received for my research through the provision
of an Australian Government Research Training Program Scholarship.
Signed:
Date:
THE UNIVERSITY OF ADELAIDE
Abstract
Faculty of Sciences
School of Physical Sciences
Doctor of Philosophy
by Jonathan M. M. Hall
Modern sensing technologies developed within the field of photonics incorporate a number of optical and acoustic phenomena. One such effect that has become a focal point in biosensing is whispering gallery modes. These modes occur within optical cavities that exhibit a degree of symmetry, and are thus able to support resonating waves. This thesis develops the theory of resonances, exploring under what conditions a micro or nanoscale device can sustain these resonances, and for which physical criteria the resonance conditions deteriorate. The study is then extended to consider the biological cell. The discovery of a biological cell resonator, in which modes are definitively sustained without artificial assistance, represents the culmination of this thesis.
The properties of resonators and their emitted energy spectra are studied within the general framework of the Finite Difference Time Domain method, requiring supercomputing resources to probe the transient behaviour and interactions among the electromagnetic fields. The formal theory of Mie scattering is extended to develop a cutting-edge, computationally efficient model for general, multilayer microspheres, which represents a valuable achievement for the scientific community in its own right. The model unifies the approaches in the field of mathematical modelling to express the energy spectrum in a single encompassing equation, which is then applied in a range of contexts.
The gulf between modelling and biological resonators is bridged by an in-depth study of the physical characteristics of a range of biological cells, and the selection criteria for viable resonator candidates are developed through a number of detailed feasibility studies. The bovine embryo is consequently selected as the optimal choice.
The scientific advancements contained within each chapter, including the improved models, the selection criteria and the experimental techniques developed, are integrated together to perform the principal measurements of the spectra within a biological cell. Evidence is established for the ability of a bovine embryo to sustain whispering gallery modes. This is a significant finding covering extensive research ground, since it is the first such measurement world-wide. The ability of a cell to sustain modes on its own represents a conceptually elegant paradigm for new technologies involving on-site cell interrogation and reporting of the status and health of a biological cell in the future. The methodological and technological developments contained within this interdisciplinary thesis thus become a vital asset for the future realisation of autonomous biological cell sensors.
Acknowledgments
In this thesis lies a significant œuvre of work across multiple disciplines, including all the inherent logistical challenges of such a task. I would like to formally acknowledge my supervisors for their respective roles in this project: Prof. Tanya Monro, through the Australian Research Council Georgina Sweet Laureate Fellowship which supported the Laureate Scholarship, Assoc. Prof. Shahraam Afshar Vahid, and Dr. Alexandre François.
The unending positivity of Prof. Mark Hutchinson must be mentioned, along with the dedicated professional staff of the Centre for Nanoscale BioPhotonics, especially Ms. Melodee Trebilcock, both of whom I was able to turn to when the management psychology of such diverse interdisciplinary research led inevitably to conflicting procedural expectations.
My friends and colleagues, Dr. Tess Reynolds and Dr. Matthew Henderson, were also always supportive. I wish to thank Mr. Steven Amos for his help during all the hours I spent over at the School of Chemical Engineering, and for teaching me the chemistry and practices required to mix my own media, and also Dr. Nicolas Riesen for conversations about measurement apparatus. My thanks also go to Dr. Wenle Weng, who assisted me in the clear measurement and identification of whispering gallery modes early in the experimental portion of the project.
For all my friends in the OSA and SPIE Adelaide University Chapters, the IONS-KOALA 2014 International Conference organisation committee members, and the wonderful experiences we shared together to pull off the best conference in the series.
Interstate, the moral support I received for the supercomputing portion of the thesis from Prof. Andrew Greentree and my friend and colleague Dr. Daniel Drumm (RMIT) should not be understated. In addition, the directional insights of Prof. Ewa Goldys (Macquarie University) have helped keep my research priorities focused.
The resources from eResearch SA, and The National Computational Infrastructure (NCI) Facility (ANU) were vital in the completion of the early modelling investigations.
I wish to thank The University of Adelaide, Adelaide Enterprise, and The University of South Australia, as many people came forward to assist me at different phases of the project. I thank the Robinson Research Institute in reproductive health for their time and resources, including the assistance and understanding of my friend Mr. Avishkar Saini.
On a personal level, I thank my friends for their support and understanding, especially Ian Kennedy, for all the conversations we had. I also thank the Burnside Symphony Orchestra and Haydn Chamber Orchestra for doing without me by the end of the project. The ongoing interest I keep to heart with Prof. Derek Leinweber, Elder Prof. Anthony Thomas and the CSSM, and the perpetual Visiting Research Associate status they granted me early in the project to continue integrating my research skills across multiple sub-fields was greatly valued. Finally, and most importantly, I acknowledge my family for unending support through all the complex phases of the project for whom any thanks I could bring to bear would be inadequate.
Contents
Doc-Start Doc-Start Doc-Start Doc-Start Doc-Start chapter*.1 section*.2 section*.2 figure.caption.3 figure.caption.3 chapter.1 section.1.1 section.1.2 subsection.1.2.1 subsection.1.2.2 section.1.3 section.1.4 section.1.5 chapter.2 section.2.1 section.2.2 subsection.2.2.1 subsection.2.2.2 subsection.2.2.3 subsection.2.2.4 section.2.3 subsection.2.3.1 subsection.2.3.2 subsection.2.3.3 subsection.2.3.4 section.2.4 chapter.3 section.3.1 section.3.2 subsection.3.2.1 subsection.3.2.2 subsection.3.2.3 section.3.3 subsection.3.3.1 subsection.3.3.2 section.3.4 section.3.5 chapter.4 section.4.1 section.4.2 subsection.4.2.1 subsection.4.2.2 subsection.4.2.2 equation.4.2.13 equation.4.2.20 section.4.3 subsection.4.3.1 subsection.4.3.2 equation.4.3.41 equation.4.3.49 section.4.4 section.4.5 chapter.5 section.5.1 section.5.2 section.5.3 section.5.4 section.5.5 subsection.5.5.1 subsection.5.5.2 subsection.5.5.3 subsection.5.5.4 subsection.5.5.5 subsection.5.5.6 section.5.6 section.5.7
chapter.6 section.6.1 section.6.2 subsection.6.2.1 subsection.6.2.2 subsection.6.2.3 subsection.6.2.4 subsection.6.2.5 subsection.6.2.6 section.6.3 section.6.4 subsection.6.4.1 figure.caption.65 subsection.6.4.2 subsection.6.4.2 figure.caption.69 subsection.6.4.3 subsection.6.4.3 section.6.5 chapter.7 section.7.1 section.7.2 section.7.3 section.7.4 section.7.5 section.7.6 chapter.8 section.8.1 section.8.2 subsection.8.2.1 chapter*.80 section*.81 appendix.A section.A.1 section.A.2 appendix.B section.B.1 section.B.2 section.B.3
appendix.C section.C.1 subsection.C.1.1 subsection.C.1.2 subsection.C.1.3 section.C.2 section.C.3 section.C.4 section.C.5 appendix.D section.D.1 section.D.2 section.D.3 section.D.4 subsection.D.4.1 subsection.D.4.2 section.D.5 appendix.E section.E.1 section.E.1 section.E.1 section.E.2 section.E.3 section.E.4 section.E.5 section.E.6 section.E.7 section.E.8 section.E.9 section.E.10 section.E.10
List of Figures
List of Tables
O Prologue
Overview
“Interdisciplinary research (IDR) is a mode of research by teams or individuals that integrates information, data, techniques, tools, perspectives, concepts, and/or theories from two or more disciplines or bodies of specialized knowledge to advance fundamental understanding or to solve problems whose solutions are beyond the scope of a single discipline or area of research practice.”
National Academy of Engineering, National Academy of Sciences, Policy and
Global Affairs, Institute of Medicine, Committee on Science, Engineering, and
Public Policy, Committee on Facilitating Interdisciplinary Research,
Facilitating Interdisciplinary Research, p. 39 (2005)
[1].
The synthesis of physics, chemistry and biology involves the development of a wide arc of complementary techniques, and the exploration of new methodologies for addressing key mysteries in nature. In combining disparate fields, a cogent way forward is to apply the knowledge from each discipline in order to pose questions that are not within reach of any one field alone. In this thesis, such a synthesis is attained through the use of fundamental physics principles applied to biological cells.
While a range of scientific developments developed herein, both technological and methodological, may be viewed as standalone achievements providing value to their respective fields in their own right, in the broader vision of the project, one may integrate the experimental methodologies, the models, the findings, the analyses and the conclusions in order to encapsulate the discoveries into a coherent narrative.
I begin this narrative by noting a simple, compelling observation: that symmetry can lead to resonance. In the context of photonics, introducing light into a microscopic symmetrical object under specific conditions will cause it to resonate in a way that is highly sensitive to its immediate environment, as well as to its own geometry. In this sense, a resonator can act as a sensor. The resonances, and their behaviour under a variety of conditions, yield insights into both the structure and the electromagnetic influences acting on the resonator, and many instances where such effects represent a new frontier in scientific understanding are in the field of biology.
To have a cell act as a resonator is to have a new window into its internal structure and its immediate surroundings. The fundamental symmetries extant in the building blocks of living matter present a compelling new direction in biosensing, where cells and their environments can be interrogated directly, producing or trapping photons at the site of inquiry in order to provide crucial information on their status and their features.
At the outset of the journey, one must take stock of the specific aims and tools at one’s disposal for exploring the research question of the present study. But first, I outline the vision.
Vision
To begin, I pose the question of whether a biological cell can sustain resonances, with the ultimate aim being the generation of such resonances within a living cell. I explore the physical requirements for achieving this goal, and the parameters that might serve to hamper its realisation, making particular use of whispering gallery modes – a phenomenon indicative of the resonant behaviour of waves within a symmetrical object.

First, the underlying principles of resonators are investigated and developed through a number of feasibility studies, with the focus on resonators that either resemble cells or include features that are useful for understanding the methodological requirements for cell resonators. In pursuing such an investigation, new computational methods and analytic models are developed, and as a result, new aspects of resonator behaviour are uncovered that extend beyond the known work in the field. Upon presenting the necessary tools for a systematic inquiry into the possibility of a cell resonator, the cells that may provide an adequate testing ground for this purpose are enumerated, and their necessary physical requirements are explained. The most promising cell candidate is then identified – the bovine embryo, which is then subjected to a detailed analysis of its properties with respect to these physical requirements. The results of the studies are verified through the development of sophisticated modelling capabilities, each of which has been carefully designed to address the key challenges that present themselves at each milestone of the project. For example, bovine oocytes comprise a spherical outer shell, known as the zona pellucida. Unfertilised oocytes also exhibit special outer cells attached to the zona pellucida known as cumulus cells, as shown in Fig. 1, which disengage and dissipate upon fertilisation. It will become clear through the course of this thesis that for such a cell to be realised as a viable resonator, these cells need to be removed before achieving a resonance, either by selecting the right stage of embryo development after fertilisation, or otherwise rendering the embryo free, or denuded, of these extra cells.
The details involved in carrying out this process are then explained, which involve complex logistical demands, and new developments in interdisciplinary scientific methodology. Finally, the results are summarised and interpreted in the context of the main research question, reaching their denouement in Section 6.5 of the thesis.
With the overall vision in mind, this study represents a new step in characterising the ability of biological cells to act as resonators, and in outlining and explaining the methodological challenges faced by researchers embarking upon a similar path in the future.
Aims
In this thesis, the main aim is to develop the methodology required for
examining the key research question, namely, whether a biological cell can act
as a resonator, making use of whispering gallery mode resonances. In order to
achieve this aim, I will explore:
The development and tailoring of models designed to mimic
spherical, near-spherical and imperfect resonators;
The properties and use of hollow cavity resonators, such as
microbubbles, which share geometrical features with certain
biological cells;
A non-invasive method for extracting the geometric parameters from
well studied microresonator structures;
Multiple-layer resonator models that can account for a variety of
mode excitation strategies, including active fluorescent-layer coatings such
as those that have proved expedient in biosensing developments in the
literature;
The physical criteria required for a biological cell to act as a
resonator;
A number of candidate cell types that are most likely to be
feasible;
A variety of interrogation techniques, both passive and
active, for the detection of whispering gallery modes, including
the prism coupler, the fibre taper and doping with fluorescent materials;
A simple proof-of-concept using a similar-sized artificial
analogue of a cell in a sample of media; and
A critical study of the most promising cell candidate, using
the techniques listed above.
Roadmap of the thesis
While the narrative of the thesis involves the advancement of knowledge in a range of contrasting research areas, material pertaining to separate disciplines has been grouped together in chapters, where possible. Chapter 1 provides a summary of the field of biosensing, specifically relating to whispering gallery mode resonators, and how the project is to be formulated in the context of biosensing. Those from a physics and engineering background will find particular value in Chapters 2 and 3, which explores the properties and the behaviour of power spectra obtained from microsphere and microbubble resonators using computational and analytic tools to yield new insights in facilitating resonator design. The heart of the mathematical modelling work presented herein is Chapter 4, in which a unified description of general, multilayer resonators is presented. Experts in the field of biology will find Chapter 5 provides a comprehensive description of the challenges encountered in measuring physical attributes of cells using a variety of methods. The criteria developed in this chapter are applied experimentally in Chapter 6, in which the apparatus, measurements and final analysis are presented, drawing together the multiple strands of the thesis. This chapter contains a combination of experimental optical physics, chemistry and biology.
In addition, it is intended that an exploration of these interdisciplinary themes will yield new insights into the methods of characterising resonances, the models used to investigate them, and the physical parameters required of a resonator, as key developments in themselves.
Therefore, as much as possible, each critical development explored in this
thesis is explained in terms of its wider application
to the fields of photonics and biosensing, as well as keeping with the
directed narrative of the interdisciplinary vision.
“Interdisciplinary thinking is rapidly becoming an integral feature of research as a result of four powerful “drivers”: the inherent complexity of nature and society, the desire to explore problems and questions that are not confined to a single discipline, the need to solve societal problems, and the power of new technologies.”
National Academy of Engineering, National Academy of Sciences, Policy and
Global Affairs, Institute of Medicine, Committee on Science, Engineering, and
Public Policy, Committee on Facilitating Interdisciplinary Research,
Facilitating Interdisciplinary Research, p. 40 (2005)
[1].
1Introduction
This thesis primarily focuses on the investigation into the optical phenomenon known as whispering gallery modes (WGMs), and its application to biosensing and biological cells.
The use of WGMs for biosensing has risen to a prominent place in the literature [2, 3, 4, 5, 6, 7, 8, 9, 10, 11, 12, 13, 14]. Part of the reason for this is that the applications extend well beyond physics, in the detection of biological matter such as macromolecules. It has been demonstrated that devices known as microresonators – microscopic objects exhibiting a degree of symmetry which can support WGMs (described more precisely in Section 1.2) – can be sensitive to the presence of virions, animal cells and bacteria [15], as well as proteins [16, 2, 3, 4] and DNA [9, 13]. In some cases this can be achieved to the level of a single molecule [17, 14]. Consequently, WGMs can be used to circumvent the requirement of fluorophore markers for the labelling of proteins, antibodies, amino acids and peptides, which are restricted in their use to specific biological targets [15, 13, 18, 19]. Such label-free detection technologies also include Raman scattering microscopy [20, 21], autofluorescence [22], intracavity spectroscopy [23], microphotonic sensors [24] and the use of surface plasmon resonances [25, 26], to name a few, and have been widely used in the field of biosensing for some time.
Parallel to the development of biosensing applications, WGMs have also been used for a range of other fundamental scientific studies, such as high-efficiency optical frequency combs [27, 28, 29], nonlinear optics [30] and quantum electrodynamics (QED) [31, 32, 33, 34]. The construction of chains or arrays of WGM resonators has also been reported in the literature [35, 36], potentially leading to the development of perfect absorbers for use in solar panels [37, 38], focusing microscopes, laser scalpels and polarisation filters [36], and for the investigation of metamaterials [39, 37].
The specific topics that form the basis for this thesis are the techniques for the generation of whispering gallery modes within a cavity, the biosensing applications of WGMs, the development of mathematical models of microresonator behaviour, including both analytic and computational methods used in computing the resonances, and cell biology. The goal will be to investigate the possibility of generating whispering gallery modes within a biological cell, as explained in Section 1.4. A significant amount of physics will be involved in interpreting both the computational results and the experimental outcomes.
1.1 Whispering gallery modes
Whispering gallery modes can be produced in microresonators, which exhibit a geometry that includes at least one axis of revolution, so that electromagnetic waves travel along the interface between the two materials. These waves largely remain bound due to total internal reflection (TIR). Resonances occur when the round trip of a wave is an integer multiple of the wavelength.
Consider, for example, a spherical object constructed from a material with a refractive index higher than its surrounding environment, which acts as a resonator. Figure 1.1(a) depicts a circular cross section of such a resonator. A microscope image of this effect in a silica microsphere (diameter m) in the laboratory is shown in Fig. 1.1(b), with the same microsphere shown under a white light source in Fig. 1.1(c). The sphere is connected to a silica glass rod. The central bright spot corresponds to the reflection of the white light source into the objective. The WGMs are apparent around the equator of the microsphere. The wave pattern near the outer boundary of the resonator illustrates the minima and maxima of, for example, the electric field. In this scenario, the wave returns to its original position in phase, which will only occur for those specific wavelength values that correspond to the WGM resonance positions. As a result, the modes are quantised, in that only certain values are admissible as resonances for a given resonator and its environment. A detailed discussion on this quantisation condition, and the method for the determination of the mode positions, is presented in Section 2.2, and developed as part of the multilayer model in Chapter 4.


(a) (b) (c)
As will be seen in the discussion of microsphere sensors in Chapter 2, the mathematical description of these modes requires the three eigenvalues of the quantisation condition. These quantum numbers correspond to the azimuthal (), polar () and radial directions () in spherical polar coordinates, as illustrated in Fig 1.2. For an example circular cross section in the plane, shown in Fig. 1.1(a), the number of surface nodes required to bring the wave back to its initial position in phase is related to the azimuthal quantum number, whereas modes that extend further into the centre of the microsphere are related to the radial mode number. The modes of the microsphere also fall into one of two categories, describing their polarisation – transverse electric (TE) or transverse magnetic (TM) modes. Simply put, this notation states that the orientation of the three-vector electric fields () or magnetic fields () have no component in the radial direction of the coordinates of the sphere, shown in Fig. 1.2. A more complete discussion of the conventions that exist for the definition of the polarisations is given in Section 4.2 and summarised in Appendix A. Although more complicated mode patterns exist in general, the resonances of a microsphere can always be decomposed into a superposition of modes corresponding to these polarisations [40].

WGMs include a set of radiation modes and bound modes, which are discussed in the context of computational modelling in Section 2.3, and investigated within a unified framework in Section 4.2. They produce an evanescent field, which is the portion of the electromagnetic field that extends beyond the surface of the resonator into the surrounding medium. As a consequence, the wavelength values that correspond to the resonances are highly sensitive to the geometric characteristics of the resonator, such as its diameter, its asphericity, and the refractive index contrast between the resonator and its surrounding medium [41]. The index contrast determines the amount that the evanescent field extends into the surrounding medium, thus affecting the refractive index sensitivity of the modes within the resonator [3]. It is the mode sensitivity in particular that makes the WGM resonator a compelling candidate for biosensing applications.
1.2 Microresonator architecture
Whispering gallery modes can be generated in a wide range of different geometries, including those with a circular cross section outlined in Section 1.1, as well as more exotic shapes, as follows.
The literature on microresonators includes a wealth of varied examples, such as micropillars [42, 43], microbottles [44, 45, 46], toroids [47], disks [48, 49, 50, 51], rings [18, 52], photonic crystals [53, 54, 55, 56, 57, 58] and other resonator designs that exhibit some degree of symmetry in at least one axis of revolution [59, 60, 61, 62, 63], which can even include the cross sections of waveguides or extruded slabs of dielectric material [64, 65]. The materials used in constructing artificial resonators include amorphous [16, 14, 66, 67] and crystalline [68, 69, 70, 71, 72, 34, 73] inorganic materials and polymers [74, 75, 76].
In this work, the primary focus will be on resonators in spherical or microbubble form. The reason for this is that the biological cell candidates considered in Chapter 5 are spherical at first approximation, and can contain multiple protein layers. Spheres represent optimally symmetric objects, and are often found in natural settings where the external force of surface tension applied evenly to the outermost layer of the cell encourages such shapes to form. Although cells exist that are closely related to other symmetrical shapes (such as the erythrocyte – the red blood cell, which resembles a biconcave disk [77]), the dependence of the quality of the modes on the diameter and the refractive index of a resonator, described in Sections 3.2.3 and 5.3, indicates that cells of much larger diameter represent the most viable candidates for sustaining WGMs. The ensuing investigation will also guide us towards those that are predominantly spherical in shape.
1.2.1 Passive resonators
Although the wavelength positions of resonances are highly dependent on the geometric parameters of the resonator, the measurement of these resonances cannot occur in practice unless electromagnetic radiation is introduced. In such circumstances the electromagnetic field is said to couple to the resonances, and these resonances are then said to be excited by the radiation.
A wide range of strategies has been investigated in the literature for the excitation of WGMs in microresonators. Passive interrogation describes the case where external radiation is introduced into the resonator through the coupling of light at the material interface, rather than active interrogation, where the excitation occurs from within the resonator itself, such as via a fluorescent medium. These methods will be explored more thoroughly in Chapters 5 and 6, where the advantages and disadvantages of each method are investigated in depth. The methods of passive interrogation include the coupling of the light through a prism via frustrated TIR [78, 59, 79]. Waveguides [35, 80] and fibre tapers [47, 81, 82] have also been used to achieve mode coupling. In the case of the prism, the incidence angle must be tuned to fulfill the phase-matching condition, describing the equalisation of the propagation constant of the incident beam with the WGMs of the resonator [83]. Phase-matching represents an important topic in the generation of WGMs, and will be discussed in detail in Section 2.2, and used extensively in Chapter 6, particularly for the experimental interrogation methods reported in Section 6.4.2. In the case of optical fibres, the taper waist must be fabricated to fulfill this same condition [59, 79] in order to allow coupling to the WGMs, as shown in Fig. 1.3.
The requirement of an external evanescent coupling configuration, which typically must be tuned or calibrated carefully in order to achieve mode coupling, can render applications outside a laboratory setting problematic. This is because the physical space and time constraints involved in achieving on-site measurement within a biological environment are often limited, especially if living matter is involved. An alternative approach, which is able to ameliorate some of these limitations, is that of active resonators.

1.2.2 Active resonators
It is possible for the excitation of WGMs to occur from within the resonator itself, using fluorescent nanocrystals [84, 85, 86], quantum dots [87, 39, 88] or organic dyes [89, 90, 91, 75, 92, 93]. This allows for free-space excitation of the WGMs [94, 75, 95], in which the fluorescent medium is excited by a laser through a microscope objective in the absence of a radiation coupling device, such as those explored in the case of passive interrogation. This excitation strategy is worth exploring in more detail, because it presents a range of compelling features and advantages that passive techniques are not able to match at the present time. The active interrogation method will be a focus for the development of the models described in Chapters 3 and 4.
The first report of an active WGM resonator in the literature occurred in 1961, shortly after the construction of the first laser by T. Maiman [96]. In this case, samarium-doped CaF2 microspheres were excited using a flash-lamp. It was found that a major advantage of active resonators is that they allow for remote excitation and collection of radiation, ultimately allowing the resonators to probe biological entities, or to sense macromolecules [15, 16, 2, 3, 4, 9, 13, 17, 14].
Active resonators contain a gain medium, described below, and upon excitation, the emitted fluorescence intensity is modulated by the resonance frequency. This is a direct result of the Purcell effect [97], which, in brief, describes the reduction of the lifetime of the emission, thus increasing fluorescent intensity at resonant wavelength values [98, 99, 100]. The Purcell effect will be explained in more detail in Section 2.2. The most important aspect of fluorescence-based resonators, besides the selection of the resonator geometry, is this gain medium, which provides the required fluorescence emission.
Fluorescent dyes are the most common gain medium used for active microresonators, as they typically provide a broad range of emission wavelengths, stretching from the ultraviolet to the visible [89], and in some cases, through to the near infrared [90, 91]. The literature on the chemistry of various organic dyes in polymer matrices is extensive, and includes dyes for which the solubility and reactivity can be classified on the basis of the presence of azo (–N=N–) groups, quinone groups (anthraquinone dyes), or phthalocyanines [101]. These organic fluorophores are commonly mixed with a polymer, such as PMMA [102, 76, 103], SU [104, 105], PDMS [106] or polystyrene [107, 108, 95], and subsequently fabricated directly into a chosen resonator design. Alternatively, fluorescent dyes can be introduced into already-formed polymer microresonators. One common method, especially for polystyrene microspheres, is to use a two-phase liquid system. In this case, the resonators are suspended in an aqueous solution while the fluorophore is dissolved in an organic dye that is not miscible with water [75]. As an alternative, resonators can simply be coated with fluorescent dye molecules using chemical moieties on both the dye and the resonator surface [92, 93]. It is this latter technique, in particular, which is followed in Chapter 3 to examine the properties of dye-coated silica microbubbles [109], with a view toward simulating the fluorescent signal obtained from biological cells.
Exactly which of these methods, both passive and active, is most suitable for achieving the realisation of a functional, biological cell resonator, and what methodological alterations need to be made to accommodate this unique scenario, will be the principal subject of Chapter 6. It is clear, however, that it is important to understand how each method relates to biosensing.
1.3 Biosensing
One particularly engaging aspect of modern research developments into resonator technology is the application to the sensing or measurement of important quantities in biology or medicine. WGMs represent a key optical phenomenon for sensing due to the sensitivity of their evanescent field to nearby entities, such as biomolecules, which break the symmetry of the electromagnetic field, thereby causing a measurable shift in either the resonance positions or intensities [110].
In biosensing, the detection of single particles has become well established using passive resonators, with multiple demonstrations being documented [110, 111, 112]. However, the free-space excitation and collection platform provided by active resonators enables novel applications that cannot be achieved with passive resonators. For example, free-floating resonators can be inserted into living cells for sensing [107], or tagging and tracking purposes, using the specific spectral fingerprint of each individual WGM resonator [113, 114]. The development of WGM measurement techniques in the context of biological cells is a key emphasis of this thesis, and will be discussed in more detail as the project formulation is presented in Section 1.4.
Fluorescent-based interrogation methods have also been used in conjunction with smaller resonators, with extents of the order of microns (m) [75, 115, 116]. These resonators exhibit a number of advantages over their larger counterparts. Firstly, they are more localised, providing greater scope for placement of the resonator at the site required for sensing. The size of a resonator, in addition to the index contrast, also affects the refractive index sensitivity of the modes, the combination of which has recently been explored through the use of a figure of merit [115]. Smaller resonators constructed from a given material with a certain refractive index, and in a given medium, exhibit an evanescent field that extends further into the medium than is the case for larger diameter resonators with the same index contrast. In the context of biosensing, this means that less material is required for observing a shift in the WGM positions, allowing scope for the detection of single particles [117, 111, 112], and in some cases, single molecules [17, 14].
On the other hand, smaller resonators are more susceptible to loss of confinement and more sensitive to geometric deformations or increased ellipticity, as a consequence of their extended evanescent field [115, 118]. This has the effect of reducing the clear definition of the modes, which is most commonly characterised by the quality factor, or -factor – a quantity that will be a particular focus in this thesis, and will be discussed in detail in Chapter 2. It is worth noting that active resonators typically exhibit lower -factors than their passive resonator counterparts, owing to their reliance on excitation methods that typically have no preferred electromagnetic alignment, which offsets the practical advantages afforded by the convenience of free-space interrogation.
It has been shown that fluorescent resonators can be turned into microscopic laser sources using a lasing gain medium and a suitable pump source, enabling higher -factors to be realised upon reaching the lasing threshold [75, 119, 76, 120, 121, 122, 123, 124] and lowering the detection limits for sensing applications [94, 119]. The determination of the lasing threshold can be achieved numerically [125] through use of the lasing eigenvalue problem (LEP) formulation, which introduces the gain through an imaginary part of the refractive index [126, 127]. However, exactly how the -factor and the effective mode volume of the resonator, , both influence the lasing threshold and the mode behaviour above the lasing threshold remains an unresolved issue. Early work by Sandoghdar et al. indicates that the lasing threshold of neodymium doped silica microspheres has a linear dependence on [128], whereas Spillane et al. suggested a dependence on [129]. More recently, Gargas et al. established a dependence on for the lasing threshold of a ZnO microdisk [130], among other factors such as the diameter of the disk, further indicating that the behaviour of the lasing WGMs and the determination of the lasing threshold are not fully understood.
Single cells have been reported to be transformed into WGM resonators by injecting a mixture of fluorescent dye and high refractive index oil, thus providing the required laser gain medium to generate WGMs, as well as some degree of confinement due to the refractive index contrast between the oil droplet and its surrounding environment [114]. Furthermore, by combining fluorescent microspheres with flow cytometry, automated high-throughput sensing has been achieved, using a robust data analysis algorithm to extract real-time information about resonator properties from their WGM spectra [131]. Fluorescent cholesteric liquid crystal core shell structures have also shown potential as magnetically transportable light sources for in-channel illumination applications [121].
With such a wide variety of research avenues in the field of biosensing, it is worthwhile reminding the reader how the research question is to be formulated in the context of the techniques and methods developed in this thesis.
1.4 Formulation of the project
As a complementary approach to the myriad techniques that have been developed in the literature, the concept of a biological cell acting as a resonator itself will be explored herein. This research direction is conceptually quite separate from the integration of existing microresonator sensors with biological cells, involving the introduction of microspheres onto or within the cell membrane [107]. In effect, what is being proposed is to investigate whether a cell is able to support resonances on its own, that is, without the use of an artificial cavity known to be able to sustain modes. By generating photons at the site of inquiry through the aforementioned methods of active interrogation, the measurement of resonances would, in a sense, be reporting on the immediate internal and external environment of the cell itself. If successful, this would represent an elegant conceptual development in the field of biosensing. It is also possible that the natural autofluorescence of cells themselves could potentially be harnessed to generate modes, for example, in mammalian oocytes (such as those shown in Fig. 1.4, and described in more detail in Chapter 5). The consequences of being able to measure modes sustained naturally by a living cell could potentially lead to new insights into the complex biological environment inhabited by living matter.
As a result, the microresonators that will be considered in detail will be confined to those that act as a direct analogue for a particular class of biological cell. The models developed in this thesis become progressively more sophisticated as the understanding of the mode behaviour and the criteria for sustaining WGMs are refined. The class of biological cell identified in Chapter 5 is then explored for its potential use as a biological resonator.
A detailed summary of the structure of the thesis is as follows.


1.5 Structure
Like the structure of a cell, the thesis is multi-layered. While the roadmap presented in the Prologue indicates the respective disciplines and areas of interest treated within each chapter, a technical summary of the thesis structure is as follows.
In Chapter 2, the technology underpinning WGM sensors is explained, and a computational toolkit developed, which is able to handle deformations and inhomogeneities in microspheres. The model is tested against known and verified analytic models from the literature. Chapter 3 demonstrates the customisability of the toolkit, incorporating a single-layer ‘bubble’ structure, as well as a uniform layer of dipole sources, representing a fluorescent active medium. A non-invasive spectrum-based method for the extraction of key geometric data from such resonators is presented. In order to counteract the resource limitations of these complex computational models, especially for large scale (diameter m) cells, an efficient, multilayer microsphere model is developed in Chapter 4, and harmonised with the existing models in the literature. The unique feature of this model is its ability to incorporate a number of different excitation strategies, including any number of dipole sources or active fluorescent layers, into a unified formula.
Throughout the initial chapters, the vision underpins each summary discussion, in order to maintain the scope of the topic on cell resonators. This theme becomes the prominent discussion topic in Chapter 5, where the search for a candidate cell, its required physical criteria, and the feasibility of the most suitable choice are explored. The technologies developed thus far are then applied to the best candidate cell, and the experimental setup and methodology are expounded in Chapter 6, which represents the denouement of the thesis. With the experiment and analysis concluded, the future impacts of the research are discussed in Chapter 7. The final evaluation of the work presented herein, and a summary of the main contribution of this thesis, forms Chapter 8. After briefly exploring the status of this work in the broader context of the vision, I append proofs, checks and ancillary information ill-suited to the main body of the work, and supporting publications for the thesis.
2Spherical Sensors
2.1 Microsphere sensor technology
Modern sensing technologies form a vital part of photonics research applications. Microspheres in particular have attracted much interest in different fields of research, such as remote atmospheric sensing [132, 133], photonic band-gap devices [80, 134], fluorescence spectroscopy [135, 136, 137], nonlinear optics [28, 138, 29, 139, 140, 141], superscattering [142], and metamaterial absorbers [37, 38]. There are also numerous theoretical works on light scattering from microspheres [132, 136, 143, 144, 145, 146, 133, 147, 41, 148], commonly based on the fundamental principles of Mie scattering [149], which even the most sophisticated models must be able to reproduce.
It is of special interest in this thesis to explore aspects of microspheres that can be adapted for biosensing applications [16, 3, 5, 150, 151, 11, 13, 152, 75]. One should note that the microsphere is the simplest three-dimensional test case for a more extensive biological cell analogue, the development of which will occupy Chapters 3 and 4 of this thesis. It is therefore worthwhile to understand the key aspects of microsphere sensors, their WGM behaviour, the models that describe them, and their expected similarities to and differences from biological cell resonators. The development of a customisable toolkit, based on the Finite-Difference Time-Domain (FDTD) method, represents an important part of this exploratory study. FDTD is particularly suitable in this context, because of its ability to incorporate a range of deformations and novel structures, while at the same time achieving a slice-by-slice record of the behaviour of the electromagnetic fields. This wealth of simulated data can be analysed, aggregated into a power spectrum, defined as the power emitted from the resonator over a given wavelength range, or used to access transient or emergent optical phenomena, as will be explained in Section 2.3.
In FDTD, once the geometry of the microsphere resonator and flux collection methods have been established, the WGM spectrum is introduced, and a range of useful properties is analysed in a variety of scenarios. The results of the simulations are connected to the well established physical phenomenon of Mie scattering, and finally, the distribution of the emitted radiation in the vicinity of a microsphere is examined.
Recent technological advances have led to new possibilities for using microspheres with several dielectric layers, coatings of active materials, or doped with fluorescence nanoparticles, as described in Chapter 1. As a result, there is now a necessity to develop more advanced models, as well as efficient numerical simulation tools, for describing these resonators and their excitation schemes accurately. Currently in the literature, a number of models exist that individually describe one of the following: the wavelength values of microsphere resonances [153, 41], the emitted spectra anticipated from embedded dipole sources [154, 143] or active layer coatings [136], and also single [147, 148] and multiple layer [154, 144, 145, 146, 133] microsphere scenarios that do not include the ability to calculate WGM spectra. These models are not all written using the same notation, making the combined use in their present forms impractical. Some computational methods are numerically unstable in certain parameter regions, such as resonators with very thin layers, introducing large artefacts that adversely affect the simulated spectrum [155]. Some approaches require a multitude of separate equations [133], thus making a unified analysis that incorporates all previously developed features an attractive prospect. This unified model is developed in Chapter 4, and represents a chief accomplishment of this thesis.
The simulation techniques in the aforementioned works represent an important class of tools for the interpretation of WGM spectra obtained from optical resonators. They may be used to identify the mode orders in a given WGM spectrum [152, 156], and facilitate resonator design [157, 115, 158]. Furthermore, the ability to calculate the underlying geometric parameters of a given resonator based solely on its spectrum [109] makes the development of robust models for resonators of high importance.
2.2 Analytic models for spherical resonators
In this section, the literature on the mathematical modelling of microsphere resonators is summarised, as a prelude to development of a new, unified model presented in Chapter 4, which allows the features of these previous models to be combined using a consistent notation. A comparison of the different methods in the literature with the fully developed model of Chapter 4 can be found in Appendix C.
To begin, I consider that analytic models describing WGMs in the literature can be split into two categories: models that provide only the positions of the TE and TM modes [153, 41], which are unable to predict the profile of the output spectrum, and models that consider the full behaviour of the electric and magnetic fields both inside and outside the resonator [132, 159, 160, 161, 143, 136, 162, 163, 164]. Although the simpler analytic models used in the literature are comparatively efficient to calculate, the TE and TM modes obtained through geometrical arguments [153, 41] do not include the ability to generate spectra, nor do they take into account radiation losses.
Both these two types of analytic model rely on the assumptions that a microsphere resonator is perfectly spherical with no surface roughness, that it consists of a medium that is homogeneous in refractive index, and that the total radiated power is collected without directional bias. The formulae for the resonance positions and spectra must therefore be rederived separately for scenarios that consider different resonator shapes or inhomogeneities, and this can become cumbersome.
2.2.1 Johnson model for WGM mode positions in microspheres
The simplest analytic model that provides the positions of the TE and TM modes is particularly useful for identifying the mode numbers of the WGM peaks that occur in the spectrum of a dielectric microsphere resonator [153, 41]. For brevity, this model will be denoted the Johnson model [153]. The resonance positions identified by this model exactly match the results of Mie scattering theory [149], and this will provide a benchmark of comparison that will be used in Section 2.3.3 for the investigation of alternative excitation strategies.
According to the Johnson model [153, 41], the derivation of the WGM resonance condition for a dielectric sphere is now shown. Starting from a general construction, a continuous electric field, oscillating with frequency , takes the form , for a vector position with respect to spherical coordinates, with the origin placed at the centre of the microsphere. This satisfies the Helmholtz wave equation
| (2.1) |
for a wave-number , where is the speed of light in a vacuum. The refractive index function changes value across the boundary of the resonator and its surrounding medium, and in the simplest case of a microsphere of radius constructed from a dielectric medium, without the inclusion of absorption loss, takes the form
| (2.2) | ||||
| (2.3) |
The TE mode positions can be extracted from this equation using separation of variables in spherical polar coordinates
| (2.4) | ||||
| (2.5) |
where the angular vector functions are defined in terms of the associated Legendre polynomials . These functions [146, 165] occur in all models derived from the wave equation of Eq. (2.1), and a consistent notation must be established. A summary of the vector spherical harmonics (VSH), harmonising the notations in the literature, can be found in Appendix A. In the formalism of the Johnson model, the VSH contain contributions in the directions and . The function in Eq. (2.4) satisfies the second order differential equation
| (2.6) |
From the differential equation in Eq. (2.6), the resonance condition for the TE modes is obtained directly from an application of the continuity condition across the boundary, in the transverse component of the electric field
| (2.7) | ||||
| (2.8) |
evaluated at , with a similar continuity equation for the magnetic field applying for the TM modes.
The radial function takes a Riccati-Bessel form, which can be expressed in terms of the spherical Bessel functions of the first kind, , for the incoming waves, and the spherical Hankel function, , for the outgoing waves
| (2.9) |
The use of the outgoing spherical Hankel function, takes into account leaky WGMs, which radiate energy outwards, and are described by normalisable quasi-modes [166]. Here, the arguments are defined as a useful shorthand called the size parameters, and the coefficients can be solved for using the continuity condition above. The resonance condition for the TE modes of the sphere thus takes the following form, for a radial coordinate equal to the boundary radius of the sphere, [41]
| (2.10) |
For the TM modes, take note that the form of contains both angular and radial vector components (for as the unit vector in the radial direction)
| (2.11) | ||||
| (2.12) | ||||
| (2.13) |
where the function obeys the equation
| (2.14) |
The solutions to Eq. (2.14) for take a similar form to those of above
| (2.15) |
where the coefficients may be defined through enforcing continuity at the boundary in the same way as , thus leading to the resonance condition
| (2.16) |
Thus, the resonance conditions of Eqs. (2.10) and (2.16) may be used to specify the positions of the modes as a function of wavenumber , or wavelength, .
2.2.2 Chew model for the power emitted from active microspheres
A more general type of analytic model, such as that developed by Chance, Prock and Silbey using dyadic Green’s functions [159] and separately by Chew et al. [132, 143, 136], is able to simulate the full electric and magnetic field behaviour both inside and outside the resonator. These models deal particularly with the case of a dipole source placed on the surface of the resonator. Both of these models were shown to be equivalent to each other as formulations of spherical resonators excited by a dipole source [143], and were also shown to obtain the same resonance positions as Mie scattering [149]. The resonance conditions derived from the Johnson model can thus serve as an excellent benchmark comparison for spectra generated from the variety of models developed throughout this work, in order to check that each model correctly reproduces the established Mie coefficients for known resonance positions of a given radial and azimuthal mode order. This checking process will be carried out explicitly in Section 2.3.3.
A thorough discussion of the well known Chew model of [154], and its relation to other models, including the unified multilayer model developed in Chapter 4, is left until Appendix C. The Chew model is derived from the expansion of the vector electric and magnetic fields of a radiating dipole in terms of the VSH [132, 159, 160, 161, 143, 136, 162, 163, 164]
| (2.17) | ||||
| (2.18) |
where the convention used for the VSH, , defined in Appendix A, will be reformed when the unified model is presented, in Section 4.2. The quantities and are the electric and magnetic dipole coefficients, respectively, defined in terms of the vector dipole moment , the permittivity () and permeability () of the surrounding medium, and specified at the radial position of the dipole , with the gradient operator acting on this coordinate
| (2.19) | ||||
| (2.20) |
For , the spherical Bessel functions must be interchanged with .
In the Chew model, the scattered electric field in the outer region takes a similar form to that obtained from a radiating dipole
| (2.21) |
where the coefficients and are related to the Mie scattering coefficients of Ref. [149], and may be expressed in terms of the dipole coefficients and , making use of the continuity condition of Eq. (2.8) and its magnetic field variant [143].
The total emitted power can be obtained by integrating the Poynting vector with respect to the total solid angle
| (2.22) |
In the specific case of a dipole source oriented in the radial (normal) or tangential (transverse) direction placed on the surface of the sphere, the components of the emitted power take the following form when normalised to the power of a dipole in the surrounding medium of index [143]
| (2.23) | ||||
| (2.24) | ||||
| (2.25) | ||||
| (2.26) |
Note that the radial oscillations contain a single term, which encodes the contributions from the TM modes only, as a consequence of spherical symmetry, which will be discussed more thoroughly in Chapter 4. In the case of the tangential oscillations, contributions from both TE and TM modes appear, as shown in Eq. (2.24). This observation will become important for the interpretation of the results obtained from FDTD simulations, described in Section 2.3.2.
A range of models has been reported in the literature for the incorporation of multiple dielectric layers. These include a version of the Chew model for layers, in which the continuity equations for the quantities and for both TE and TM modes are expanded to a large matrix equation to calculate all unknown parameters [154]. The calculation of the resonance conditions for a microsphere with a single layer coating has also been solved explicitly by Teraoka and Arnold [147, 148], presented in detail in Appendix C.3. In addition, there are several publications that solve the continuity condition of an -layer microsphere system using a method known as the transfer matrix approach. These include the study of Bragg ‘onion’ resonators by Liang, Xu, Huang and Yariv [144, 145, 146] and their scattering cross sections in the far field region, and the WGM spectrum for dipoles placed on the surface, as in the Chew model, by Moroz [133]. Note that while the development of a model that incorporates the ability to obtain the WGM spectrum, as well as to simulate the inclusion of one or more dipole sources, or layers of dipole sources, will be left until Chapter 4, it will become necessary, as described in Section 2.1, to unify the disparate conventions and frameworks so that the behaviour of the WGMs in fluorescent, multilayer resonators can be simulated and compared to experiment.
2.2.3 Quality factor and loss
One particular performance characteristic of a resonator is the quality factor, or -factor, which expresses the ability of a resonator to store energy. A resonator with a high -factor is able to contain the electromagnetic fields that circulate around the surface for longer periods of time compared to resonators with a low -factor. For each round trip taken by the field, an amount of energy leaks from the resonator, and the time taken for a sufficient energy loss to transpire is known as the cavity ring-down time. This relationship between -factor and ring-down time is a consequence of the definition of the -factor in terms of the exponential decay constant, as derived from signal analysis [167], and will be described below.
The resultant light scattered from the resonator during the process of leaking radiation can be represented by the value of the emitted power over a range of wavelengths or frequencies, known as the spectrum. The usefulness of the spectrum in analysing the behaviour of WGMs is introduced in Section 2.3.2, and will comprise a significant portion of this thesis.
One particular contribution to the -factor, the geometric portion, , is the easiest to estimate theoretically, and is often considered to be a reliable indicator of the performance of a resonator [168]. The total -factor, as measured in experiment, includes a range of other contributions to the loss of energy, such as material absorption, surface scattering, topological deformations such as asphericity, and the radiation loss, derived from the coupling condition to the underlying geometric modes of the resonator [169, 115]. These contributions must also be considered, and are discussed later in this section.
Consider , which has its origin in the signal analysis of inductor-resistor-capacitor (LRC) circuits, where a resonant frequency of an oscillating wave, , can be expanded to first order [170]
| (2.27) | ||||
| (2.28) |
where is the wave amplitude and is the exponential time constant. Substituting Eq. (2.28) back into Eq. (2.27), the distribution of energy in the cavity is proportional to the Lorentzian function
| (2.29) |
Essentially, describes the imaginary part of the eigenfrequency , which is related to the time constant via [171]
| (2.30) |
This relationship between the -factor and the decay constant is an important point in the definition of the Purcell factor, a quantity associated with the Purcell effect introduced in Section 1.2.2.
If the wave is simply propagating along a waveguide, or within a prism of uniform refractive index , as will be used in Section 6.2.1, the propagation constant takes the form for a plane wave [170, 168]. For a wave travelling along a circular cross section of a resonator of radius , the propagation constant can be obtained from the mathematical form of the near (evanescent) field, or the bound portion of the field in the vicinity of the outer boundary of the resonator. Using separation of variables, this field takes the form
| (2.31) |
with component-wise contributions as follows [168]
| (2.32) | ||||
| (2.33) | ||||
| (2.34) |
The coefficients in these formulae are defined as
| (2.35) | ||||
| (2.36) |
Note that the radial component, , takes the form of a spherical Bessel function within the resonator. However, immediately outside the resonator the fields decay exponentially away from the boundary in the radial direction, with a decay constant of . The propagation constant , projected onto the equator of the sphere such that , takes the form
| (2.37) |
As a result, the phase-matching condition for microsphere resonators, introduced in Section 1.2.1, can be specified explicitly, by setting the propagation constants of a plane wave within a coupler to that of the equatorial modes
| (2.38) |
Thus, noting that , and recalling that the complex wavenumber is related to the eigenfrequency, , as stated below Eq. (2.1), takes the form
| (2.39) |
for the wave number .
The scaling behaviour of this -factor for large resonators of refractive index can be estimated using a model derived from an asymptotic analysis of the resonance conditions of Eqs. (2.10) and (2.16), as described in Refs [172, 173]
| (2.40) | ||||
| (2.41) | ||||
| (2.42) |
Here, , and the factor is equal to for the TM modes, and equal to for the TE modes. The exterior refractive index is assumed to be in this example. In this asymptotic form, one may choose the order, , to which to calculate the ordered zeroes of the Airy function, , which appears in the asymptotic expansion of the characteristic equation. The formula above is only valid for a large azimuthal mode number () approximation, and assumes that only the fundamental mode is observed, for which the quantum numbers introduced in Section 1.1 and Fig. 1.2 take the values , and . The value taken by in this case can be related simply to the number of round trips taken by the resonating waves, as shown in Fig. 1.1(a), which depends upon the radius of the microsphere, , and takes the form
| (2.43) |
This approach is not generally suitable for predicting the absolute magnitude of the measured -factor, especially for small resonators capable of small azimuthal mode numbers at their resonance condition. Of course, to gain a more realistic value of the total -factor, one must estimate the effect of other sources of loss.
While the geometric -factor expresses one portion of the loss, there are other sources of loss that need to be accounted for before one can attempt an accurate comparison with the -factors measured in experiment [169, 115]. These sources include material absorption, scattering from surface roughness, and radiation loss, that is, loss incurred from selecting a particular mode excitation strategy, with a given coupling efficiency. The losses can be modelled, as in the case of an LRC series circuit, where the total -factor is inversely proportional to the loss over a resistance , [174]. In the context of optical resonators, the total loss derived from the imaginary part of the eigenfrequency , from Eq. (2.28), can thus be added in parallel
| (2.44) |
Here, the quantity is the -factor derived from material loss such as absorption, is due to scattering from surface roughness, and is the cavity tunnelling loss, which can derived from one of several analytic models described in Section 2.2. The cavity tunnelling loss itself is composed of the geometric loss, , and the radiation loss, which depends intimately on the method of excitation [164]. Note that experimental measurement of the geometric portion of the -factor cannot be conducted directly, as the measurement can only take place in the presence of radiation through which the modes are excited. Therefore, analysis of the spectrum represents a more realistic assessment of the -factor, as the selection of a specific excitation strategy is implicit in the calculation of any spectrum. In the case of microspheres, it is also possible to separate the asphericity component from the cavity loss in the same way [118], by introducing an extra term into Eq. (2.44).
The cavity -factor, , can be obtained directly from the spectra, for a peak centred on a wavelength
| (2.45) |
WGM resonators can exhibit high performance in terms of their -factors, which in some cases exceed [175] experimentally. In most cases, however, the limiting factor on is the material absorption or the surface scattering. The limit of the -factor due to material losses can be determined by considering the absorption of light by both the resonator and the surrounding medium using an absorption decay constant
| (2.46) |
The magnitude of the absorption decay constant depends on how tightly the light is confined within the resonator, the wavelength range, and the surrounding refractive index. Scattering contributions can be calculated by modelling the surface roughness as a changing dielectric constant, and this has been used to determine upper limits on the -factors of small silica spheres. One such expression for the limit of the -factor due to surface scattering can be derived by considering the scattered power in the case of an inhomogeneity in the dielectric constant, , for a Dirac delta function [176]
| (2.47) |
where is the correlation length and is the variance of the surface roughness [85]. Each of these quantities can be determined by measuring the extent to which a fluctuating beam exhibits coherence upon being transmitted through the surface [177]. Using high-quality polishing techniques, surface roughnesses of nm can be achieved for some resonators. According to one study [85], assuming that and are roughly equal in magnitude at nm, the scattering limitation of the -factor can be estimated as for a diamond resonator with a radius of mm, at a wavelength of m. For a polystyrene microsphere of radius m in water, at a wavelength of nm, a limiting factor is reported closer to – significantly less than the geometric -factor expected from Mie scattering theory, [178]. It is important to note that it is only when the roughness approaches the order of nanometres (nm), that becomes a limiting factor for the overall -factor, as estimated for the specific case of polystyrene microspheres with radii of approximately m [178, 179, 180]. While the biological cells considered as viable resonator candidates in Chapter 5 are typically much larger in diameter than m, it will be discovered that they can exhibit significant surface roughness, and thus one must keep in mind these circumstances in which scattering loss can dominate.
In the case of microspheres, it is sometimes convenient to define a separate -factor corresponding to the asphericity, which can also limit the value of the total -factor. This is useful when considering active microspheres [118], particularly the variety that are coated with a fluorescent dye, which tend to emit without a direction preference. Such active resonators are thus susceptible to degradation of the -factor, even for relatively small deviations in their sphericity – down to the nanometre level [115]. This is a consequence of the presence of multiple microsphere diameters experienced by rays propagating inside the resonator. For example, an elliptical resonator is capable of sustaining modes along both its minor and major axes, as well as skew rays, which propagate along a spiral path, and thus experience a different effective diameter for each round trip. The relatively uniform emission of radiation from active resonators thus includes contributions from multiple paths, leading to mode-splitting and reduced -factors [115, 118, 95].
It is well known that the geometric portion of the -factor can overestimate the measured -factor by many orders of magnitude, as seen by comparing analytic models in the absence of radiation [168, 181] with methods that include the missing radiation losses [182, 183, 184, 157, 115]. The contribution to the total -factor from Eq. (2.45) expresses both the intrinsic geometric loss and the loss of radiation through the excitation strategy that was used to generate the spectrum, effectively renormalising the width of the resonance. Equation (2.45) describes a general way of extracting the -factor of a cavity from a spectrum, irrespective of the specific excitation method. However, in the case of active resonators, which include an embedded emitter or fluorescent layer, additional spectral features may be observed, such as the Purcell effect. The magnitude of this effect is typically ascertained by calculation of a quantity known as the Purcell factor [97, 185], which is defined in terms of the decay rate of the emitter, .
It has long been known that the local environment is able to alter the behaviour of an emitter [185, 186, 187, 188]. In the case of a resonant cavity, the presence of a refractive index contrast between the resonator boundary and its surrounding medium can modify the local density of states available for the emitted energy to be stored, affecting both the emission rate and the emitted power [185, 189, 190, 191]. Since the loss of radiation through emission into free space is related to the solid angle into which it radiates (which is handled explicitly when calculating the emitted power in Appendix B), it is useful to define the effective mode volume, , which can be used to describe the distribution of power of the modes within a cavity. For an electric field , permittivity and a radial coordinate , one may define [97, 192]
| (2.48) |
where the integral is taken over all space.
If an emitter with a dipole moment and transition frequency has an excitation rate near its emission frequency, then a single-frequency approximation of the emission rate can be calculated in terms of the radiative () and non-radiative () decay rates, respectively [188]
| (2.49) |
Since the excitation rate depends on local electric field such that , and the total spontaneous decay rate can be calculated via Fermi’s golden rule
| (2.50) |
where is Planck’s constant and is the density of states available to the emitter, then the emission behaviour of the system can be entirely determined by the dyadic Green’s function of , as follows. Solutions to the Helmholtz equation of Eq. (2.1) can be described by integrating a Green’s function , together with the electric current , throughout a volume that entirely encompasses the resonator [193]
| (2.51) |
The local density of states, , can then be expressed in terms of this function [190, 194]
| (2.52) |
for a unit vector . To take a simple example, in the case of an emitter in free space, the density and decay rates simplify to , and . In the case of a dipole emitter with a high quantum yield, , corresponding to an emitted electric field , the non-radiative rate takes the form [159]
| (2.53) | ||||
| (2.54) |
in terms of the emitted power of a dipole in free space, . The normalised excitation rate from an incident radiation field that interacts with the emitter takes the form
| (2.55) |
The Purcell factor for a resonance near a wavelength of is then defined as the ratio [97, 185]
| (2.56) |
By substituting the non-radiative and excitation decay rates into the formula of Eq. (2.49), it can be seen that there is a relationship between the normalised emitted power, , and the emission ratio [190]. In some cases this can result in an emission of more power within an environment than would have been the case in free space, . This particular effect will be explored further in Section 2.3.2.
2.2.4 Free spectral range
WGM spectra exhibit relatively sharp peaks corresponding to the WGM resonance positions, and can be well spaced, particularly for small resonators. One can calculate the peak-to-peak wavelength range, or free spectral range (FSR), and the relative linewidth, , in the following manner. The FSR of a microsphere resonator of radius and effective refractive index contrast of , for two consecutive polar mode numbers and , can be approximated from [195]
| (2.57) | ||||
| (2.58) |
such that the difference in the modes takes the following formula,
| (2.59) |
Here, , and the group refractive index takes the form .
Alternatively, the FSR can be estimated from the wavelength dependence of the propagation constant [196]
| (2.60) |
such that the formula of Eq. (2.59) can be reproduced from
| (2.61) |
In Eq. (2.59), it can be seen that, as a general rule, the FSR decreases as the radius increases. This will be an important consideration in the analysis of the behaviour of the FSR in the remainder of this chapter, as well as in Chapters 3 through 5.
2.3 A customisable FDTD-based toolkit
The FDTD technique simulates the evolution of electromagnetic fields by discretising a volume into a three-dimensional spatial lattice [197]. Maxwell’s equations are then solved for every point on the lattice, for a finite number of time increments. FDTD represents a critical tool in the simulation of novel resonator architectures, specifically for its ability to incorporate material inhomogeneities and a wide variety of resonator shapes, such as shells, ellipsoids or deformations to a microsphere.
The use of two-dimensional FDTD simulations to describe the resonance peak positions has been used previously in the case of microdisks [50]. However, the accurate prediction of the -factor of the resonances represents a principal challenge due to the significant dependence of the -factor on minute characteristics of the resonator, such as the surface roughness, material inhomogeneities and microscopic deformations in the shape of the resonator [198] described in the previous section. As a result, theoretical -factors evaluated through analytic models can be difficult to match experimentally [198, 199].
The key flexibility of the FDTD method, however, is the ability to address this issue by incorporating geometric, material and refractive index features in a way that is both intuitive and easy to implement. In addition, specific modes or wavelength regions can be reliably identified, and tailored for specific tasks by altering the initial configuration of the resonator. Furthermore, the ability to scan over a wide range of parameters may lead to valuable design solutions for biosensing that would not otherwise have been found.
The FDTD method can lead to the possibility of accessing transient or emergent optical effects due to the fact that an emitter source that covers a wide range of wavelength values is used (in this case a Gaussian source), and each time step is evaluated separately, allowing scope for tracking the intermediate configurations of the fields both inside and outside the resonator. However, FDTD is computationally expensive. For example, time steps totalling a few hundred wave periods frequently require up to hours of simulation time, for approximately CPUs on modern supercomputers. Table 2.1 summarises typical computing resources for a range of spatial and temporal resolutions. Nevertheless, for each simulation run, a large amount of data can be extracted by accessing the electric, magnetic and Poynting vector fields at each grid point. One particular feature of this approach is that one is able to map out the angular distribution of the energy density for a typical flux plane, which will be discussed further in Section 2.3.4.
FDTD is also able to consider any desired position or alignment of dipole sources, including inhomogeneous distributions of dipoles placed on the surface or throughout the medium. The freedom to define a specific flux collection region at any point in space, or for any length of time, is an important feature for ongoing investigations into a range of coupling scenarios. Measuring the flux from a particular direction and aperture automatically biases the shape of the collected power spectrum. FDTD is therefore especially suitable for simulating the effect of collecting radiation through a restricted region.
| (nm) | (nm) | CPUs | RAM (GB) | VM (GB) | Wall-time (hrs : mins) |
|---|---|---|---|---|---|
The principal drawbacks in the FDTD method are the computational load, and systematic effects due to the discretisation of space. The accuracy of each FDTD calculation is limited by the size of the Yee cell, which determines the grid resolution of the simulated volume. An example Yee cell is illustrated in Fig. 2.1, showing the orientation of the electric and magnetic field components, as well as the contributions from both the TE and TM components. The Yee cell contains an electric field ‘sub-cell’ and a magnetic field sub-cell, offset from one another spatially by one half cell length in all three directions, so that the cells intersect one another as shown. The components of the electric and magnetic fields are simulated on the edges of each sub-cell. In the following simulations, the cell width is to nm. A decrease in the cell size increases the computing time requirement to the fourth power (three spatial dimensions, and time) [200]. As a result, the available hardware resources typically limit the improvement in accuracy of the FDTD simulations. This has an additional impact on the behaviour of a microresonator, as the surface of the resonator gains an ‘effective roughness’, due to the finite cell size. This effect can be incorporated into the systematic uncertainty of the calculation. An unanticipated benefit of this effective roughness is a more realistic prediction of the -factor of the resonator. Note also that the simulated roughness is comparable in size to that of the typical surface roughness of a physical polystyrene microsphere, which is approximately nm or greater [179].

The three-dimensional FDTD method is simulated using the free software package, MEEP [200]. This work is presented in the publication, Ref. [157], which is listed as Item 1 in Section E.1. For reference, code and scripts associated with these calculations have been placed online for public availability -- 11 1 https://sourceforge.net/projects/npps/files/FDTD_WGM_Simulator see Appendix E.4. Since the simulation includes the complete set of radiation and bound modes occurring in the system, the only simulation artefacts in an FDTD calculation involve discretisation and finite-volume effects, and any assumptions of ideal material properties one might make. By altering the grid size, the convergence of the simulation can be estimated, and this can be quantified in the form of a systematic uncertainty in the positions of the WGMs. The capability of including and handling this effect is discussed in more detail in Section 2.3.2.
2.3.1 Establishing the resonator geometry
The FDTD method is used to consider a variety of flux collection scenarios, source distribution, and resonator properties. A specific example scenario of a polystyrene microsphere in a surrounding medium of air or water is considered, and the -factors obtained from the simulation will then be compared to those of the Chew model [136].
The geometry of the resonator is defined for a dielectric medium, and placed in the discretised space, with the edges of the total three-dimensional FDTD volume simulated as though padded with a field-absorbing perfectly-matched layer. To generate an electromagnetic current to excite the WGMs, one or several electric dipole sources are placed in the vicinity of the sphere. These sources can be used to simulate active resonators, such as those that incorporate fluorescent nanocrystals [84, 85, 86] or quantum dots [87, 39, 88]. The exploration of the electromagnetic effects of sources is of contemporary interest due to the recent advancement of the detection of single particles by WGM resonators [117, 111, 112, 17, 14]. In addition, a distribution of a large number of dipole sources may be used to simulate a fluorescent layer, analogous to active resonators that use organic dyes, or to natural autofluorescence [89, 90, 91, 75, 92, 93]. However, since the focus of this chapter is to explore and verify the FDTD approach by examining the behaviour of the TE and TM modes with respect to the dipole orientation, and the spatial distribution of the energy, this latter option will be dealt with chiefly in Chapters 3 and 4.
In the first example, a microsphere with a diameter of microns, as illustrated in Fig. 2.2, is placed in the centre of the FDTD volume described at the beginning of Section 2.3. An electric dipole is then placed on the surface of the sphere and oriented tangentially to the surface, while a circular flux collection region is defined a distance , normal to the sphere, with diameter . This region aggregates the flux in the frequency domain. One may vary the orientation and position of both source and collection region to build up a map of the coupling efficiencies to different WGMs.
2.3.2 Introducing the spectrum

The power output spectrum represents an important quantity for assessing the -factors and the wavelength positions of the excited WGMs. The total output power () in terms of wavelength () is obtained by integrating the projection of the Poynting vector () onto a flux region of area :
| (2.62) |
for a unit vector normal to the collection region. Aggregating the power flux at each time slice, as opposed to time-averaging, ensures that the full electromagnetic behaviour is incorporated into the spectrum, including all transient states.
The profile of the power spectrum, plotted as a function of wavelength , will show sharp peaks that correspond to the positions of TE and TM WGMs. The relative heights of the peaks indicate the coupling efficiencies to different modes, which are highly dependent on the geometry of the dielectric medium, the refractive index contrast, and also the method of mode excitation, such as dipole sources of different alignments, or other coupling scenarios. The power spectrum is then normalised to the power output of the sources in the absence of the dielectric sphere. This power, , is calculated in the same manner as in Eq. 2.62, with the dipole sources within the FDTD volume emitted.
An FDTD simulation of a polystyrene microsphere, , with a diameter of m, is carried out for a tangentially-oriented electric dipole source emitting a Gaussian pulse with a central wavelength of nm, and a width of femtosecond (fs), or a spectral full-width at half-maximum of nm. Note that the pulse width is narrower than the decay transition rate expected from a typical fluorescent source, such as Rhodamine dye, which is roughly to nanosecond (ns) [201, 202]. The pulse is taken to be effectively instantaneous with respect to the phenomena being measured. The source is introduced in the form of a vector current that is separable in the space and time components, and , respectively
| (2.63) |
is a complex number that represents the total amplitude of the source, which in this chapter will be set to . A circular flux collection region with a diameter of m is placed a distance of nm from the surface of the sphere in the -direction, with its normal aligned along the same axis. Spectral information is then collected for the wavelength range encompassed by the Gaussian pulse. The finite grid resolution entails an asymmetry in the Gaussian peak, which diminishes as the resolution increases.
A comparison of a variety of grid resolutions is shown in Fig. 2.3(a), using a total flux collection time of picosecond (ps) – times the width of the pulse. The flux collection begins after the Gaussian pulse has decayed, that is, after fs. For resolutions in each spatial direction of to nm, one finds that as decreases, that is, at higher resolution, the profile features of the spectrum do not alter significantly; there is only a small offset in the positions of the peaks, and the peak heights. The positions of the WGMs are determined from collection of the frequencies, which are then converted to wavelengths. The temporal resolution is then interpolated to yield a value nm.
The systematic uncertainty in the resonance positions due to resolution can be quantified by tracking the positions of the WGM peaks. By examining the wavelength positions of the most prominent peaks, one can obtain a converged result to a chosen tolerance, as shown in Fig. 2.3(b). An error estimate in the peak positions can be obtained by comparing the results for different grid resolutions. For example, using the lowest simulated resolution of nm, the most-central peak has a wavelength position of nm. For the highest simulated resolution of nm, the position is nm. This yields an offset in the position of the central peak of nm. For comparison, note that a spectral resolution of approximately nm has been shown to be necessary for the detection of nearby macromolecules by a microsphere [203]. This offset, however, is uniform over a wide wavelength range, and provides a reference spectrum from which any shifts in the surrounding refractive index can be detected. In this investigation, it is nevertheless important to emphasise that the FDTD-based method is developed principally as a screening tool for assessing the feasibility of new designs of biosensors at the proof-of-concept stage.
By changing the length of time allowed for flux collection, one can also obtain important insights into the distribution of modes in the power spectrum. Fig. 2.4(a) shows the resultant normalised power spectrum for a variety of flux collection times. A spatial resolution of nm is chosen, and also a density of sampled wavelengths corresponding to nm. As the collection time increases, the WGM

(a)

(b)

(a)

(b)
peaks become more prominent. Furthermore, double-peak structures seen at small collection times are no longer apparent for larger collection times, as the sampling of the full mode structure of the radiating cavity does not have sufficient time to be measured by the flux region. For the longer collection times, an enhancement in the normalised dipole power is observed (), at wavelengths coinciding with the dominant WGMs. This indicates that the power output of the source is enhanced at these wavelengths by the presence of the dielectric microsphere. This effect is due to the difference in time scales between the cavity ring-down time and the time evolution in the spectrum. The resonances with high -factors originate from field configurations traversing paths around a highly symmetrical resonator as established in Section 1.1, however, these resonances also have longer ring-down times, as discussed in Section 2.2. As a result, a certain amount of flux collection time is required to resolve the total underlying mode structure. This collection time can be calculated by analysing the structure of the spectrum as a function of collection time as follows.
The behaviour of the -factor as a function of the flux collection time is shown in Fig. 2.4(b) for three central WGM peaks. For the peak at m, convergence is achieved beyond a collection time of ps, with a variation of . For the other two peaks, m and m, variations of and are measured, respectively. Note that, while peaks with lower -factors incur less variation with respect to collection time, peaks with higher -factors are more affected. However, an increase in collection time becomes increasingly computationally intensive, due to the asymptotic behaviour in the -factor with respect to collection time [204]. Nevertheless, the uncertainty in the -factor due to the collection time can be quantified, and thus incorporated into the systematic uncertainty.
Comparisons of the analytic model and the FDTD spectra for a microsphere are shown in Figs. 2.5 and 2.6 for tangentially and radially oriented dipole sources, in both air and water media, respectively. The WGM positions from the analytic model are shown as vertical bands, with TEm,n modes in green and TMm,n modes in red, for polar and radial mode numbers and , respectively. The width of each band indicates the estimate of the systematic uncertainty due to the finite grid spacing of

(a)

(b)

(a)

(b)
FDTD. Specifically, the Johnson analytic model, based on Mie scattering,
is used to estimate the shift in the WGM positions due to uncertainty in the
sphere diameter, m .
In this case, the spatial
resolution is held fixed at the value nm.
For the temporal resolution, which is related to the wavelength range
(in this case to nm),
the spectral density of points yields an uncertainty of
nm nm. The two uncertainties are
added in quadrature.
Taking into account the finite grid resolution, the offset of each peak
from the position expected from
the analytic model may also be due to the fact that nearby modes, which
can partially overlap with each other,
are capable of shifting the peaks away from the central positions
calculated from such an analytic model [40].
Note that the TE and TM modes cannot be completely decoupled due to the spherical symmetry in the case of a tangentially oriented dipole (), as expected from a comparison of the forms of Eqs. (2.23) and (2.24) occurring in the Chew model, for example. Thus contributions from both TE and TM modes, including higher order modes, are expected in the spectrum. Consider the case of Fig. 2.5(a), for a tangentially oriented dipole in a surrounding medium of air. One might expect that the dominant WGMs excited are the lowest-order radial TE modes, since the electric field of each of the TM modes contains a radial component, which does not couple strongly to the tangential source. It is found, in fact, that the dominant peaks have an FSR consistent with a radial mode number of . The fundamental radial modes () cannot be resolved for this index contrast at this finite grid size, since they are known to exhibit -factors of order or larger, both experimentally [205], and in analytic models [168, 181, 198, 199]. In FDTD, the discretisation of space leads to an effective surface roughness, which broadens the peaks, leading naturally to lower estimates of the cavity -factor, , as shown in Table 2.2. In the case of the radial electric dipole, Fig. 2.5(b), the dominant peaks exhibit FSRs that match the TM modes for both and , with no contribution from the TE modes.
For a lower index contrast scenario, such as polystyrene microspheres in a surrounding medium of water, shown in Figs. 2.6(a) and 2.6(b), the WGM peaks are broadened, and there is a reduced density of modes at wavelengths in the range to nm. As a result, the peaks observed in the FDTD simulation correspond to the fundamental radial TE or TM modes, for a tangential or radial dipole source, respectively.
| Scenario | (m), | (m), | (m), | (m), |
|---|---|---|---|---|
| air, | , | , | , | , |
| air, | , | , | , | , |
| water, | , | , | , | , |
| water, | , | , | , | , |
Note that in Fig. 2.6(a), for a tangentially oriented source, the main contribution is from the TE modes, while there is a relatively small component originating from the TM modes – the ‘shoulders’ that appear to the left of the dominant TE peaks, which are more apparent at lower wavelengths where the peak positions are sufficiently separated.
The separation of the spectrum into components that correspond directly to the TE and TM polarisations, derived from spherical symmetry, will be investigated more comprehensively in Chapter 4. However, for the purposes of this study of the FDTD method, it is sufficient to note that the total radiative contribution to the spectrum is included, and that FDTD allows for the introduction of a number of different resonator design, excitation and radiation collection scenarios to be simulated. In fact, in this investigation, the FDTD tool has already provided guidance for future designs of resonators, which can be adapted for biosensing applications. Figures 2.5 and 2.6 confirm that the dominance of TE or TM modes is dependent on the alignment of the dipole source on the surface of the sphere, as described in Ref. [41]. Microsphere sensors are thus able to detect the orientation of an external biomolecule by recording the relative coupling strengths of TE to TM modes.
2.3.3 Connection to Mie scattering
Comparisons of the Chew model, the Johnson model and the FDTD simulations are shown in Fig. 2.7, for a surrounding medium of water. In Fig. 2.7(a), a tangential dipole source is used, and the fundamental radial TE modes from the Johnson model, corresponding to Mie scattering (green vertical lines), exactly match the peaks of the Chew model (dashed blue line), as expected, by construction [136]. The peaks of the FDTD simulation also correspond to these TE modes, and the FSR matches that of the Chew model. Fig. 2.7(b) shows the result for a radial dipole. The peaks of both the Chew model and the FDTD simulation correspond to the fundamental radial TM modes. Note that in both Figs. 2.7(a) and (b) there is an offset in both the peak positions and the total power due to the finite grid resolution, as explained in Section 2.3.2.
Although this analytic model is better suited to simulating scenarios that involve dipole sources at a variety of positions and alignments, the FDTD method is able to collect flux from any desired collection region, in the near or far field, for any length of time. This is an important point, as this collection scenario will affect the measured power spectrum profile. It is useful to be able to estimate the size of the effect due to collection region, and this will be investigated in the specific case of the angular distribution of the flux, in the next section.
2.3.4 Angular distribution of the modes
The simulation can also provide information about the angular distribution of the flux, both directly and indirectly. First, the configurations of the electric and magnetic fields in the simulation are stored for each point in space, at every time slice, providing direct access to the behaviour of the fields. Second, a less direct but physically insightful method for assessing the angular distribution of the fields is to

(a)

(b)
examine several modes in the spectrum, in this case four modes which lie within the simulated wavelength window, TE37,1, TE38,1, TE39,1 and TE40,1, for a variety of flux collection scenarios. This is of interest, particularly when comparing a variety of different methods of collecting the emitted power, which have been shown to influence the structure of the spectrum [118]. Since the FDTD simulation records the electromagnetic field values, the flux density, , may be projected onto the circular region of the - plane (with normal vector ) for any wavelength value. An analysis of this type is helpful for visualizing the distribution, distinguishing the polar and radial modes at different time slices, and identifying transient resonant features. By integrating the flux over a collection time of ps, the distribution over the collection plane indicates the angular dependence of the mode at a particular wavelength.
As an example, Fig. 2.8 shows the flux distribution over the collection region, for a tangential dipole source, and a surrounding medium of air. The four panels display the four most prominent WGM peaks occurring in that wavelength region, corresponding to values of , , and m, respectively. It is apparent that the modes at wavelengths of m (TE38,1) and m (TE37,1) exhibit a flux distribution with peaks spread out in the flux measuring region over a comparatively wide angle. The total power output for these modes is likely to vary significantly if the diameter of the region is reduced. In contrast, the mode occurring at m (TE39,1) has a more focused concentration of flux in the centre of the measuring region, corresponding to a narrower angular distribution of flux. The power output for this mode is consistent over a wider range of flux region diameters. In summary, it is clear that as the measuring region changes, the simulations indicate that the radiation coupling to each mode is changed by different amounts, altering the structure of the spectrum.
Note that each circular plot of the flux density in Fig. 2.8 contains alternating bright bands aligned horizontally along the -axis, rather than a concentric circular pattern. This is a consequence of the use of a single dipole placed on the surface of the resonator, which breaks the symmetry of the distributions of the fields.


(a) (b)


(c) (d)
As a consequence of the nontrivial angular distributions of the modes, changes in the power spectrum are also detected. Figure 2.9 shows the spectrum for the m sphere for flux planes at different distances from the sphere, as shown in Fig. 2.9(a), and different diameters, shown in Fig. 2.9(b). In each case, a tangential electric dipole is used, and the collection time is held fixed at ps. By comparing the spectra from several flux collection plane sizes and positions, changes in the peak heights are observed, indicating the different angular behaviour of the modes. Changes in the distance of the flux region, , result in a similar mode structure, but the overall power output, especially for the dominant WGM peaks, changes as the flux is sampled differently in each region. Alterations in the diameter of the flux region result in more noticeable changes to the mode heights, demonstrating the highly angular-dependent nature of the relative contribution of each mode to the total flux.
2.4 Introducing layered spheres and microbubbles
It can be seen from this chapter that crucial insights into resonator behaviour can be gleaned from a careful examination of microspheres, the models that describe their resonances, and the behaviour of WGMs under a variety of conditions. Specifically, alterations in the size, refractive index, surrounding environment, excitation and collection methods all impact on the resonance positions or their -factors.
Although microspheres serve as an important test case for understanding the behaviour of modes in resonators, they have some crucial limitations. Though many biological cells in nature have a symmetrical, near-spherical or circular cross section shape, as will be seen in Chapter 5, they also contain complex internal and external features, inhomogeneities and structures that need to be accounted for.
As a way forward for the specific application of this thesis, the next development will be to take the general principles of resonator design explored in this chapter and apply this knowledge to a novel resonator design – microbubbles. These resonators differ from microspheres, in that they contain a layer of material, constraining the modes to lie within the narrow wall of the bubble.

(a)

(b)
Microbubbles serve as an improved analogue for biological cells, which typically contain a layer or membrane. In the context of the vision of the project, enriching and then testing the modelling capabilities in an experimental setting brings us one step closer to addressing the question of whether a biological cell can ever be a viable candidate for a resonator.
Understanding how the introduction of these architectural features affects the behaviour of the modes will occupy a significant portion of the next chapter. Apart from their applications in a variety of technological and sensing contexts, the use of layered resonators or microbubbles allows one to investigate the effect of an internal cavity of different refractive index to that of the resonator wall or shell. How this affects the mode positions, free spectral range and -factors using a variety of excitation strategies will be of interest in assessing the feasibility of a biological cell resonator, and will lead to a new technique for the determination of the geometric parameters of these resonators purely from an analysis of their spectra.
3Fluorescent Microbubbles as Cell Analogues
As a way forward in investigating the possibility of a biological cell resonator, the principles examined for microsphere sensing technology are extended to include resonators with a single dielectric layer of finite thickness. One particular example of this layered resonator is the microbubble, which consists of a shell of dielectric material and a hollow interior. One of the main goals in these next two chapters is to build a picture of the behaviour of multilayer resonators, which are analogous to certain types of cells [154], and a single-layer scenario serves as an important test case for illustrating the complexities and features that arise from multiple boundaries within a symmetrical object.
There is extensive literature on the topic of microbubbles, which are a specific example of a single-layer resonator (with a hollow interior). It is therefore worth deliberating on this particular type of resonator, not only to cross-check the soundness of the modelling capabilities that will be introduced in the next two chapters, but also as a way of introducing new features, such as layers of dipole sources, which can mimic fluorescent coatings used in experiments [84, 86, 87, 39, 88, 94, 75].
3.1 Microbubbles as an emerging sensing platform
Like their microsphere counterparts, microbubble resonators are also able to support WGMs [206, 207], however, the advantages of microbubbles over solid microsphere resonators are numerous. Microbubbles exhibit improved refractive index sensitivity [184]. That is, the shift in the mode positions due to the presence of a nearby particle, which breaks the symmetry of the electric and magnetic fields, is enhanced in resonators that have thin walls, such as microbubbles. A hollow interior (of lower refractive index) impedes the fields entering the cavity, and the field distribution is therefore more strongly biased towards the outer region of the resonator, leading to a more extensive evanescent field. One consequence of this is that microbubbles also typically have smaller mode volumes than microspheres [208]. This indicates that the modes are more tightly constrained to the outer region of the resonator, serving to reduce the lasing threshold [129], as well as providing greater scope for applications of nonlinear optics [30] and QED [34]. The ability of microbubbles to stretch and deform mechanically has also been used to tune their FSRs across a broad range [209], allowing all characteristic modes within a spectral interval to be accessed.
To make use of these advantages, microbubbles are in development for a variety of applications, which include refractive index sensing [184], lasing [210] and frequency comb generation [28, 29]. In fact, the hollow cavity inherent in a microbubble can be used to develop new, compact apparatus, such as integrated microfluidics, which has demonstrated applicability in chemical and temperature sensing [211, 212]. Realising these benefits usually requires one to be able to manufacture microbubbles that have comparatively thin shell walls. However, in decreasing the shell-wall thickness, one encounters a trade-off between the refractive index sensitivity and the maximum values of the -factor [184]. Achieving an optimal trade-off in the sensitivity and the -factors has therefore been the subject of intensive study through a variety of methods in recent times [156, 213], and still remains an open area of investigation.
In this chapter, the FDTD approach described in Chapter 2 is extended to involve a single-layer architecture, including a layer of dipole sources whose density can be freely varied. This work is presented in the publication, Ref. [109], listed as Item 2 in Section E.1. Accurate determination of the FSR plays an important role in identifying the mode numbers from scattering theory [156] and the assessment of dispersion [214, 215], and these attributes cannot be obtained from the wavelength shift in the modes alone, which depends on a number of factors, as described in Section 1.1. Therefore, the behaviour of the FSR and the -factors is examined as the diameter () and shell thickness () of a microbubble are changed, and the effect of the power collection region is also considered. Finally, the new insights into the behaviour of the microbubble WGM spectrum are incorporated into a new, non-destructive method for determining the geometric parameters of a given microbubble. The method is then tested for a real-life scenario of a silica microbubble.
3.2 Simulating fluorescent microbubble resonators
Early models for simulating WGMs in microbubble resonators tend to focus on the wavelength positions of the resonances excited by a single embedded dipole [132]. By adopting a simple generalisation of Mie theory, it was found that the spectra could be simulated by making use of the transfer-matrix approach [146]. Other approaches exist, such as the multilayer version of the well known Chew model [154], or the extraction of the mode positions from the characteristic equation of a microsphere with a single-layer coating [147, 148]. However, it is important to note that a unified description of resonators with arbitrary numbers of layers for a variety of excitation scenarios, including active layers, has not been developed until now, and its description and explanation will occupy the majority of Chapter 4.
Using the FDTD approach, the simulation of microsphere resonators can be extended to include an outer shell of dielectric material with greater flexibility in the ellipticity and homogeneity of the layer, allowing for greater scope for the inclusion of deformations than for competing models. However, because the simulations can suffer from artefacts derived from the finite grid size, which typically take the form of a systematic shift in the wavelength positions and -factors of the simulated modes (as discussed in Section 2.3), in this chapter, the grid resolution, , is varied depending on the physical scale of the simulation, as set by the resonator diameter. The diameter, from this point on, refers to the outermost diameter of the microbubble, so that the outer boundary remains constant as the shell thickness is changed. For each diameter simulated, a resolution is chosen such that the positions of the modes reach convergence within a tolerance of .11 1 For the smallest and largest diameters considered ( m and m), the grid size varies from nm to nm, respectively. This range of diameters is chosen to overlap with the estimated diameter range of the silica microbubbles used in the experiment described in Section 3.4.
As mentioned in Section 2.3, the simulation of large resonator diameters becomes computationally challenging, particularly in terms of RAM usage,22 2 For the most demanding scenario considered in this study in terms of RAM usage, the largest diameter simulated, m, with a grid size of nm, typically requires 235 GB for an unnormalised spectrum collection for a microbubble resonator. The normalisation run (no microbubble present) requires 219 GB. For m ( nm) RAM usages are 156 GB (microbubble) and 145 GB (normalisation), and for m ( nm), the requirements are 84 GB (microbubble) and 79 GB (normalisation), respectively. These values are based on resources from the Raijin machine at the National Computational Infrastructure (NCI) Facility, The Australian National University, Canberra, Australian Capital Territory 0200, Australia (http://nci.org.au/systems-services/national-facility/peak-system/raijin ). due to the difference in magnitude between the wavelength and the diameter of the resonator. Although FDTD is in principle extendable to larger diameters, as commonly used in the literature [216, 206, 217], the limitations of computing power, which scale proportionally with to the fourth power [157], need to be taken into consideration.
3.2.1 Uniform dipole coatings as an analogue for fluorescence
Let us consider how a fluorescent coating may be modelled in the context of FDTD. First, a microbubble resonator is simulated by placing two spheres concentrically, with refractive indices as shown in Fig. 3.1(a). A distribution of electric dipole sources is then simulated on the surface of the microbubble resonator. The density of dipoles on the surface is kept constant for each simulated microbubble, as illustrated in Fig. 3.1(b), although varying the density is straightforward, and a variety of different densities will be considered in Section 3.2.3.


(a) (b)
The algorithm for the placement of the dipoles is as follows. In spherical coordinates, the polar angle () is split into increments, with , for . The azimuthal angle () is chosen to take the values , for , where the square brackets indicate rounding to the closest integer. That is, to keep the density of the sources uniform over the surface of the resonator, the number of sources must increase as the value of moves away from the pole at . The total number of sources placed on the surface, , is then simply a function of
| (3.1) |
It can be seen that the surface density () is uniform by showing that the number of sources per infinitesimal solid angle () is constant as becomes large
| (3.2) | ||||
| (3.3) |
Each source is placed on the surface of the resonator, with diameter , at the locations . The amplitude of each source is represented by a single complex number premultiplying the source current of Eq. (2.63). The total amplitude is normalised to the total number of sources placed on the surface of the resonator, and is kept constant throughout the simulation.
In order to model a fluorescent coating, which has no preferred orientation, the alignment of each source must be randomly chosen. For an amplitude of , the , and components of each source take the form
| (3.4) | ||||
| (3.5) | ||||
| (3.6) |
where and take values from a uniform, random distribution of polar and azimuthal angles in the alignment space, over the ranges and , respectively.
This method of assigning the locations of dipole sources provides a useful way of automating the simulation of an even coating of a fluorescent material on a resonator, or the autofluorescence of a cell membrane, and exploring the effect of different densities of the sources on the emitted spectrum of a resonator. One advantage of the FDTD method over the analytic models described in Chapter 2 is the fact that interactions between the sources are automatically handled. This allows one to probe more general properties of the electromagnetic spectra derived from resonators with unconventional or anisotropic source distributions that are otherwise difficult to model.
3.2.2 Customising the fluorescent emitter density in FDTD
As an initial example, consider the polystyrene microsphere described in Section 2.3.2 such that the implementation of the new mode excitation method of Section 3.2.1 can be directly compared with the results in Chapter 2. The microsphere has a diameter of m, is surrounded by water, and the radiation is collected from a box surrounding the entire resonator. The dipole-coating algorithm is now applied to this microsphere for a variety of different densities of sources placed on the surface of the sphere. In this scenario, each dipole emits a Gaussian pulse with a central wavelength of nm, and an emission width of nm, which is chosen to match the emission range of (4-(2-Carboxyphenyl)-7- diethylamino-2-(7-diethylamino-2-oxochroman-3-yl)-chromylium perchlorate) [218] as closely as possible, which is the organic dye used in the experiment described in Section 3.3.
The power is then aggregated in the wavelength domain, in the same manner as Chapter 2. Recalling that the total radiation collection time necessary to achieve a converged WGM spectrum depends on the resolution, it was found in Section 2.3.2 that a collection time of approximately ps was sufficient to achieve a converged -factor for a m diameter microsphere, using a shorter wavelength of nm. In order to achieve the same level of convergence as the diameter and wavelength are varied from these values, the collection time must be scaled in proportion to , where is the central wavelength of the dipole sources. For a resonator with a diameter of m excited at a wavelength of nm, the collection time is wavelengths (equivalent to ps). For a diameter of m, a collection time of wavelengths ( ps) is required. Since the larger diameter resonators exhibit larger -factors and thus longer ring-down times, a longer collection time is required in order to reach a converged spectrum.
The behaviour of the WGM spectrum as a function of the number of sources, and hence the source density, is important for developing a reliable model of a uniform fluorescent coating. Figures 3.2(a) and (b) show the spectra within a wavelength window of to nm, and illustrate how the relative peak heights are altered as the number of sources is changed. This effect is due to the fact that randomly

(a)

(b)

(c)
oriented sources will exhibit a preference for WGMs depending upon their specific alignment. For example, as was shown in Section 2.3.2, electric dipole sources with a large tangential component to the surface of the sphere will couple more strongly to the TE modes, whereas electric dipole sources with a large radial component will couple only to the TM modes, as shown in Figs. 2.5 and 2.6. As the number of sources is increased, this effect is averaged out, with additional sources of any orientation making little difference to the spectrum if the number of existing sources is sufficiently high.
Figure 3.2(c) shows the trend in the difference in the height of a given peak as the number of sources is changed to a higher value. This procedure is carried out for prominent peaks within the wavelength window, and the mean value is then taken. It is found that the difference drops below % for , corresponding to more than sources. Therefore, from now on, a value of is chosen, corresponding to sources, which represents a sufficiently even coating for the purposes of studying the behaviour of coated resonators. Note that, for a small number of sources, there is a sharp increase in the mean value of the peak-height difference, which is an artefact of the coincidental alignment of small numbers of sources, resulting in similar peak heights for the prominent modes.
A comparison of the spectra resulting from a distribution of electric dipole sources, and a single dipole in a tangential or radial orientation, is shown in Fig. 3.3. The power is collected from a circular or box region, as defined in Section 2.3.2. It can be seen that the distribution of sources, each with random orientation, couples to both the TE and TM modes, while the single dipole source preferentially couples to one particular polarisation exactly as described above.
Although it has been shown that the flux collection region affects the relative coupling strengths of the modes, for the purposes of analysing the behaviour of the spectrum with respect to the geometric variables or the refractive index contrast, the focus from here on will be on the total radiation collected from a box region.

(a)

(b)
3.2.3 Understanding the mode behaviour of microbubbles
The behaviour of WGMs as a function of microbubble shell thickness is now analysed for a number of examples. Consider the case of the polystyrene microbubble with an outer diameter of m, with water both inside and outside the resonator, and coated with a fluorescent layer. As the thickness of the shell wall is varied across a range of to nm, as shown in Fig. 3.4(a), several effects are apparent. The mode positions do not remain the same as the thickness changes, and this behaviour is not linear, but crucially dependent on the structure of the characteristic equation, as seen in the Teraoka-Arnold model introduced in Section 2.2, and explored in more detail in the case of the multilayer model in Section 4.3.1. In addition, the peak height dramatically changes as the thickness decreases – an effect that will be investigated further in Section 4.4. Note that, for a sufficiently thin shell wall, there is a total loss of modes, as the dielectric layer is not able to contain the radiation and WGMs cannot therefore be sustained.
In Fig. 3.4(b), the shell thickness is kept fixed at nm, but it is the refractive index of the dielectric layer that is varied. As the refractive index decreases, there is also a reduction of the peak heights, resulting in mode loss if the index is too close to that of the surrounding medium. This provides a preliminary indication of the effect of the refractive index contrast from different materials in sustaining WGMs.
These two simple illustrations serve to highlight an important feature of layered resonators, namely, that the thickness of the shell and the refractive index contrast function as dual criteria in determining the ability of a structure to sustain WGMs. These effects will now be investigated more quantitatively, which will then become an important consideration in Chapter 5 when the results are applied to real-life cells.
3.3 Fluorescent silica microbubble case study
Although polystyrene microresonators have been the focus thus far, serving as a template to which additions and augmentations to the FDTD method have been added, the focus is now shifted to microbubbles, choosing a specific material that is easily

(a)

(b)
obtained for experimental purposes. Hollow silica glass beads33 3 Polysciences, Inc., - Valley Rd, Warminster, PA , USA, Hollow Glass Beads, Catalogue Number: . will be used in this section in order to verify the modelling capabilities explored up to this point, and to aid the investigation into the spectral properties of microbubble resonators.
Initially, batches of silica microbubbles, with refractive index at nm, are inspected in order to obtain approximate ranges for the size and shell thickness. They are then placed alternately in liquids of different densities in order to provide bounds on the shell thicknesses. The microbubbles are then suspended in ethanol, which has a density of g/cm3 near room temperature. Those that sink to the bottom of the container are re-suspended in water, with a density of g/cm3, and those that float to the top are thus considered to have a density between that of ethanol and water. Using this procedure, the behaviour of the microbubble density as a function of the shell-wall thickness may be plotted, as shown in Fig. 3.5 for a range of diameter values.
The results show that the shell thicknesses of the microbubbles lie in the range to . In addition to this experimental measurement, a visual inspection of a selection of microbubbles using confocal microscopy yielded a similar result, with a slightly higher upper bound of . As a result, a conservative estimate of the shell thickness is to . This particular range of shell thicknesses is considered in order to restrict the parameter space to the values expected from the density measurements.
The microbubbles are then coated with the carboxyl-functionalised organic dye
(4-(2-Carboxyphenyl)-7- diethylamino-2-(7-diethylamino-2-oxochroman-3-yl)-
chromylium perchlorate [218],
and a single droplet containing the microbubbles in solution is
placed onto a microscope coverslip, into an oven at C, and left to dry.
The microbubble WGMs are excited in free space by a mW, nm wavelength, continuous-wave laser, using an inverted confocal microscope setup as shown in Fig. 3.6. The emitted power is collected in free space with the same microscope, and passed to a spectrometer.

The fluorescence excites modes in multiple planes of symmetry in the resonator. Note that since only a small number of modes interacts with the coverslip beneath, their contribution to the total spectrum collected is minimised, and thus there is a negligible effect on the spectrum as measured using this technique [219].
The measured WGM spectrum is shown in Fig. 3.7, with vertical lines placed over the prominent modes to assist in the measurement of the FSR, which is found to be m.
The FDTD method is now used to simulate silica microbubbles of comparable size to the aforementioned experiment, and investigate the properties of the WGMs. A number of representative diameters and shell thicknesses is selected, and the change in the power spectrum with respect to the shell thicknesses is shown in Fig. 3.8. The positions of the modes are indicated in the bottom row ( m), from which the FSR can be calculated. The assignment of the mode numbers is achieved by selecting the closest mode to each peak, as obtained from a single-layer coated microsphere analytic model used to represent the microbubble [147, 148].
For the smallest diameter value m in Fig. 3.8(a), the modes in the spectra are well spaced, and there are no higher radial harmonics present, unlike the spectra for diameters and m in Figs. 3.8(b) and (c), respectively, which exhibit a number of higher order modes, especially for larger shell thicknesses. This larger quantity of nearly-overlapping modes makes the extraction of the mode positions, and especially the -factor, problematic. When examining purely the scaling behaviour of the -factor in Section 3.3.1, it is convenient to focus only on the geometric component of the -factor prior to the introduction of the radiative contributions, which affect the -factor through the choice of excitation method and the relative coupling strength of the emitted power to the modes. However, an extraction of the -factor directly from the spectrum, if it can be achieved, represents a more realistic assessment of the -factor than the geometric component alone, and these effects are incorporated into the -factor assessments performed in Section 3.4.


For the larger shell thicknesses, the spectra are expected to converge to the microsphere results, since the outer diameter remains fixed as the thickness is increased. In addition, little variation in the WGM spectrum is apparent for thicknesses greater than m; however, for m, there is a sudden onset where the mode positions become highly sensitive to the shell thickness.


Note that, as in Section 2.3.2, the fundamental radial modes (), which typically exhibit high -factors, are not able to be resolved at this grid resolution [157], unless the -factor drops within a measurable range. This can be seen in the top plot of Fig. 3.8(a), where the diameter and shell thickness are both sufficiently low that the fundamental radial mode can be resolved. For thin shell thicknesses (top row), it is the fundamental TE modes that become the most prominent mode for small shell thicknesses, and the TM modes become more difficult to resolve. In fact, the suppression of the TM modes for small shell thicknesses has been noted in a previous study [184], where the rapid reduction in the -factors in thin shell microbubble resonators was identified as an intrinsic property of resonator geometry. As will be explored in more depth with the benefit of the multilayer model developed in Chapter 4, particularly in Section 4.4, it will become apparent that the dominance of the TE modes originates from the structure of the matrix element components that comprise the separate polarisation components of the total emitted power spectrum. Effectively, the component of the power in the radial direction becomes suppressed as the thin shell thickness can no longer support modes that oscillate with this orientation, which are TM modes. Similar mode behaviour has also been predicted for the radiation of dipoles in the vicinity of optical fibres [65].
3.3.1 Free spectral ranges and -factors
The free spectral ranges (FSRs) of microbubbles with the selection of diameters and shell thicknesses considered are shown in Table 3.1. Note that the FSR should not be considered a constant quantity over a large wavelength range, and care must be taken to ensure that this FSR is consistent between simulation and experiment. This is addressed in the following section.
For large shell thicknesses relative to the diameter of the microbubble, the FSR does not vary significantly as the shell thickness changes, since the WGMs travel almost entirely within the shell, and are insensitive to the presence of the hollow interior region. As the shell thickness decreases, however, the evanescent field extends partially into the interior of the microbubble, and the FSR then begins to deviate from the microsphere value.
To assist in characterising the behaviour of microbubbles within this parameter space, contour plots for both the FSRs and the -factors are presented in Fig. 3.9. For each quantity, the TE and TM modes are considered separately.
In order to facilitate the efficient calculation of these contours, the single-layer analytic model [147, 148] is used to validate the FDTD results, as a complementary approach. The fundamental equatorial modes only are selected, as described in Section 2.2.3, centred around a wavelength of nm. The reason for this is the fact that the FSRs are dependent only on the mode positions, not the full spectrum, unless the deviating effect from nearby overlapping modes is taken into account. In addition, the most prominent modes within a spectrum originate from different radial mode numbers as the thickness is changed, as noted in Fig. 3.8. Such effects, while useful for characterising the spectrum, are disregarded for the time being in order to build a picture of the analytic behaviour of the FSR and -factors of fundamental modes by themselves.
In Fig. 3.9(a) and (b), it is clear that the behaviours of the FSRs in the TE and TM cases are almost identical. It is also apparent that, for large shell thicknesses, the FSR is not strongly dependent on the shell thickness, which is consistent with the analysis of the spectra. As the diameter increases, the minimum shell thickness before encountering deviations also increases, and the curvature shows a reduction in the FSR from the value of a microsphere of the same diameter.
Figures 3.9(c) and (d) show the purely geometric portion of the -factor, from Eq. (2.39), which can be calculated independently from the spectrum by finding the roots of the characteristic equations [147, 148]. In this case, the magnitude of the -factor scales very quickly, as described in Section 2.2.3, and so the logarithm of the -factor is plotted. The contours show a fairly stable magnitude of with respect to the shell thickness, but that rapidly decreases if the shell thickness becomes too small.
| D [m] | |||||
|---|---|---|---|---|---|


(a) (b)


(c) (d)
3.3.2 Critical values of geometric parameters for sustaining WGMs
While it is useful to characterise the mode behaviour for silica microbubbles as a test-case, when the knowledge is applied to the possibility of biological cells, which are unlikely to function as ideal resonators, it is useful to investigate under what conditions the structure of a cell is unable to support WGMs. While it is clear that sufficiently thin shell walls for silica microbubbles cannot support modes, which is also the case for small outer diameters, as indicated by the rapid reduction of the -factors, the critical values of these geometric parameters for sustaining modes for a given refractive index contrast will now be investigated.
Here, a silica microbubble resonator is considered as a cell analogue, due to its refractive index being similar to most proteins associated with the outer membranes of some cells [220]. Since cells are usually suspended in a liquid medium, the scenario in the previous section is altered so that the microbubble is placed in water. This also allows greater scope for the FDTD method to probe the range of shell thicknesses required for sustaining WGMs, including the fundamental modes [158]. Furthermore, a larger diameter is considered, m, in order to compensate for the ensuing decrease in the index contrast, while remaining an example of a resonator that is close to the mode loss condition.
WGM spectra for a variety of shell thicknesses are shown in Fig. 3.10. For larger values of shell thickness, there is little change to the spectra, as expected. However, as the shell thickness is decreased, there is a critical value, , below which no modes can be sustained. This transition appears to occur rapidly, as a function of the shell thickness. Representative values of the shell thickness are shown in Fig. 3.10(a), illustrating the transition. For m, and a refractive index contrast of within this wavelength range, the critical value is close to nm. For shell thicknesses below , the scattered spectra are quite similar in shape, with little WGM structure apparent, as shown in Fig. 3.10(b). The reduction of the -factors as the shell thickness decreases allows adjacent modes to overlap, which are no longer distinguishable.
The implications of this regime of the geometric parameters where modes cannot be sustained are significant with regard to the search for a biological resonator. While it has been established in Section 1.2 that certain classes of biological cells can exhibit degrees of symmetry, in order to sustain resonances, such cells must also fall within the required geometric parameter regime, for their refractive index, diameter and layer thicknesses. If this is not the case, then cells can only be used as resonators with the addition of artificial components or equipment that can facilitate the trapping of modes, such as mirrors [221], or the use of pre-existing resonators incorporated into the cell [107, 114]. An estimation of the bounds of the geometric parameters required to sustain resonances in the context of cells is included in Section 5.3.

(a)
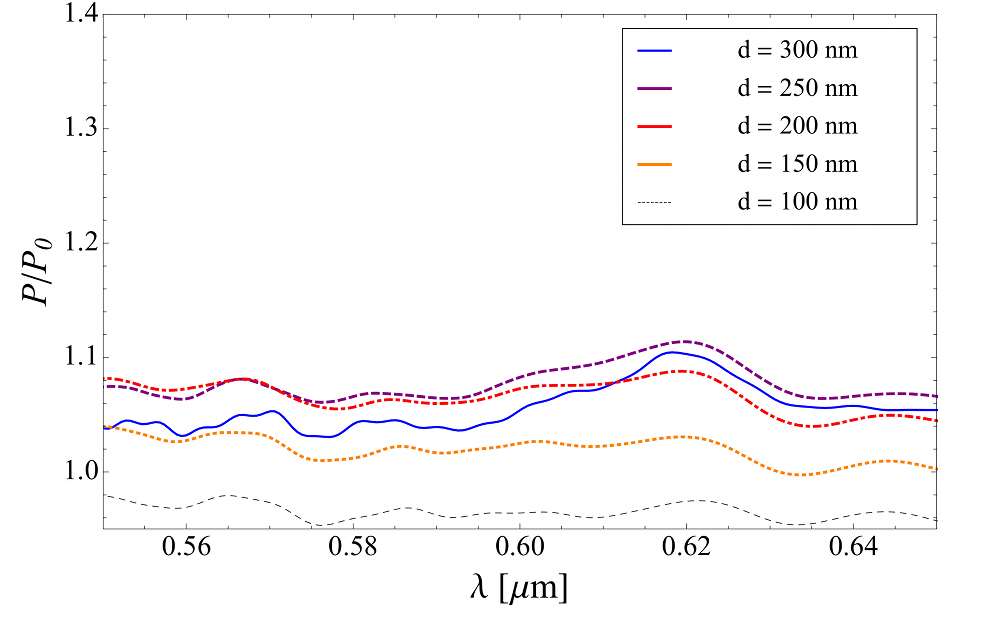
(b)
3.4 Non-destructive determination of the geometry
The ability to extract the geometric parameters of a given microbubble resonator in a non-destructive manner is an important step toward reusable sensing apparatus. In particular, the spectra obtained from WGM devices used for sensing are more easily interpreted if the outer diameter and the thickness of the shell wall are well known. Specific examples of apparatus that benefit from detailed knowledge of the resonator geometry include microbubble-based aerostatic pressure sensing [206, 222], and frequency comb generation technologies [28, 29]. Such techniques are sensitive to the precise value of the shell thickness of the resonator, and make the development of an accurate method of extracting this information without destroying the apparatus itself an attractive prospect. To date, modeling-based methods of extracting the shell thickness rely heavily on assuming that the surface area of the resonator is preserved during the melting and expansion stages of fabrication, and their accuracy is limited to about for a m diameter microbubble [223, 206].
While alternative non-destructive methods exist for the determination of these parameters, such as confocal reflectance microscopy [223], they are limited by the axial resolution of the microscope. Here, a new spectrum-matching method is developed, which utilises the sensitivity of the mode positions and the behaviour of the spectrum to the geometric parameters. The value of such a method is the ability to perform on-site identification of the parameters, as well as the identification of both the mode number and polarisation of each mode within a specific wavelength range.
Using a linear form, [224], fits are produced for a range of simulated shell thicknesses, as shown in Fig. 3.11. By performing a sufficient number of simulations, the mode positions of the simulated spectra can be fitted to those of the measured spectrum. The shaded band indicates the statistical uncertainty at each value of , obtained from the covariance matrix of the linear fit.
| thickness/diameter () | thickness [m] | best fit diameter [m] |
|---|---|---|
Combinations of and for which the extrapolations in Fig. 3.11 attain the measured value of FSR are summarised in Table 3.2. The simulated spectrum, whose prominent resonance positions match those of the experimental results most closely, corresponds to a diameter of m, and a shell thickness of m. The criteria used in determining the best match is as follows. For each of the trends considered in Fig. 3.11, the values of and corresponding to the measured FSR are selected. The spectra for each of these combination of and are compared to the measured spectrum, and the simulated spectrum that corresponds to the minimum difference in the positions of the prominent modes is selected.
In Fig. 3.12, the measured spectrum is represented by the dotted line, and the simulated spectrum is represented by the solid line. The resolution used in the simulation corresponds to m, with a wavelength resolution of nm. Note that the experimental results have been smoothed to match the wavelength resolution of the FDTD simulation, to remove part of the noise. Unlike the experimental results, the simulation results are normalised, and so the -axis is offset appropriately for the simulated spectrum.
The mode positions are identified using the single-layer microsphere model [147, 148]. The positions of the prominent TE and TM modes are shown by dotted and dash-dotted vertical lines, respectively. The finite-width vertical bands indicate the uncertainty derived from the spatial and temporal resolutions added in quadrature. For two selected higher order modes, TE and TE, a fit of the measured spectrum, using two Lorentzians, is able to resolve the underlying doublet mode structure as shown by a thick solid line placed over the experimental spectrum. The

(a)

(b)
peak positions from these fits lie within the systematic uncertainty bands of the simulated higher order modes, denoted by dashed and solid vertical lines, respectively. This indicates that the underlying mode structure of the experimental results is consistent with the FDTD simulations for these modes.

The most prominent modes excited by a fluorescent dye are not easily predicted. In this experiment, it appears that the first radial TM modes received the largest coupling. The first radial TE modes and higher order modes that appear in the simulation are not readily apparent in the experiment. Deviations from perfect sphericity in the experimental case can reduce the -factors to the point where these modes are not easily measurable. This occurs due to the generation of extra overlapping modes, i.e. mode-splitting, corresponding to deviations in the mean diameter in different axes of rotation of the resonator [115, 225, 118].
The FSR over the wavelength range to nm is expected to be non-zero, and should be taken into account when performing the fit, since it affects the value of the measured and simulated FSR. The FSR can be estimated for the two spectra displayed in Fig. 3.11. The results are shown in Table 3.3. In both the experiment and the simulation, there is a systematic trend for the FSR to increase as the wavelength increases. The FSR is larger in the case of the FDTD simulation, with a shift of in the FSR over this wavelength range. This difference in the FSR between the measured and simulated spectra makes a precise matching of all the mode positions problematic at first glance. However, it should be noted that the systematic uncertainty in the mode positions of the FDTD simulation overlaps the peak positions from the experimental results, and thus agrees within the uncertainty.
A comparison of the -factors of the prominent modes is given in Table 3.4. The mean -factors from FDTD are statistically consistent with those of the experiment. Furthermore, the -factors are fairly comparable with those expected from a finite element model (FEM) [182, 183, 184], , for a diameter of m.
The non-destructive extraction of the geometric parameters of a given microbubble purely from its spectrum is a valuable technique in resonator design. While it is possible to refine the estimation of the geometric parameters further by considering an expanded range of initial diameter values to increase the tightness of the extrapolation, requiring the use of more computing resources, the study presented in this chapter serves as an example of the practical use of the method. It is clear that FDTD simulation represents an important tool for predicting the performance and behaviour of microbubbles prior to fabrication, allowing for realistic imperfections to be incorporated.
3.5 Microbubbles as a prelude to biological cells
In this chapter, the properties of microbubble resonators have been explored, with a view to understanding the fundamental features of whispering gallery modes, and the limitations on sustaining them. A model was developed to include a distribution of dipoles placed on the surface of the resonator, to allow for the simulation of the mode-coupling expected from fluorescent dyes used in recent biosensing experiments. Furthermore, a method for extracting the geometric parameters of microbubble resonators was presented.
| Spectrum | TM | TM | TM | shift |
|---|---|---|---|---|
| Silica shell | 0.0128 | 0.0131 | 0.0137 | 7.21 |
| FDTD | 0.0121 | 0.0129 | 0.0133 | 9.37 |
| Spectrum | TM | TM | TM | TM | Mean | std. dev. |
|---|---|---|---|---|---|---|
| Silica shell | 663 | 877 | 768 | 783 | 773 | 88 |
| FDTD | 733 | 911 | 760 | 707 | 778 | 92 |
As an application for modelling biological cells, the FDTD method itself presents some opportunities, but also limitations. The general nature of FDTD allows arbitrary shapes, deformations, inhomogeneities and radiation collection regions to be incorporated into the resonator structure. Investigating how these different scenarios impact the measured spectra is a worthwhile exercise, especially for understanding the key criteria required of a resonator, in particular, a biological resonator, which will be explored in Chapter 5. However, it is clear that the range of diameters and shell thicknesses that can be feasibly simulated presents a crucial limitation. It may be that biological cell resonators required a larger diameter than is easily simulated in FDTD, especially, as it will become apparent, as the refractive index contrast of the protein structures surrounding many cells compared to their native media is not large. Therefore, in the next chapter, a new model is developed, which incorporates the most useful features of each of the modelling approaches explored thus far. The new model is able to handle an arbitrary number of dielectric layers and excitation methods, including dipole sources, and any number of uniform layers of sources, as well as the underlying fields that produce the spectra. The model unifies the formulae of previous approaches in the literature, and encompasses a number of scenarios such as source placement, and dipole polarisation, expressed as a single equation. Furthermore, the code produced for Chapter 3 has been structured so that the algorithm runs efficiently over a wide range of wavelength values, as described in Appendix C.5.
It is the development of this general, multilayer model that will form the cornerstone for the modelling side of the investigation for the remainder of this thesis. Since the model is able to encapsulate a wide variety of scenarios and parameters, it is the ideal tool for assessing the feasibility of a biological cell resonator, and for assisting in the task of narrowing the search for a cell to a few most likely candidates.
4A Unified Model for Active Multilayer Resonators
While the principal focus of this thesis is to understand the behaviour of whispering gallery modes in the context of biological resonators, and under what conditions a cell could support these modes, it is worthwhile to explain in detail the construction of a new, general model [40] that combines many useful aspects of the existing techniques described in the previous chapters, while remaining fast and efficient to use.
This model allows for an arbitrary number of concentric, spherical dielectric layers, and any number of embedded dipole sources or uniform distributions of dipole sources, to be included in the resonator. These methods for exciting the modes are analogous to embedded nanoparticles, or fluorescent dye coatings, respectively. The latter of these options may also potentially be used to model the natural autofluorescence of a cell. While the focus of the model is limited to spherically-shaped multilayer resonators, it represents a suitable choice for the most promising candidate cells to be investigated, introduced in Chapter 5.
Included in this model is the ability to simulate the spectrum, which has been shown to be a powerful and instructive technique for analysis of WGMs in Chapters 2 and 3. The efficient generation of power spectra, together with accurate calculation of the mode coupling efficiencies that are comparable with experiment in a multilayer scenario, represents an important step forward for tools that aid microresonator design. In each mode coupling scenario, the emitted power is expressed conveniently as a function of wavelength, making use of the transfer matrix approach, and incorporating improvements to its stability, resulting in a reliable, general set of formulae for calculating WGMs.
In the specific cases of the dielectric microsphere and the single-layer coated microsphere, the derivations of the formulae are shown explicitly in Appendix B. In these cases, the model has been verified by known formulae in the literature, as described in Appendix C. This work is presented in the publication, Ref. [40], listed as Item 3 in Section E.1.
4.1 Motivation for a unified description
The derivation of a model that contains multiple layers of concentric spheres has, until now, not been treated comprehensively. The WGM spectrum model developed by Chew et al. [154, 143] considered spherical dielectric particles with embedded dipole sources, with the motivation being the modelling of Raman and fluorescence scattering. The Chew model was then extended to include a uniform distribution of dipole sources placed on the surface of a sphere [136]. A multilayer variant of the Chew model exists, but contains no method for calculating the power spectrum [154] and uses a different notation to other methods in the field [133]. Meanwhile, a generalisation of Mie scattering theory, which is constrained to model the excitation of modes by an external ray, has been developed for spherical concentric ‘onion’ resonators [144, 145, 146]. While the long-range scattering behaviour of an external ray is an important test case, this latter approach does not provide an emitted power spectrum with which to compare with measured WGM resonances.
Analytic models typically make use of the transfer matrix approach [133], which is faster and more convenient to construct mathematically than the multilayer Chew model. However, this approach suffers from numerical instabilities for certain parameter values, in particular, resonators with very thin shell layers [155], and thus needs to be treated carefully by computing the Wronskian for transfer matrices with determinants near zero. More recent studies on single-layer coated microspheres clearly separate the spectrum into TE and TM polarisations, allowing for greater flexibility in analysing the mode behaviour [147, 148]. Although this Teraoka-Arnold model can accurately calculate the resonance positions for a single-layer coated microsphere, the spectrum is not derived for this case, and therefore quantities such as the -factor can only be estimated by considering their geometric components, .
To summarise, the main advancement of the present work is the derivation of a multilayer microsphere model, which may include dipole sources in any layer, or an active layer of sources, and which is able to generate the wavelength positions of the TE and TM modes. The model can also be used to calculate the emitted power spectrum from a formalism that is easily extended to include a number of other excitation strategies.
4.2 Defining the multilayer model
In this section, the methodology for calculating the quantities needed to find the wavelength positions of the resonances and the radiation power spectrum of a multilayer microsphere is stated. In general, one must calculate coefficients that determine the relative contributions of the components of the electric and magnetic fields in a specific region of space – either in the central part of the resonator, one of the internal layers, or in the outermost medium. The coefficients in each of these regions will be shown to be related to one another through the use of boundary conditions at the interfaces between layers. Therefore, by knowing a set of field coefficients in one specific layer, and knowing the boundary conditions required for a multilayer scenario, the coefficients, and their corresponding fields, can be calculated for any other layer.
The coefficients encode the behaviour of the electric and magnetic fields within the structure, from which the power spectrum can also be calculated by integrating the Poynting vector over the total solid angle. That is, the coefficients can be used to access the geometric attributes of the resonances. This is useful in itself – while the absolute values of the coefficients may not be known in the absence of radiation, it will be discovered that resonance positions of the WGMs are determined by ratios of the coefficients, as described in Section 4.3. The general formalism of this model also allows radiation to be included, which is incorporated into the coefficients as well. This feature imbues the model with a powerful and general functionality.
4.2.1 Geometry
In describing the model in detail, first, the geometry of the multilayer scenario will be explained. Consider a microsphere with an arbitrary number of concentric layers, . The refractive index distribution and thicknesses are illustrated in Fig. 4.1. Let us assume that each layer includes a dipole emitter located at position , where is the layer number and the prime symbol is specifically used for the position of the sources. The radial coordinate will be used to represent the fields at an arbitrary point in space, and the quantity will be used to specify unambiguously the radius of the boundary between the and region. The outermost region, , is extended to infinity, and the innermost region is denoted as . Hence, as an example, the radius of the inner region is called , and the outer boundary of region is .

It is required that the model describe solutions to Maxwell’s Equations, which take the following form in Gaussian units
| (4.1) |
and also take into account the appropriate boundary conditions of the scenario. The solutions for the fields can generally be decomposed into radial and angular components using vector spherical harmonics (VSH). While there is a number of different notations for the VSH occurring throughout the literature [226, 165, 146, 133], the notation used here is , and , the properties of which, and their relations with the other notations, are described in Appendix A. These three functions form an orthonormal, complete set. That is, any vector field in spherical coordinates can be expanded based on these functions. For example, the electric field can be expanded as
| (4.2) |
where the coefficients and can be found by using orthogonality relations (see Appendix A). Note that the vector is oriented in the radial direction and and are oriented in the transverse plane, perpendicular to the unit vector , and hence and represent the coefficients of the transverse field.
The total electric and magnetic field in each region can be written as the sum of the fields – first, those originating from a dipole within the layer itself, denoted and , and second, those associated with the reflection and transmission of the fields from other layers, denoted and . Hence, the total fields may be found simply by taking the superposition of these two contributions for each field, and
The general form of the fields and in an arbitrary layer can be written in terms of a radial component and a transverse component, each with a related incoming and outgoing wave, described by and , respectively [132]
| (4.3) | ||||
| (4.4) |
One may then show explicitly how the fields can be written in a form consistent with Eq. (4.2) in terms of the orthonormal functions , and , by appealing to the properties from Appendix A for the VSH
| (4.5) | ||||
| (4.6) |
Here, , , and are coefficients that are determined through the boundary conditions of the multilayer structure. Note that and describe the transverse component of and thus the TM modes, whereas and describe the TE modes, as defined by Jackson [165]. In this notation, the TM modes are defined as the modes for which has no component in the radial direction, whereas the TE modes are those for which has no such radial component.
At this point, it is important to emphasise that the forms of Eqs. (4.3) through (4.6) could be written using alternative sets of linearly independent Bessel and Hankel functions to describe the incoming and outgoing waves. Here, the functions and have been chosen throughout so that, as far as possible, the form of the fields and the contributions to them from radiation sources are in the same format as each other. This ensures that appropriate functions of can be constructed for any layer, including the innermost and outermost regions, in a unified way. This will become apparent when the contributions from dipole sources are included in the field coefficients, in Eq.(4.40). But first, the transfer matrix method will be explained for an arbitrary layer in the absence of dipole sources.
4.2.2 Transfer matrix method
Fields in an arbitrary layer
The transfer matrix method is a way of computing the boundary conditions for an arbitrary number of interfaces, and particularly useful for adaptation in the multilayer microsphere scenario. The boundary conditions at the interfaces of the layers imply that the transverse components of the fields are continuous, while there is a discontinuity in the normal components of the fields. In order to enforce continuity, the focus must then be on transverse components of the fields in layer , indicated by the superscripts on and in Eq. (4.2). These components may be written in matrix form
| (4.7) |
where is a four-component vector of the transverse components of the electric and magnetic fields, and includes the four field coefficients as follows:
The matrix is a block diagonal matrix, and can be derived from Eqs. (4.5) and (4.6)
In arriving at Eq. (4.2.2), the relation has been used, as well as the Riccati-Bessel and Riccati-Hankel functions, and and their derivatives with respect to their arguments, and .
Consider the top left block of the matrix . It is clear from Eq. (4.7) that these terms have coefficients of or , and thus represent the field contributions to the TM modes, whereas the bottom right block corresponds to the TE modes, . The terms in the top row, from left to right, correspond to the incoming and outgoing contributions to a transverse component of the electric field , respectively. The second row represents the equivalent contributions to the magnetic field component of the TM modes, .
In the transfer matrix method, it is necessary to invert the matrices , and therefore it is important to ensure that the determinant of the matrices is well characterised, so that parameter regimes that are problematic can be identified ahead of time. It is already well known that a calculation of the transfer matrix method that is not sensitive to this effect can lead to instabilities for very thin layers, and that these can be avoided numerically by pre-calculating the known, analytic Wronskian form of the determinants [155]. For the Wronskian defined as
| (4.20) |
with the derivative with respect to , and using the following equation derived from the properties of the Riccati-Bessel and Riccati-Hankel functions [133]
| (4.21) |
the determinants of blocks, and , can then be simplified in the following manner
| (4.22) | ||||
| (4.23) |
This concludes the discussion of the form of the matrix , which operates in the absence of radiation from dipole or other sources, in this notation. In order to incorporate the radiation effects into the field coefficients, the form of the contributions from the dipole sources must be explained. While this choice of source has become the focus of the investigation because of its usefulness in considering fluorescent layers or embedded nanoparticles, as mentioned in Section 3.2, it does not preclude the use of alternative methods of excitation, the contributions from which can be obtained in a straightforward manner using the following technique for modifying the field equations.
Fields generated by dipole sources
The contributions to the electric and magnetic fields from a single dipole located in layer and at position are denoted and , in a similar way to Eq. (4.7)
| (4.24) |
Here, is the Heaviside step function ( for and for ), which ensures that the correct Bessel or Hankel function, or , is selected when evaluating the fields at point . In the case where , a subscript is used, such as in , whereas, for a subscript is used. The vectors corresponding to the dipole source, , and take the following forms
| (4.25) |
The quantities that occur inside the dipole vectors, , , and are special coefficients that correspond to the dipole radiation Ansatz [143]:
| (4.26) | ||||
| (4.27) | ||||
| (4.28) | ||||
| (4.29) |
Since the coefficients and correspond to an electric field in the radial direction, they contribute only to the TM modes, whereas and contribute only to the TE modes [165, 149], a fact that has sometimes caused the labels to be interchanged in the literature [133]. In this notation, the subscripts and of these dipole coefficients indicate their origin in the electric and magnetic multipole expansions, respectively. The symbol indicates derivatives with respect to the position , and the symbol refers to the dipole moment vector, which may be freely chosen.
Now that the field components in the layer due to a dipole have been established in Eq. (4.24), and noting that it has essentially the same format as Eq. (4.7) where a vector of coefficients is pre-multiplied by a matrix , the total field can be found by simply adding the two equations together
| (4.30) |
With the total fields now specified above, the continuity condition across each boundary can be enforced, and performing this process will lead to the definition of the transfer matrix.
The continuity equation
The continuity of the transverse components of the electric and magnetic fields at the interface of the adjacent regions and leads to the following relationships among their respective field coefficients
| (4.31) | ||||
| (4.32) | ||||
| (4.33) |
Equation (4.32) can be used recursively to connect the coefficients in the outermost region, , to the innermost region, . This encodes the continuity condition. By applying this recursive process, the coefficients in the inner and outermost regions can be related to each other, using the following compact notation, which includes a new composite matrix , and a constant vector that includes the contributions from the dipole radiation
| (4.34) |
The matrix , which relates the coefficients in the outermost region to a layer (for which is a special case), is known as the scattering matrix, and is defined by the repeated matrix multiplication occurring in the first term of the right hand side of Eq. (4.33)
| (4.35) | ||||
| (4.36) |
Note that the scattering matrix is always composed of repetitive blocks of matrices in the form of . These blocks are the transfer matrices, as they encode the continuity condition across the boundary at a radius for two adjacent media with wave-numbers and . Explicitly writing the form of these matrices, it can be found that
| (4.37) | ||||
| (4.38) |
As expected, the transfer matrices are block diagonal matrices, since they are composed entirely from the block diagonal matrices. The blocks and can be computed directly from Eq. (4.2.2) and written in the same way for both TE and TM polarisations
| (4.39) |
where the shorthands for the size parameters and are introduced, as well as and in the case of , whereas and in the case of .
The vector , which includes the dipole contributions, can be written in a way that is general for any choice of from to , given by
| (4.40) |
The Kronecker delta functions ensure that the limiting cases of and have the correct form. Taking the example of , the dipole would be in the innermost medium, and it is thus strictly the case that , and therefore only the term contributes to . In contrast, for , the dipole is in the outermost medium, and since there is no radius of the structure greater than the radial location of the dipole, , only the term contributes. In all the other intermediate values of , there is a contribution to the field coefficients in layer , , from dipole sources placed at radii above and sources placed at radii below , if such sources exist within the structure. The sum in Eq. (4.40) is effectively over the regions that contain dipoles, since terms associated with regions with no dipoles are zero.
Equation (4.34) can be inverted to obtain in terms of as follows,
| (4.41) |
Note that the vector contains both information about the structure through the scattering matrix , and information about the dipole sources through and . However, the matrices and are independent of any source, depending only on the parameters of the structure. To avoid confusion between the elements of matrices and , from now on, the notations and for are used.
The matrices of the form are block diagonal matrices, since they also have been built based on block diagonal matrices . One can define an inverse scattering matrix , which allows the equations for the resonances positions and the power spectra to be put in the most convenient form
| (4.42) |
In the innermost region, the coefficients of the outgoing waves in Eq. (4.3) and (4.4) are zero, and hence the vector has the form . Using this observation, the recursive formula in Eq. (4.41) can be simplified and then solved to find in terms of and :
| (4.43) | ||||
| (4.44) | ||||
| (4.45) | ||||
| (4.46) |
Since the coefficients determine the fields in the outermost region, they are the scattering coefficients of the whole system of the microsphere and its sources. By way of comparison, these coefficient are equivalent to the and coefficients of Mie scattering ( corresponds to , and corresponds to ), and represent the different polarisations of the dipole moments.
Once the values of the field coefficients in the outermost layer are known by calculating Eqs. (4.43) through (4.46), the coefficients in any other layer, , can be obtained from the recursive formula of Eq. (4.33). Then, the coefficients may be substituted back into Eqs. (4.5) and (4.6), in order to obtain the values of the total fields in any layer , including dipole radiation, and .
In this section, the transfer matrix approach has been explained. The form of the transfer matrix has been shown explicitly, and its use in obtaining the field coefficients in any layer of a multilayer microsphere resonator has been described. For reference, a MATLAB code for the numerical calculation of these quantities, and the formulae in the next section, has been placed online for public availability-11 1 http://www.photonicsimulation.net see Appendix E.4. While access to the field coefficients allows a wide range of quantities of potential interest to be calculated, it is important to enumerate some examples that are of particular relevance to this thesis. In the next section, recipes will be provided on how these quantities may be extracted from the general equations laid out in this section, and how to interpret them.
4.3 Simulation recipes
In simulating physical processes that are of phenomenological interest, such as WGMs, one must be clear in determining what aspect of the process to draw out from the formulae. Two particular examples of this, encountered in Chapter 2, are the positions of the WGMs and the emitted power spectrum. In the former case, the method of excitation of the modes is irrelevant – the positions of the modes are dependent purely on the structure of the resonator in a given medium. However, in the case of the spectrum, the relative coupling of energy to different modes is highly dependent on the technique used to excite them. In fact, the -factor that is extracted from a measured spectrum takes into account this radiation component, as well as the intrinsic geometric -factor, and other sources of loss described in Section 2.2.3.
In the first recipe, the method for extracting the positions of the structural
resonances from the transfer matrix approach is stipulated. Then, the formulae
for the scattered power as a function of wavelength are shown for several
excitation scenarios (focusing on dipole sources in particular), which can be
used to simulate spectra. While the results are summarised here for reference,
full derivations of these formulae can be found in
Appendix B.
But first, the use of Eqs. (4.43) through (4.46), which are
general, is explained for a range of scenarios:
Scenario 1. No sources are present:
If there are no dipoles in the structure, and no
incident wave on the resonator, then one can assign .
In this case, one may calculate the ratios of the far-field scattering
coefficients and from Eqs. (4.43) through
(4.46), which removes the dependence of these quantities on the unknown
coefficients and for the innermost layer. From these ratios, the
denominators and specify the structural resonances since
they become zero at the resonance wavelength. By searching for roots in these
two denominators, one can find the TM and TE mode positions, respectively,
as described in Section 4.3.1.
Scenario 2. Dipole sources are present:
If there are dipole sources in the structure, then,
without loss of generality, one may choose
, solve for and
from Eqs. (4.43) and (4.45), and then find and
from Eqs. (4.44) and (4.46), respectively.
The reason why it is permissible to do this is due to
the fact that the total emitted power must be the same in both the near and
far fields. Therefore, by freely selecting the values of and ,
the total power is not altered; however, it is more convenient to select a
notation whereby the radiation, in the absence of structure, is simply a plane
wave with a Bessel function. If a structure is present, then the extra
scattering component is entirely incorporated into the coefficients
and , rather than being distributed arbitrarily across all four
coefficients. This flexibility is essentially a consequence of the extra
degrees of freedom afforded by the model in order to keep the notation of
Eqs. (4.3) through (4.6) in the same, general format for any
layer, including the innermost and outermost regions.
Scenario 3. There is an incident field only: If there is only an incident plane wave interacting with the structure, then once again one may set . In addition, the coefficients and are known from the incident wave expansion. This provides enough information to solve the system of Eqs. (4.43) and (4.45), including , , and .
4.3.1 Structural resonances
Consider the case where there are no sources – neither plane waves nor dipoles, as described in Scenario 1. By setting in Eqs. (4.44) through (4.45), one finds
| (4.47) | ||||
| (4.48) |
Recall that, in the expansion of the electric field in terms of the VSH in Eq. (4.3), is the coefficient of the term and is the coefficient of the term in the outermost region . Hence, it is expected that the ratio should approach infinity near a resonance with a transverse magnetic component only, corresponding to the TM modes. Similarly, in the magnetic field of Eq. (4.4), is the coefficient of the term and is the coefficient of the term, in the outer layer . In this case, the ratio of should approach infinity near a resonance with a transverse electric component only, corresponding to the TE modes. As a result, both and can be used to calculate the TM and TE modes, respectively, meaning
| (4.49) | ||||
| (4.50) |
Note that these equations are, in general, multivalued. For a given azimuthal quantum number , the solutions to Eqs. (4.49) and (4.50) form the fundamental radial modes and their harmonics. Since the higher order harmonics have larger values of the Bessel function argument () at their root values than the fundamental modes, all modes that appear within a given wavelength range, including higher order modes, can be obtained. The numerical code associated with this thesis (Appendix E.4) uses the optical and geometrical properties of any structure, to find the scattering matrix , and numerically solves Eqs. (4.49) and (4.50) for any range of wavelengths. Note that in the single-layer case, where , these equations become exactly equivalent to the corresponding characteristic equations of the Johnson model [153] introduced in Section 2.2, as shown in Appendix C.2.
4.3.2 Scattered power
In order to be able to simulate a spectrum, a method for explicitly calculating the total radiated power of the system including any dipole sources, as described in Scenario 2, must be outlined. The first step is to note the behaviour of the electric and magnetic fields in the far-field region, that is, for . In the outermost region, for , the forms of the scattered fields in Eqs. (4.3) and (4.4) may be simplified in the same manner as in Ref. [132], using the property that the Bessel function of the first kind is suppressed at long range.
By performing the angular integration over the Poynting vector, constructed from the scattered and fields, the total radiated power takes the following form
| (4.51) |
This equation is general, and is valid for any number of dipole sources present within the multilayer structure. When there is no dipole in the outermost region, the formula can be further simplified, using . However, to unpack this equation, a range of special cases will now be considered in order to demonstrate how the formula can be simplified to a given form.
An embedded nanoparticle
For the specific case where only a single dipole is placed in one of the regions , which may be the innermost or outermost region, the scattering coefficients of Eq. (4.51) can be written in a convenient form
| (4.52) | ||||
| (4.53) | ||||
| (4.54) | ||||
| (4.55) |
Using this notation, it is clear that and correspond to the contributions from the TM modes, whereas and correspond to the contributions from the TE modes.
By substituting in the forms of the dipole coefficients from Eqs.(4.26) through (4.29), radial (normal) and tangential (transverse) components of the total power can now be specified separately:
| (4.56) | ||||
| (4.57) |
The normalisation of the emitted powers have been carried out with respect to the medium that contains the dipole, such that
| (4.58) | ||||
| (4.59) |
where and are the polar components of the polarisation vector . Equations (4.56) and (4.57) are essentially more generalised versions of Eqs. (2.23) and (2.24) from Chapter 2, respectively. It is shown in Appendix C.1 that in the special case of a single layer , corresponding to a microsphere, these sets of equations are equivalent.
Note that the formulae for the emitted power shown thus far, Eqs. (4.51), (4.56) and (4.57), are functions of the wave-number , and thus functions of the wavelength . The emitted power may be computed as the wavelength is input for a range of values. The wavelength values that coincide with the resonances will encounter strong contributions to the emitted power, corresponding to the WGMs.
An active layer
While the inclusion of any number of separate dipole sources represents an important, general functionality of the transfer matrix model, it will be useful to be able to replicate the fluorescent-layer approach, developed in Chapter 3 for FDTD, in this general multilayer setting.
Consider a multilayer structure where one of the layers consists of an active material. By applying the same technique employed in the Chew model [136], a uniform distribution of randomly-oriented dipoles, represented by a density function , is introduced into a layer . Since it is assumed that the orientations of the constituent dipoles are averaged over the distribution, the emitted power can be written in the form
| (4.60) |
the greater weighting of the transverse component originating from the two degrees of freedom associated with tangential oscillations [136]. The normal and transverse components can be calculated separately by integrating the power with respect to the parameter over the shell region
| (4.61) | ||||
| (4.62) |
The shell region has a volume , noting that if , that is, the innermost layer is chosen to be populated with dipoles, then by convention, is taken to be zero as the volume is simply a sphere bounded by the innermost radius. The integral components of the above equations take the forms
| (4.63) | ||||
| (4.64) | ||||
| (4.65) |
Note that the TE modes are entirely contained within , with the remaining components containing the TM modes. These integrals can be computed by appealing to the properties of the Bessel and Hankel functions, using the functional form in Eq. (B.33) of Appendix B.3. The expressions that follow constitute a tractable form, which has been included in the code online (see Appendix E.4). Estimates of the computing time for the normalised emitted power at a single wavelength are discussed in Appendix C.5. With the expressions , and now known, the total averaged power can be calculated by combining Eqs. (4.61) and (4.62)
| (4.66) |
In the special case of a microsphere, a numerical calculation testing that this formula correctly reproduces a spectrum from the Chew model [136] is shown in Appendix C.1.
4.4 Demonstration of a coated microsphere including dispersion
In order to demonstrate the functionality of the multilayer model, a scenario of contemporary relevance is considered, which can be uniquely treated by the model. Consider a microsphere with a solid core of silica, which is then coated with a thin polymer (PMMA) layer [102], leading to an outer diameter of m. This scenario corresponds to the number of layers, . PMMA is simulated in this example because it can act as an active layer [152] and is a straightforward way of testing the functionality of the model. Both materials include dispersion through their respective Sellmeier equations [227, 228], and across the range of wavelengths simulated, to nm, the refractive index of silica varies from to , whereas the index of PMMA varies from to . The resonator is also surrounded by water (, without dispersion).
The behaviour of the WGM spectra as the thickness of the coating is varied is shown in Fig. 4.2. At the diameter considered, higher order modes are not strongly coupled to, and so both the TE and TM modes remain distinct, as can be seen in Fig. 4.2(a). The refractive index contrast between silica and PMMA is relatively small, and so the dependence of the mode positions on the thickness of the coating is more mild. A close-up view of the plot is shown in Fig. 4.2(b). The vertical lines indicate the full-width at half-maximum (FWHM) positions for a variety of peaks, from which the -factors can be extracted, using Eq. (2.45). -factors corresponding to a selection of TM and TE modes are also shown above each peak. Note that for the TM modes (the left three peaks) there is a decrease in the -factor as increases, but not for the TE modes. This is a consequence of the structure of the matrix elements that comprise the scattering coefficients of Eqs. (4.52) and (4.53). This observation is consistent with the results in Section 3.3, and in the literature, which note the reduction of the -factors of the TM modes for resonators with thin dielectric layers [184, 109].

(a)

(b)

(a)

(b)
The sensitivity of the WGM peaks can be examined by varying the refractive index of the surrounding medium, . In Fig. 4.3(a), the thickness of the layer is nm, and the mean TE peak shift leads to a sensitivity of nm per refractive index unit (RIU). A figure of merit (FOM), here defined as [115], is also provided to assess the sensing performance of the microspheres. For a given sensitivity , the value of chosen is the mean value of the peak as it shifts to its new position as a function of . The inset of Fig. 4.3(a) shows a decrease in the FOM as a function of . The total spectrum for is shown in Fig.4.3(b), along with the separate TE and TM contributions. By looking at the position of a particular mode in the total power spectrum, it is clear that it is affected by the close proximity and broad width of the TE and TM modes. This shows that in the simulation it is sometimes instructive to decompose the modes and analyse the structure in terms of the separate polarisation components, as the resonances that appear in a spectrum may indeed be superpositions of multiple modes.
In Figs. 4.4(a) and (b), a thicker layer is simulated, nm, and both the sensitivity and the FOM are larger, with nm/RIU. For both choices of layer thickness, the TE and TM modes are broad and overlapping in the case of a surrounding index of , and an extraction of the -factor using the FWHM approach will necessarily include contributions from both mode polarisations. This is a consequence of the fact that the -factors obtained from the spectrum include both intrinsic, non-radiative contributions from the geometry of the structure, and contributions from the relative coupling of the active layer to the modes. This makes it more difficult to separate nearby modes and define independent -factors, as illustrated in this analysis.
4.5 Broader capacity of the model
The development of a method for the modelling of whispering gallery modes in multilayer resonators represents an important tool for assessing the feasibility of a cell resonator. The model is able to handle an arbitrary number of concentric,

(a)

(b)
spherical dielectric layers, and extract the resonance positions from the characteristic equation, and the emitted power, to obtain the spectrum. Because of the attributes of the specific cells considered in the next chapter, these features provide the best chance of giving a reliable assessment of a cell’s ability to sustain resonances. While the focus of this thesis is to explore this possibility, first by developing the tools necessary for a systematic inquiry into the topic, including the functionalities required for this task, and then, by applying them to the search for a cell, the tools are able to contribute more widely to the field.
Various excitation scenarios that closely mirror the experimental techniques are included in the model, and the model is cast in a framework that is easily extendable to consider other excitation strategies, which is a vital step toward facilitating the design of novel resonator architectures. Improvements to stability issues inherent in the transfer-matrix approach have also been addressed. Furthermore, alongside the development of the model and its formulae for the power spectrum, an efficient numerical algorithm was also produced, which may be of interest to the scientific community by adapting it for use in other scenarios that require multilayered dielectric structures.
5The Search for a Cell
“But as soon as we touch the complex processes that go on in a living thing, be it plant or animal, we are at once forced to use the methods of this science. No longer will the microscope, the kymograph, the scalpel avail for the complete solution of the problem. For the further analysis of these phenomena which are in the flux and flow, the investigator must associate himself with those who have labored in the fields where molecules and atoms, rather than multicellular tissues or even unicellular organisms, are the units of study.”
J. J. Abel, “Experimental and Chemical Studies of the Blood with an
Appeal for More Extended Chemical Training for the Biological and Medical
Investigator. II”, pp. 176-177 (1915) [229].
The modelling methods developed in Chapters 2 through 4 are integrated with the experimental investigations and methodologies reported in Chapters 5 and 6 in order to obtain a complete multi-layered solution of the study of resonances within biological cells. Upon arriving at a robust understanding of resonator behaviour through the development of sophisticated models, the goal of determining the existence of a biological candidate that can function as a resonator comes within reach. This is an attractive prospect, since the discovery of biological resonators would allow the useful properties of whispering gallery modes, especially their sensing applications, to be applied in a new setting. By producing light directly at the site of inquiry, a new level of access to the properties of the cells themselves, and their immediate environments, can thus be obtained.
In the search for a cell resonator, one must first develop an understanding of precisely which physical qualities are required for resonances to be realised. Thus, in this chapter I seek to address a particular aspect of the vision of the project, as outlined in the Prologue, encapsulated by the question: ‘How imperfect can a resonator be?’. To make this research question more precise, the goal of this chapter is to develop an original set of selection criteria, which may be used to narrow the search for a prospective biological resonator, and provide guidance as to the maximum amount of deviation from an ideal resonator such a candidate can exhibit before modes can no longer be sustained at a measurable level.
5.1 Outline of the challenge
As a preliminary step towards classifying biological cells in terms of their viability as resonators, the challenges of this task are now outlined. First, the methods and tools available for the measurement of the physical qualities of a prospective biological resonator are documented, and their roles explained. A wide variety of physical qualities is considered with regard to their impact on the ability of a given cell to sustain WGMs. Second, various physical properties that could in principle affect the resonances are enumerated. The next step is to narrow the list of conceivable physical influences on the resonance behaviour to a few key measurable features, which distil what is required of a resonator into a checklist of selection criteria. This list can be used to assess the feasibility of a candidate biological resonator for both this project and future research activities embarking on a similar path.
Upon development of the selection criteria, a variety of candidate cells is analysed, and their likelihood of being able to support WGMs is subsequently assessed. This is an important exercise in the context of this thesis, because it not only demonstrates how the selection criteria should work in practice with real-life examples, but it also shows that a range of options has been considered in the event that the most viable candidate cells encounter challenges in sustaining WGMs that require more concerted research focus in future endeavours.
5.2 Resonator assessment methods and tools
The physical parameters of a cell can be quantified by the following methods and tools. Typically, the biological cells discussed herein exhibit some transparency in the visible spectrum. As a result, confocal microscopy and scanning electron microscope (SEM) imagery can resolve the geometric properties of the cell [230], such as the diameter and the relative membrane thicknesses. Accurate knowledge of the structure of the cell, and its approximate physical parameters, allows modelling-based methods described in Chapters 2 through 4 to make predictions for the refractive indices and other properties relating to the scattering signal. For example, calculating the dependence of the mode positions and -factors on the thickness of the outermost layer of a cell is particular suited to modelling-based approaches, while the absolute values of the -factors are known to be more difficult to estimate [168, 181, 198, 199].
The symmetry of cross sections of a candidate cell can be similarly measured using conventional microscopy. Although there are a variety of shapes of cell with at least one axis of symmetry, such as the biconcave (lozenge-shaped) erythrocyte [77], or animal red blood cell, the focus will primarily be on those of approximately spherical shape. The reason for this focus is that the majority of cells of the appropriate size for sustaining modes (see Section 5.3) exhibit a level of symmetry predominantly due to forces such as surface tension, which are applied isometrically to the outer surface of the cell, and as such, demonstrate no preferred orientation in the development of the cell.
In estimating the surface roughness of a resonator, the precision of conventional microscopy is generally insufficient, as it is limited to the scale of a micron [223], whereas it has been shown that the positions and -factors of the WGM modes in, for example, a microsphere, are sensitive to deformations in diameter down to the nanometre scale [231, 115]. Thus, atomic-force microscopy (AFM), in which the surface roughness is measured by a mechanical probe attached to a piezoelectric filament, represents a more suitable method for studying the surface properties of microscopic resonators [66].
The ‘stiffness’, or elasticity of the surface, presents an interesting challenge to resolving whether or not WGMs can be sustained. Conventional artificial resonators are typically constructed from substances that are highly unmalleable at room temperature, such as crystals [68, 69, 70, 71, 72, 34, 73], glass [16, 14, 66, 67], metal layers [162, 181, 232, 233, 234] and even certain types of polymers [74, 75, 76], as mentioned in Section 1.2. One benefit gained as a result of these choices is the subsequent minimisation of the distorting effects of a resonant wave on the geometry of the resonator, which could disrupt the path of the electromagnetic waves near the surface, leading to mode-splitting, and thus reducing the -factors [115, 118, 95]. However, the specific proteins from which cells are constructed differ widely in their mechanical properties [235], and depend on their chemical configuration. To what extent the surface elasticity affects the positions and behaviour of the modes has been studied in the field of cavity optomechanics [236, 237]. While it has been noted that the introduction of optomechanical behaviour in shell resonators yields acoustic modes with strong velocity dispersion characteristics causing deformations at the inner surface of the shell [238], the critical value beyond which WGMs can no longer be sustained has not been considered exhaustively in the literature. A study of the surface elasticity of a prospective cell will help to place bounds on the -factor anticipated for potential resonances present during passive or active excitation. It is reported that one can minimise the elasticity by selecting a cell at a specific stage in its development [235, 239], discussed in more detail in in Section 5.5 for the cells that form the primary focus of this thesis as most viable resonator candidate. Alternatively, the elasticity can be altered by placing the cell in a medium that exhibits chemical properties that alter the stiffness of the surface layer. Examples of such handling media and the reasons for this effect on the elasticity are studied in detail in Section 5.5.4, and their recipes included in Appendix D. The effect of the surrounding medium on the ability for a resonator to sustain WGMs forms the basis of the experiments described in Section 6.4.1.
The refractive index experienced by WGMs will also be determined by the specific protein, or mixture of proteins, that constitutes the outermost layers of the cell. Measuring the refractive index of a protein can be achieved by collecting a quantity of the protein and precisely measuring the angle of the transmitted light at a specific wavelength [240, 241, 220]. However, there is a practical limitation in collecting a sample of protein from a specific region of a cell in order to be able to carry out the measurement – the largest cell considered in this thesis is approximately microns in diameter, and other kinds of cells of near-spherical shape are up to two orders of magnitude smaller. More elaborate methods of measuring the refractive index have also been attempted, such as the use of two adjacent fibres to emit and collect light from a low-power white-light source, in conjunction with a micromanipulator holding-pipette to guide the cell into position [242, 243].
Refractive indices can potentially be measured using WGMs themselves. WGMs provide precise information about the structure of a resonator while simultaneously presenting an opportunity to observe the optical behaviour of a cell, for which extant information in the literature is limited. As an example, a high refractive index coupling prism can be used to tune the coupling condition required for generating WGMs, and the angle of incidence depends on the refractive index experienced by the WGMs, explained in Section 6.2.1. It is important to keep in mind that the proteins that comprise the layers of real-life cells may not be uniform, and that the value of the refractive index ultimately measured through the use of WGMs will likely be an averaged value, as the detection of modes requires multiple trips of the electromagnetic waves returning in phase within the cell, and any inhomogeneities in the refractive index will serve to broaden these modes and reduce the measured -factors.
In addition to the refractive index of the biological material itself, the confinement of radiation within the cell is dependent on its surrounding environment. The behaviour of the WGMs as a function of the surrounding refractive index is a measure of the sensitivity of the resonator, which in turn depends on the refractive index of the cell itself and its geometric attributes, as described in Chapter 1. Equally, a measurement of the sensitivity of a cell of known diameter and layer thickness can be used to estimate the refractive index of the cell. This technique is explored in Chapter 7, which describes the flow of a glycerol-water solution over the cell as WGMs are being measured. This increases the refractive index of the surrounding environment by a known amount.
The presence of contaminants in the surrounding medium can confer practical limitations to the experimental measurement of radiation modes within a cell. Detritus and dust that accumulates within a droplet of medium can interfere with or damage delicate apparatus such as fibre tapers. These contaminants must be removed, minimised, or their effects taken into account without compromising the other physical properties of the cell, in order to optimise achieving WGMs.
The generation of WGMs and values of their -factors are, of course, dependent on the excitation strategy used. For a given method, it is possible to tune the coupling efficiency in order to improve the -factors and the clarity of the modes in the spectrum. Prism coupling [78] introduces a reusable method for testing cell candidates, as the prism and laser setup does not require realignment after each test. This method is mode selective, and the coupling condition is extremely sensitive to both the exact placement of the laser spot on the surface of the prism and the distance of the cell above the prism. Coupling into a specific mode can therefore become a challenging procedure, especially for a resonator with geometric parameters that are not well known prior to mode coupling. Furthermore, the spot size of the laser must be constrained so that the propagation constant is phase-matched at the boundary of the prism, as described in Eq.( 2.38) of Section 2.2, in order to achieve tunnelling into the resonator. Since laser spot diameters below m become difficult to collimate, relaxing the requirement of beam collimation becomes mandatory; however, it poses an additional difficulty in the placement of bulky detectors in a confined region around the resonator. As an alternative, one may use free-space optics to stimulate autofluorescence of the cell [22], fluorescent emission of incorporated nanoparticles [87, 39, 88], or an active material coating [94]. Such active resonators typically exhibit lower -factors than those expected using passive interrogation, as discussed in Sec 1.2.2, but in return, they provide some distinct practical advantages. In the specific case of free-floating resonators, such as microspheres or cells, these advantages include the fact that the coating of fluorescence emitters can be prepared prior to the experimental measurement, and requires no special alignment in order to generate WGMs. Each of these methods is applied in Chapter 6 in order to build a picture of the viability of the chosen cell candidate as a biological resonator.
The coupling efficiency of the prism may be tuned by altering both the spot size of the beam on the upper surface of the prism, and the angle of incidence of the incoming beam, so that the propagation constant near the surface of the prism matches those of the WGMs near the interface of the resonator and prism, fulfilling the condition in Eq. (2.38) of Section 2.2. This process achieves the phase-matching condition necessary for the experiments reported in Section 6.2.1.
Optical waveguides [35, 80] or fibre tapers [47, 81, 82, 118] provide coupling to a range of modes for sufficiently small waveguide or taper waists that ensure phase matching at the resonator boundary. While alterations to the taper during measurement are impractical, this is effectively achieved by tuning the distance of the taper to the resonator until they are phase-matched, as demonstrated in Section 6.2.2. Fibre tapers have been shown to lead to particularly high -factors relative to other mode coupling methods [83, 244, 118, 245], since placement of the taper tangentially in the vicinity of the resonator allows radiation from WGMs along a single axis of revolution to be isolated, as illustrated in Fig. 1.3 of Chapter 1. However, the manufacturing process of the tapers is time-consuming, and being fragile, their longevity is somewhat limited, and thus present practical restrictions on testing a large number of candidate cell resonators.
In the case of an active layer coating, there is little control over the phase-matching condition. A layer of fluorophores will encompass a range of different orientations so that the excitation occurs at all points on the resonator uniformly. While a simple free-space power collection will not be able to isolate modes from a single axis of symmetry, it is nevertheless possible to use excitation and collection methods in combination, such as a resonator including an active coating that is excited, with power collected via a fibre taper.
The absorption and scattering of light by a resonator represent crucial limiting factors that must be taken into account in the determination of a candidate cell resonator. For an amount of energy either transmitted or incident upon a surface, the radiant flux is defined as . The absorbance, a dimensionless quantity, denoted , can be defined in terms of the ratio of the radiant flux transmitted through a surface () to radiant flux received by a surface () [246]
| (5.1) |
can be measured using an ultraviolet–visible–near-infrared (UV–Vis–NIR) spectrophotometer, making use of the Beer-Lambert Law
| (5.2) |
for a mixture of protein types with molar attenuation coefficients of , and concentrations of along a path length . The attenuation coefficients, , represent an intrinsic property of a given chemical species, with SI units of cross sectional area per mole. The concentrations are defined in terms of moles of solute per unit volume. While contemporary developments in the measurement of the properties of biological tissue have yielded interesting behaviour in the UV region [247, 248, 249], DNA, and its constituent proteins, are strongly absorbing in the UV [250, 251]. In the context of this investigation, one consequence of this absorbance profile is the difficulty in sustaining WGMs in this wavelength range. While two-photon fluorescence microscopy has been used to determine architectural features of cells, particularly for photosensitive varieties such as mammalian embryos [252], the existence of underlying modes within such cells and their spectroscopic properties remains uncharted territory.
Scattering, on the other hand, can be related back to the surface roughness of the resonator. Both the scattered and transmitted light can be measured using the prism coupler technique, described in more detail in Section 6.2.1, and this simultaneous measurement provides critical real-time information on how the cell is behaving as a resonator. If the transmitted signal is very weak, it indicates that the cell is absorbing or scattering the light to a high degree. Careful monitoring of the collection of the scattered light thus serves to identify the source of the low transmission, and possible causes for poor resonator performance such as unoptimised coupling, the presence of surface defects, or contamination of the surrounding medium.
Mie scattering models have long been used to estimate scattering effects [253], and more recently, FDTD has been applied to assess the general properties of free-floating cells [254, 255]. Other methods that have been used in the literature to consider scattering effects in cells include Fourier Transform Light Scattering (FTLS) [256] and Fourier Transform Infrared (FTIR) Spectroscopy [257]. While power spectra associated with scattering from mammalian oocytes have been reported in the literature [258], they are typically adopted for medical imaging of tissue. Studies that explore coupling methods for generating resonances, such as WGMs, within cells such as oocytes are practically nonexistent. With the aid of the sophisticated modelling tools developed in Chapters 2 and 4, and the non-destructive method for the determination of the geometric parameters of a resonator developed in Chapter 3, the work in this thesis is ideally poised to address the problem of matching the theoretical predictions of scattered spectra with experimental results.
The physical parameters described above represent the main features to be investigated in the search for a cell resonator. Now that these parameters and their methods of measurement have been enumerated, the specific selection criteria for a candidate cell resonator, which has been narrowed down to seven key requirements, can be summarised.
5.3 Selection criteria
In this section, the key selection criteria are stated and explained based on
the properties required of a resonator, as well as the range of complexities
introduced by biological material that can serve to frustrate, enhance or
otherwise modify these properties.
Criterion 1. Size and index contrast: The ability of a resonator to sustain modes depends on the relative values of the size and refractive index contrast, as introduced in Section 3.2.3. The relationship between size and index contrast has been well studied [115]. A large refractive index contrast will typically allow higher order modes to be sustained [157], and the same is true for large diameter resonators [109]. The two are not directly equivalent, however, and an increase in size with a corresponding proportional decrease in index contrast does not result in an identical mode pattern. This is illustrated in Fig. 5.1, where the emitted power from a microsphere in water is plotted for a range of diameters and refractive indices , such that the quantity remains constant. The diameter and index values chosen in this example correspond closely to those of the most likely cell candidate described in Section 5.5. This effect is a consequence of the mathematical form of the emitted power formulae of Eqs. (4.56) and (4.57), derived from the matrix elements of Eq. (4.39), which are functions of size parameters , and . While the spectrum remains unaltered in the case where the length scale is held constant, changes in and such that remains constant will still result in a different value of , unless the index of the surrounding medium, , is also altered by the same proportional factor.

Of particular interest is the limiting case of the minimum viable size for a typical range of refractive indices, which for cells is generally dependent on the optical properties of the proteins that constitute them. A conservative estimate for these proteins suggests the range to be to , with some proteins approaching [220]. These estimates are important for the discussion of glycoprotein layers in Section 5.5.2. For example, using a nominal criterion that the -factor must be greater than to be adequately detected, the minimum viable diameter for these lower and upper values of the index are calculated from the multilayer model of Chapter 4 to be m and m, respectively. Note that analytic models typically overestimate the measurable -factors [168, 181], and that without the inclusion of surface roughness [85] or asphericity [118] it is difficult to match the -factors derived from models with those obtained experimentally [198, 199]. As a result, it is important to note that the minimum viable diameters obtained from the multilayer model are conservative, and realistically, it is expected that diameters should be substantially larger than the minimum values calculated below for the adequate detection of WGMs experimentally.
The spectra derived from the two limiting cases from the multilayer model,
m and m, are shown in Fig. 5.2,
as estimated from the central modes of TE/TM471,0 and TE97,0,
respectively. Note that, in the former case, the resonance envelope contains
contributions from nearby overlapping TE and TM modes of the same azimuthal
order.
In both of these plots, the wavelength window is chosen to coincide with
nm, for consistency with the distributed feedback (DFB) laser used
for the experiments described in Chapter 6.
Note that in the case of Fig. 5.2(a), the lower refractive index
contrast leads to a mode with a relatively small fluctuation in the emitted
power. This is a consequence of the fact that a low index
contrast impacts strongly on the ability to detect modes. While it is possible
to resolve such small power fluctuations, the purpose of this exercise is
simply to establish the extreme limits from the -factor derived from the
multilayer model.
It is clear that the minimum
viable diameter varies widely for this range of possible index values. To
ensure the best possible chance of selecting a viable cell resonator
candidate, without knowing the specific value of the refractive index in
advance, the diameter must be larger than the value of m.
Criterion 2. Sphericity: Deformations of the resonator that impact upon the sphericity have been shown to have an effect on the -factors of the WGMs [259, 260, 118]. According to one study, FDTD simulations of a prolate polystyrene resonator excited by an incident beam exhibit a decrease in -factor that is roughly proportional to the ellipticity of the resonator (measured in terms of its aspect ratio) [260]. In the case of microspheres with only small asphericities, it is useful to incorporate this limiting factor into the -factor by adding an elliptical contribution, , in parallel, as in Eq. (2.44). While this poses a potential difficulty in sourcing a resonator that is

(a)

(b)
sufficiently spherical to sustain modes, there is a number of
techniques that can serve to mitigate this effect. In particular, excitation
of WGMs preferentially along one equatorial plane
can minimise the contributions from the
different path lengths experienced by the internal fields that
contribute to mode-splitting and mode-broadening, as described in
Section 2.2.3. This may be achieved using fibre taper couplers,
which are able to isolate a single axis of revolution of a resonator in order
to achieve higher -factors and coupling efficiencies
[118, 83, 244], as mentioned in Section 5.2.
This represents an attractive feature of
fibre tapers, particularly when considering resonators that are
unlikely to exhibit a perfectly spherical shape, such as biological many cells.
Criterion 3. Surface roughness: It has been shown that
the -factors of WGMs are extremely sensitive to surface roughness
[231, 115], with deviations down to the scale of a single
nanometre significantly affecting the wavelength positions of the modes
[66]. A study of the behaviour of the WGMs within a microdisk cavity
has demonstrated a reduction of the normally high -factors by several
orders of magnitude for an edge roughness of less than
[231]. This makes the
isolation of any one single mode potentially difficult task, placing additional
burden upon this criterion as an important selection characteristic
to be addressed for the range of cells considered in Section 5.4.
Criterion 4. Elasticity: The mechanical properties of
resonators, particularly of the surface or outermost layer, can affect its
ability to support WGMs for the following reasons.
Bound states of radiation located near the surface of a resonator will
tend to dissipate heat and cause
mechanical stress. The fluctuations in the power corresponding to the modes
thus introduce perturbations that are capable of disrupting the path travelled
by the bound waves, especially for malleable materials. This can lead to
shorter ring-down times, shifts in the wavelength positions of the modes
[107] or even total mode loss, which may occur sooner than
anticipated compared to a rigid resonator, as explained in
Section 5.2.
It is therefore important to consider the mechanical properties of biological
cells, and in particular, the protein structures that form the outer layers of
the viable cell candidates. This will be discussed in Section 5.5.
Criterion 5. Osmolarity: The total concentration of soluble particles, or osmolarity of the surrounding medium, affects the ability to measure WGMs in a resonator. Lasers can serve to ionise the salts in the solution, which can accumulate on the surface and compound the contamination of the medium. This effect is particularly detrimental to the functioning of fibre tapers. While this issue can be alleviated by reducing the laser power, the binding of non-soluble particles to a fibre taper can contribute a non-specific background signal as well as lowering the overall transmission through the taper, making the detection of WGM signals more challenging [261]. This is particularly important when considering the cells described in Section 5.5, since the media used to store the cells typically contain certain quantities of salts (see Appendix D), and even a relatively small osmolarity ( mOsm) can serve to hamper measurement. Furthermore, in small volumes of liquid medium, the heat caused by the energy from the laser will eventually evaporate the liquid, occurring within minutes for large power outputs such as those above mW. As a result, the increased concentration and subsequent crystallisation of residual salt within the medium can cause physical damage to the cell and to a fragile coupler such as a taper. Before performing a measurement, it is vital to ensure that the medium is as dilute as possible without indirectly altering the morphology of the cells. This is handled on a case-by-case basis, as the chemical composition of media can differ widely, as shown in Appendix D. In the specific case of the most viable cell candidate, the methods outlined for handling this effect are described in Sections 5.5.4 and 5.7.
As an additional point, it is interesting to note that the chemical
composition of the surrounding medium chosen for a specific biological cell
can affect the elastic properties of its outermost layer, such as in the case
of the bovine oocyte [262].
Criterion 6. Excitation method: The successful
measurement of WGMs is intimately connected to the method of introducing
radiation into the resonator. As has been explained in the case of the fibre
taper in Criterion 2, one may isolate specific
resonances, or classes of resonances (such as those stemming from a single
axis of symmetry), by carefully choosing an appropriate coupling method.
As an example, the approximate -factors for the fundamental modes in silica
microspheres, in a surrounding medium of air, have been quantified as a
function of diameter [78]. In the case of a diameter within
a broad range of to micron, noting that the cells considered as
optimal candidates in Section 5.5 fall within this range,
it is expected that waveguide
couplers lead to -factors of less than . Prism couplers, on the other
hand, are expected to provide -factors in excess of . Finally, tapers
are potentially able to access the highest -factors, in excess of
for resonators of this size.
Using the phase-matching methods described in Section 5.2,
the prism coupler, taper coupler, and fluorescent coating methods are
explored in Chapter 6 in order to assess the ability of a cell
to sustain WGMs.
Criterion 7. Loss (absorption and scattering): It is known that some biological cells exhibit changes in their electrical capacitance from absorption of light in the IR spectrum [263] due to the fact that water, which dominates the spectral behaviour of the surrounding medium, is highly absorbing in this region, generating heat that can affect the cells. It is also known that the DNA in cells is strongly absorbing in the UV spectrum [250, 251]. As a result, the visible and NIR regions represent the optimal windows for achieving resonance.
Both scattering and absorption directly affect the -factor, as is evident in the first two terms on the right hand side of Eq. (2.44). Clearly, absorption of energy due to material properties will prevent electromagnetic radiation from circulating continually, thus preventing clear modes from being observed. In this case, the challenge is to achieve a sufficient signal-to-noise ratio in the spectra for determining the presence of modes. Similarly, if the surface properties of a given cell allow scattering effects to dominate, any underlying WGM spectrum will be difficult to measure.
5.4 Candidate cells
In this section, a range of candidate cells is explored, and their
suitabilities as resonators are assessed using the newly-developed
selection criteria. Upon selecting a candidate cell, the refractive
index and size are estimated, since it is this criterion to which it
is most difficult to make significant alterations. If such kinds of cells
lie in the viable range of geometric parameters established in
Fig. 5.2,
then the surface properties are subsequently considered. As will be seen,
careful consideration of surface effects is critical. However, it is not
always straightforward to be able to assess in advance whether surface
deformations will prevent the observation of WGMs.
The type of medium used to store or handle the cells can also play
a pivotal role in facilitating or preventing the generation of modes,
through contaminants, high salt content and effects on the surface
properties of the cells themselves.
While it is important to establish that a number of
candidates has been considered carefully, the purpose of this section
is to identify the most viable candidate, which is then used for a more
in-depth study in Chapter 6 using the techniques described in
Section 5.2.
Erythrocytes: The first cell considered in this thesis
is the animal red blood cell, which resembles a biconcave disk, depicted in
Fig. 5.3(a).
One particularly attractive feature of this cell is the disk shape, which
could potentially assist in constraining the modes to a more limited geometric
orientation, leading to increased -factors [2, 47].
Considering Criterion 1, erythrocytes have diameters of the order of
to micron – approximately the size of the smallest resonators
considered in Chapters 2 and 3 [77].
Cells within this range of diameters are unlikely to be able to support
modes, since in order to do so, the refractive index must be sufficiently
large, as determined by the material properties of the cells.
It is found that erythrocytes are composed of a
combination of proteins and lipids, with a refractive index in the range
to [264, 265, 266].
The limiting values estimated in Fig. 5.2 indicate that an
erythrocyte would require a diameter approximately one order of magnitude
larger in order to sustain modes, and thus cannot be considered a viable
biological resonator. It should be noted, however,
that while this choice of cell will not become the basis of study in this
thesis, it should not be ruled out for future technological developments that
may be able to overcome the limitations of the diameter.


(a) (b) (c)
Cryptosporidium oocysts: The next cell to be
examined is that of Cryptosporidium. This eukaryotic cell, while
hazardous to humans [267], forms a distinctly spherical oocyst,
as illustrated in Fig. 5.3(b). The size of the oocyst varies
depending on the species of Cryptosporidium. For example,
C. parvum, a smaller variety, is reported with planar dimensions of
m. The ratio of the major and minor axes
corresponds to a shape index
(or shape factor) of . On the other hand,
C. muris, a slightly larger but less symmetrical variety is reported
to have dimensions of m, corresponding to a shape index
of [268]. As with the erythrocite, an application of
Criterion 1 indicates that these cells are too small to be likely to
sustain WGMs given the range of refractive indices exhibited by proteins
[220]. While the range of sizes provides some indication that
genetic variations in certain cells can provide increased diameter values,
in this case, the asymmetry increases with size, limiting the opportunity for
investigation into resonance behaviour. However, in other cases, it is indeed
possible to genetically modify cells so that they are less limited in size
[269].
One particular example of such a cell, which is both commonly used and
relatively straightforward to source, is yeast.
Genetically modified yeast: The eukaryotic fungus known as yeast, of the species Saccharomyces cerevisiae, is both widely available, and reasonably well understood genetically compared to other cells [269]. In cell biology, cells that exhibit one complete set of chromosomes are called haploids, whereas those that incorporate two complete sets of chromosomes are known as diploids. Diploid yeast cells can exhibit twice the cell volume of haploids [270]. Furthermore, it is possible to cultivate particularly large yeast cells by altering their genetic makeup, typically through gene deletions [269]. These modified cells are usually labelled, by convention, with the gene that has been deleted. For example, the strains that have had the genes deleted that express (denoted ) or (denoted ) are described in Ref. [269]. As an example, the strain has a median cell volume of m3. Of these strains, the one that is able to produce the largest and most spherical cell type, with diameters of the order of m is known as .
Figure 5.3(c) shows an image of the strain, with each
square marked on the scale as m in length. While cells of the order
of to m in diameter are still relatively small for the purposes
of sustaining modes according to Criterion 1, the upper diameter
values are close to the minimum limiting diameter considered in
Fig. 5.2 so long as the refractive index is sufficiently large
[220]. While this cell is not optimal, it is worth investigating
its other properties with respect to the selection criteria. While several of
the cells are near spherical, satisfying Criterion 2, it is
difficult in general to gauge the surface attributes,
Criteria 3 and 4; these will often represent the last criteria to be
considered in each case of cell. The media, excitation and loss properties
(Criteria 5 through 7), however, are more easily examined.
First, the absorption properties of these cells are considered.
Method: The yeast are streaked onto agar plates,
grown for a period of to days and stored at C with the plates
inverted. Each of the three strains, , and
is cultivated in standard, non-selective yeast media (YEPD), described
in Appendix D, and placed into aliquots. While this medium
contains quantities of proteins, glucose/dextrose and yeast extract, little
quantities of salt are present (which would impede the growth of yeast),
nominally satisfying Criterion 5.
An initial concentration of cells in media corresponding to a haemocytometer
reading of cells/mL is used. Next, a hypodermic
syringe and fine needle is used to agitate and distribute the cell
constituents throughout a medium of water.
The debris is removed via a centrifuge, and the remaining supernatant liquid
is then diluted to a concentration of and re-centrifuged.
The spectra corresponding to each stage of the process are shown in
Fig. 5.4(a), as measured from solutions placed in mL cuvettes,
by a UV–Vis–NIR spectrophotometer. The absorbance spectra of water is
subtracted from these results.
Acetone is not used in this case to assist the
solvency,
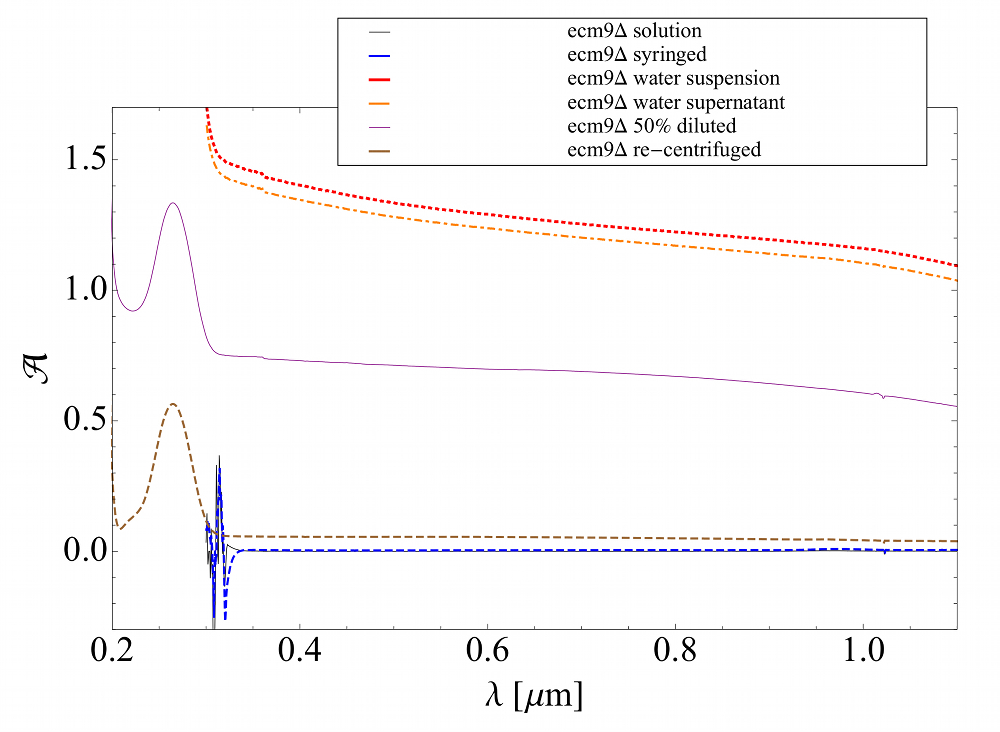
(a)

(b)
as it can cause a proportion of the starches and sugars to precipitate, leaving only DNA and protein. The absorbance of the resultant solution is measured using a spectrophotometer, shown in Fig. 5.4, and corresponding to Criterion 7. Figures 5.4(a) and 5.4(b) show that the DNA is nevertheless the dominant source of absorbance, with the principal peak occurring at nm, while there is little discernible effect in the visible region. The ribosome content, given by the ratio of the absorbance at nm to that at nm, [271], leads to a value of . Based on the known results for DNA for the quantity , as described in Ref. [271], this result indicates that the solution consists primarily of DNA. Thus, any absorbance from sugars and starches left in the solution have a negligible effect on the absorbance compared to that of the DNA. As a result, the absorbance spectrum indicates that the choice of wavelength in this case is not strongly constrained, offering scope for the generation of WGMs.
Finally, the excitation and scattering behaviour of
Criteria 6 and 7,
are considered by applying a fibre taper placed above a glass coverslip on an
inverted confocal microscope, similar to the setup illustrated in
Fig. 3.6. A droplet of water is placed on top of the fibre taper to
prevent breakage due to surface tension effects. The droplet is then
inoculated with yeast cells of the strain. It is found that the yeast
cells do not interact with the fibre taper, nor produce any measurable
autofluorescence. The reason for this is that the coupling of light into a
resonator from a fibre taper is extremely sensitive to the phase-matching
condition of Eq. (2.38),
determined by the diameter of the taper waist, and the distance of
the taper to the resonator. For cells of this diameter, approximately
m, a taper waist of
m is insufficient to achieve such a coupling. While the evanescent
field of a thin taper extends further into the surrounding medium, it renders
the taper extremely sensitive to contamination from dust, detritus or
biological matter introduced into the droplet. As a result, it is unlikely
that these cells represent a pathway toward a biological cell resonator that
can be easily achieved at this time.
Eudorina-Pandorina algae: The next cell to be considered is a much larger variety of eukaryota, from the family Volvocaceae. These varieties of algae are known for their symmetrical geometric shapes, through conglomerations of cells into microspheres significantly larger in diameter than the aforementioned candidates, as well as macroscopic structures formed by the conglomerates themselves. Note that each structure can also be surrounded by a faint, translucent layer, roughly spherical in shape. Examples of these formations are displayed in Fig. 5.5 for the Eudorina-Pandorina genus. Figures 5.5(a) and (b) depict examples of the structures and meta-structures formed by the algae. An image of an algal microsphere placed within the evanescent field of a fibre taper, with a waist diameter of m, and using a wavelength of approximately nm, is shown in Fig. 5.5(c) producing significant autofluorescence.
Considering Criterion 1, an analysis of the geometric properties from a sample of algae (full results shown in Appendix D) indicates a mean value of the equivalent circle diameter of m, and a mean aspect ratio of . Note that the maximum value of the equivalent circle diameter is over m, which is a useful feature given that the refractive index of algal cells exceeds that of water by a factor of no more than [272]. In the case of Criterion 2, the mean sphericity is measured to be ; however, for some algal particles, the sphericity is as high as . Finding an optimal combination of size and sphericity is achievable given the large quantity of algae available. It is these large spherical cell conglomerates that are selected preferentially for experiment.
The Eudorina-Pandorina variant are successfully cultivated in a medium known as MLA, the recipe for which can be found in Ref. [273], reproduced in Appendix D. While this media stock requires a range of salts and micronutrients, they are in relatively small quantities, and the resultant medium is very dilute from the point of view of the WGM coupling apparatus, such as the prism coupler or the fibre taper, thus providing little concern regarding Criterion 5.


(a) (b) (c)
Considering the absorption properties, Criterion 7, for these algae, the conglomerates are relatively bulky compared to the other cells examined thus far, and a sample of algal cells suspended in MLA (which has a refractive index close to that of water) is unlikely to be homogeneous. A measurement of the absorbance of this mixture yields a relatively smooth spectrum, increasing towards the UV region. This is due to the scattering of the light from the cells, which serves to broaden the peaks that would correspond to the algae, as shown in Fig. 5.6(a) for a number of dilutions. Note that the absorbance spectra of the MLA medium alone is subtracted from these results. Since the goal is not to activate a solution of many cells to explore the possibility of generating WGMs, but rather, to activate a single cell with a laser and mode coupler, it is the properties of the contents of the algae cells themselves that must be examined as follows.
Method: First, samples of the algae solution with a volume of mL are centrifuged into pellets. Then the pellets are dissolved and combined in acetone in order to break down the biological material into a translucent, homogeneous fluid. Two pellets are added per mL of acetone, thus doubling the concentration. This solution is then agitated using a weighted test tube designed to distribute the constituents within the cells throughout the solution and remove the resulting debris. The translucent
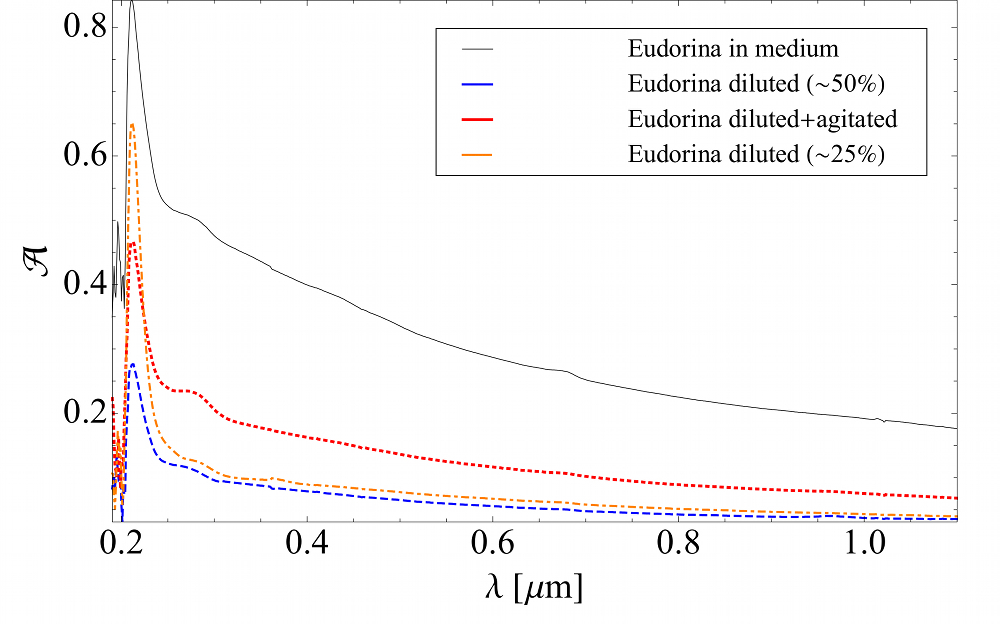
(a)

(b)
solution is measured against a background of buffered acetone. As a result, the constituent chemicals of the algae are more homogeneously distributed through the media.
The absorbance spectrum now contains much clearer peaks, as shown in
Fig. 5.6(b) for a number of dilutions, with the dominant spectral
peaks originating from chlorophyll shown as vertical dotted lines. In
particular, the absorption peak at nm is known to originate from
chlorophyll [274]. While not all algae display identical spectra,
the shape is similar to Fig. 8 in Ref. [275]. Note that the absorbance
becomes difficult to measure in the UV region due to the DNA present in the
sample. It is clear that within the visible region, particularly for
wavelengths between and nm, the absorbance is relatively
low, and thus this region is the most optimal for attempting to generate WGMs.
While the Eudorina-Pandorina algae represent an initially
promising direction in the search for a cell resonator, the difficulty with
sustaining modes stems from Criterion 3. While the groups of algal
cells are predominantly round, the surface roughness and defects are
significant – approximately half the diameter of a single daughter colony
within the conglomerate – m. However, some colonies are much
more compact with reduced surface roughness, as shown in Fig. D.1
of Appendix D.
Recalling that modes of microspheres are sensitive to surface
roughness at the nanometre scale [231, 115], it is thus
difficult to obtain resonant behaviour of light returning in phase for any more
than an extremely limited number of round-trips.
Volvox algae: This algae is a relative of the
Eudorina-Pandorina variety, in the same family
Volvocaceae. What distinguishes this algae from its relatives is its
propensity to form approximately-spherical macroscopic colonies up to a
millimetre in diameter, constructed from large numbers of algal cell
conglomerates. While this potentially provides scope to explore the resonance
properties of these structures, the multicellular roughness is of a similar
magnitude to that of Eudorina-Pandorina, limiting the
likelihood that modes could be sustained, according to Criterion 3.
Other studies on WGMs in biological cells: Competing studies in the literature on cell based WGMs include the placement of cells expressing green fluorescent protein (GFP) within a cavity, with the modes excited by the emission from the GFP within the cell. Lipid droplet based lasers have also been reported in Ref. [114], in which spherical droplets of oil or natural lipids within porcine adipocyte cells are able to sustain WGMs. Alternatively, free-floating beads of polystyrene [107, 114] or GFP coated BaTiO3 [276] have been inserted into living cells or allowed to be engulfed by phagocytes for the purposes of tagging and tracking. Of these studies, the closest counterpart to the research presented in this thesis is that of the Harvard-MIT group’s porcine adipocyte based lasers, which demonstrate the fact that WGMs can be sustained within naturally occurring subcutaneous fatty cells. Adipocyte cells contain a single lipid droplet () that exhibits a high degree of spherical symmetry, and it is this droplet that is reported to act as an optical cavity with a sufficient refractive index contrast between the droplet and the surrounding tissue. The adipocytes were treated with a lipophilic dye (Nile red) and collagenase in order to release them from the surrounding subcutaneous tissue and to induce lasing in situ. This experiment is of relevance to the present study, as it represents the first example of WGMs reported as sustainable within a completely natural cavity within a biological cell. While the focus on cells containing lipid droplets limits the ability to extend the study to a range of other cells, it nevertheless demonstrates an important validation for the concept of a naturally occurring optical cavity in nature.
Recalling the formulation of the project in Section 1.4, the
ability for a biological cell to act as a resonator without the introduction
of an artificial cavity is of particular interest conceptually.
The development of a sensing modality for providing information of the internal
structure of an untampered cell is not only complementary to existing
label-free
technologies [20, 21, 22, 23, 24, 25, 26]
but has potentially
broad implications on health sciences. A sensing modality based on
cells that can sustain WGMs on their own may also avoid the immune responses
of an organism from the introduction of foreign materials.
Mammalian oocytes: The final cell to be considered in this thesis is the mammalian oocyte. A variety of types of oocyte will be studied, and how each of the selection criteria are addressed will be examined in detail and expanded upon in the next section. The reasons for this particular kind of cell being an attractive choice are manifold. First, they exhibit significant diameter values of the order of m (depending on species). Second, the life cycle of an oocyte, particularly after fertilisation, has been well studied in the health literature. As a result, there is some indication as to the surface roughness and elastic properties of the outer layers, which depend on the stage of the fertilised oocyte, or embryo. Finally, measuring the resonant properties of embryos presents a major opportunity to make an impact on health sciences in the future. As WGM sensing technologies are developed, the ability to characterise the status of an embryo through WGM interrogation comes within reach.
5.5 Oocyte and embryo structure
The structure of an oocyte can be divided into the following regions, as illustrated in Fig. 5.7. The primary regions are known as the nucleus, where the majority of the oocyte DNA is stored, the cytoplasm, the mitochondria, and the zona pellucida, which is of particular importance in this work. Unfertilised oocytes may also be surrounded by cumulus cells, known as the corona radiata when adjacent to the zona pellucida, which are critically involved in the fertilisation process, and dissipate shortly afterwards. An oocyte surrounded by cumulus cells is known as a cumulus-oocyte complex (COC), and if the cumulus cells are removed, it is called denuded.
While the biological functions of these regions is a rich and complex subject, this thesis seeks to explore the physical properties of the oocyte, and in particular, its ability to sustain electromagnetic resonances. Optical attributes of oocytes, such as the refractive index, have not been comprehensively studied in the literature, and as a result, this work represents a pioneering attempt to characterise some of the properties necessary for a biological cell to exhibit WGMs. Thus, to begin, the potential influence of each of the regions of an oocyte on the generation of WGMs

will be studied.
Recall that the behaviour of the modes of a layered resonator is highly dependent on the properties of the outermost layer, as demonstrated in in Chapters 3 and 4. This is because of the fact that the fundamental radial modes are confined to the surface of the resonator. If the outer layer becomes sufficiently thick, for a given refractive index and outer diameter, the mode behaviour becomes insensitive to further increases in the layer thickness, as described in the case study of fluorescent microbubbles in Section 3.3. As a result, the structure of the cytoplasm, which lies within the zona region, has less influence on the structure of any modes confined within the zona. For this reason, more attention is paid to the physical properties of the zona for the purposes of optical resonance. The structure of the zona pellucida will now be considered.
The zona pellucida, illustrated in Fig. 5.7, is a semi-transparent coating that surrounds mammalian oocytes and embryos, which allows for communication among oocytes, follicle cells and sperm, as well as providing mechanical protection during embryo development [277]. In embryology, the zona pellucida is of particular interest because of its role in regulating the interactions of the oocyte with its surrounding environment [278], especially at the moment of fertilisation from free-floating sperm, which represents a rich area of ongoing research [279].
The zona comprises an extracellular matrix that consists of a mixture of glycoproteins [278], and is held together in long, interconnected fibrils by non-covalent interactions. These proteins involve sugar groups (certain oligosaccharides known as glycans) attached to the constituent molecules, which affect their molecular weights [280]. A simplified molecular structure of a nitrogen(N)-linked glycosylation, or attachment of the glycan to a nitrogen atom, is shown in Fig. 5.8. The molecular weights vary across a significant range, from to kilodalton (kDa), depending on the protein type, and species to which it belongs [280]. The glycoproteins are not laid down in uniform layers, but are intermixed with varying relative densities at different points in the zona, as illustrated in Section 5.5. The reduction of the more bulky protein structures yields a more compacted mechanical structure, which not only increases the refractive index [220] (Criterion 1), but also leads to reduced surface roughness (Criterion 3) and elasticity [235]. One interesting phenomenon in the development of mammalian oocytes is that the elastic and surface properties change after fertilisation. This is an important feature of the current work. In the case of bovine oocytes, AFM reveals the greatest density of networked glycoproteins, the most significant zona hardening, and the minimum surface roughness all occurring immediately after fertilisation [235]. Similar mechanical changes have been observed recently in murine and human oocytes [239]. For these reasons, the majority of the cell experiments presented in Chapter 6 will involve presumptive zygotes, that is, oocytes that have undergone fertilisation, and are subsequently either placed in a fixing solution or otherwise immediately tested at this phase of their development.

In the case of murine oocytes, the proteins are labelled in descending order of molecular weight: (m)ZP ( kDa), (m)ZP ( kDa) and (m)ZP ( kDa) [280]. In the case of other mammalian oocytes, such as those of bovine, porcine and human, a fourth protein of intermediate weight is present, ZP [282]. The molecular weights of these proteins differ from species to species, and each protein functions differently with regard to fertilisation [282]. For the purposes of the experiments described in Chapter 6, it is important to note that, while all available glycoproteins are present throughout the zona, the distribution of the proteins within the zona region is inhomogeneous [283]. For example, a greater proportion of the protein ZP is found near the outer boundary of the zona, since it is the protein that is predominantly involved in binding to sperm [284]. Furthermore, it has been well documented that the distribution of proteins is highly dependent on the stage of fertilisation [285, 286]. Therefore, it will become important to choose an oocyte or embryo from a stage in the fertilisation process that presents the best opportunity for sustaining WGMs. It is possible that this distribution of proteins results in a refractive index gradient that would serve to broaden the higher order radial modes, which extend further into the zona region. While the optical properties of these proteins, especially in intact oocytes, is not well understood, the intention of this investigation is to elucidate how the physical parameters can affect the generation of WGMs.
5.5.1 Size and topology
At the most basic level, the range of diameters exhibited by mammalian oocytes satisfies Criterion 1. In the case of bovine oocytes, it is reported in the literature that the outer diameters (including the zona regions) take values to m [287], with a variation of %. The thickness of the zona itself takes values to m [287]. In this study, measurements taken for the bovine oocytes used in this project yield smaller mean outer diameter values of m, that is, with a variation of %. Excluding the zona region, the diameter is consistently in the range to m, in agreement with the literature [288]. Figure 5.9 shows examples of bovine embryos in Figs. 5.9(a) and (b), and a scale image of a presumptive zygote, a fertilised embryo that remains undeveloped, which has been chemically fixed, in Fig.5.10(c).
A similar study is conducted on murine embryos, as shown in Fig. 5.10. The images shown in Figs. 5.10(a) through (c) correspond to the autofluorescence captured from a single murine embryo using a confocal microscope, for two channels ( nm and nm), as well as a merged image of both channels and a phase-contrast image. The scale image in Fig. 5.10(d) indicates an outer diameter of m. The sphericity appears optimal for biological cells, particularly for the bovine samples, nominally satisfying Criterion 2. The effect of autofluorescence in oocytes and embryos will be discussed in more detail in Section 5.5.5.


(a) (b) (c)


(a) (b) (c) (d)
While the refractive index values of the glyocoproteins that comprise the zona layers have not been clearly characterised in the literature, as discussed in the next section, a comparison of these diameter values with the limiting results of Fig. 5.2 indicate that the bovine oocytes and embryos are in the suitable region for sustaining WGMs according to Criterion 1.
5.5.2 Glycoprotein refractive index
While the refractive index does not represent a property that is typically of immediate interest to practitioners in the field of embryology or cell biology, several measurements have been reported in the context of determining the optimal fertilisation time using optical microsystems [242, 243]. The refractive indices in this case are measured by collecting the transmission spectra from two adjacent fibres, one of which is connected to a low-power white-light source, in close proximity to an oocyte. The values obtained from this method vary widely depending on the stage of fertilisation, from to , with statistical uncertainties ranging from to . The index values above are, however, unrealistically high for organic matter, which does not exhibit any high-index crystalline structural properties that would be expected for refractive indices of this magnitude. This study represents one of the only attempts to obtain the refractive index directly from an intact oocyte, providing scope for an improved estimate using WGM-based techniques. Measurements of the refractive index of the glycoproteins that comprise the zona pellucida lead to a more conservative range of to [220]. While this range of values is still comparatively wide given the sensitivity of the WGM spectra to changes in the index, it is possible to tune the coupling condition of the excitation method, particularly in the case of the prism coupler, to sweep this range of values.
5.5.3 Surface properties
A consideration of the surface properties of oocytes, including the roughness (microscopic surface deviations) and the elasticity (Criteria 3 and 4) will become particularly important in assessing the feasibility of generating WGMs in these kinds of cells. Focusing on the most likely candidate, that of bovine oocytes, a topographic analysis of the zona region has been conducted in Ref. [235], leading to quantitative measures of several of the surface features. These include the density of the mesh of fibril bundles that comprise the zona, the roughness as measured by the root mean square (RMS) values of cantilever deflections using AFM, and the plastic deformation force as estimated through Young’s modulus. It is found that the surface of the zona contains thicker and more compact fibril bundles, with diameters of to nm, for oocytes that are either immature or only recently fertilised. The RMS deformations corresponding to the surface roughness reach a minimum for the recently fertilised oocytes, at nm [235]. Comparing this result to the maximum surface roughness permitted for sustaining modes, nm, leading to -factors of [231], the minimum surface roughness exhibited by bovine oocytes indicates the possibility of measurable WGMs. Furthermore, the plastic deformation force corresponding to these oocytes is nN, greater than that of matured oocytes at nN, which indicates a reduction in elasticity immediately after fertilisation. Studies on human oocytes have yielded similar dependencies of the surface properties on the stage of development [239]. As a result, presumptive zygotes, oocytes that have been recently fertilised and then placed in a fixing solution, will be predominantly used in the experiments presented in Chapter 6 in order to ensure the optimal likelihood of measuring WGMs. Note that both the chemicals selected for the fixing procedure and the composition of the surrounding media will also influence the surface properties and potentially the size of the oocytes, and must be taken into account.
5.5.4 Surrounding media
In the case of oocytes and embryos, the surrounding media is predominantly water based, and exhibits equivalent optical properties, as described under Criterion 7. However, a number of media variants exists in practice, depending on the storage method selected, and the concentration of salts must be monitored carefully, according to Criterion 5. The chemical composition of the two most common fixing procedures, and their corresponding media, can be found in Appendix D; namely, the zona salt solution – phosphate-buffered saline (PBS), and the paraffin formaldehyde (PFA) method, which uses a special handling medium composed of 3-(N-morpholino) propanesulfonic acid (MOPS) buffered wash and bovine albumin serum (BSA). In the particular case of the fibre taper coupling method, any dissolved salts become strongly ionised by the evanescent radiation from the tapered section of the fibre, causing contamination to the taper, rendering it insensitive. Stray detritus from damaged cell fragments can also act as contaminants during the experiments. Subsequently diluting the surrounding medium imposes additional considerations, since a forced reduction of the osmolarity of the medium can impose osmotic pressure on the cell, altering its topology and size. It will become apparent in Chapter 6 that while the dilution of a droplet of media with Milli-Q water for the purposes of measurement causes no major topological defects of the zona pellucida, it experiences uniform hypo-osmotic pressure on the inner wall, enlarging the cell volume by %, and the diameter by % or greater [289, 290]. The discussion of Fig. 5.2 under Criterion 1 indicates that the increased diameter may serve to facilitate the generation of modes.
5.5.5 Autofluorescence
Autofluorescence describes the process of light that is absorbed and re-emitted by certain biological materials [22] or crystals [84, 85, 86]. It can be difficult to distinguish autofluorescence signals from scattering mechanisms, such as Mie scattering, and thus it is important to identify the extent to which the cell candidates autofluoresce. This directly affects Criterion 7. On the other hand, extensive autofluorescence also provides an opportunity to realise active biological resonators without the requirement of introducing an external fluorescent agent, such as a foreign organic dye, which can sometimes exhibit unwanted toxicity [89, 90, 91, 75, 92, 93]. While the introduction of dyes or artificial emitters may represent a viable initial pathway to achieving a biological resonator, as argued in Chapters 3 and 4, if autofluorescence can be harnessed, it would present a conceptually elegant methodology for on-site cell interrogation, where measurement of resonances would necessarily report information pertaining to the internal and external environment of the cell in question.
This method has already been trialled in the literature through two-photon fluorescence microscopy, which is able to determine architectural features of cells, particularly for embryos, which are photosensitive [252]. For an CW excitation laser with a wavelength of nm, and using the setup shown in Fig. 3.6, the images taken in Figs. 5.10(a) through (c) show that, in the case of murine embryos, there is indeed an underlying autofluorescence signal, particularly in the green portion of the visible spectrum ( nm). In order to estimate the relative intensity and the spectrum of the fluorescence signal from the typical fixed cells that will be used in Chapter 6, a single murine embryo in a droplet of PBS media is placed on a glass coverslip, and excited with a green ( nm) CW laser, and collected with a spectrometer, in the same manner as in Fig. 3.6. The result is shown in Fig. 5.11. By examining Fig. 5.11(a), it is clear that there is indeed an autofluorescence peak in the green visible region (near nm). The plateau region between and nm is derived from the nearby and overlapping peaks corresponding to the complex protein and lipid structure of the oocyte. Outside the region, however, the signal is negligible. In cases where it is required that the autofluorescence signal be removed for a clean measurement of the scattered radiation, such as in the case of passive interrogation, selecting a wavelength region such as the NIR, which does not encounter the absorption effects inherent in the UV or the far IR regions, will be mandatory. For comparison, a single Eudorina-Pandorina microsphere conglomerate of cells suspended in MLA medium is placed on the microscope under the same conditions. The algae exhibit a much larger autofluorescence signal, particularly at nm, as shown in Fig. 5.11(b).
5.5.6 Absorptive properties
The final consideration for assessing the viability of mammalian oocytes as biological resonators is the extent to which they absorb light across the spectrum, as described in Criterion 7.
The absorbance spectral profile of murine oocytes in the IR region is shown in Ref. [291], which includes spectral peaks corresponding to lipids and acyl chains, proteins with amide groups, nucleic acids, and carbohydrates. Similarly, FTIR spectra obtained from these oocytes [257] indicate that while the sources of absorbance are well characterised and suitable for detection of structural defects in oocytes, there is little control over the regions of high absorbance. Since amino acid chains involved in DNA are highly absorbing in the UV region [250, 251], the focus of this investigation is constrained to the visible and NIR regions, for which wavelengths in the range to nm will be considered. The lower wavelength light is absorbed efficiently by a range of organic dyes, including those of the Rhodamine group [202], which can be used as a fluorescent dopant, and will be explored briefly with respect to Criterion 6 in Section 6.2.4. As an alternative, the upper wavelength values correspond to a tunable DFB laser, which is used for the passive interrogation of a resonator.
5.6 Selecting a viable cell
Upon consideration of a range of cells through Sections 5.4 and 5.5, mammalian oocytes, in particular, bovine embryos in the presumptive zygote phase of development, are selected for further study. While each of the cells considered has displayed a variety of compelling properties, in each case, except for the mammalian oocytes, one or more of the selection criteria are not able to be fulfilled.
In the case of the erythrocite, the diameters are simply not large enough to sustain modes for the refractive index of their constituent material, despite their symmetrical

(a)

(b)
shape. Similarly, the Cryptosporidium oocysts, while potentially larger than the erythrocytes, would not reasonably be able to support WGMs. One possible avenue of investigation considered was the genetic modification of cells, taking the example of Saccharomyces cerevisiae, or yeast, for which much literature on the topic exists. However, the largest variety of modified yeast did not respond to fibre taper excitation. The next most promising candidate, the varieties of algae, are able to produce compelling structural arrangements with a high degree of symmetry, but are unfortunately hampered by large surface defects that prevent resonances from being realised in their case. Lastly, the mammalian oocytes are found to be in the viable regime for their diameter and refractive index, display a high degree of sphericity and exhibit an acceptable degree of scattering and absorption loss. While the handling media used for oocytes can include a high degree of osmolarity and debris, with adverse effects on the ability to measure WGMs, these can be controlled by choosing an appropriate handling medium with a low osmolarity and a sufficient level of dilution. A cell candidate comparison matrix is provided on the next page.
To what extent subtle microscopic deformations on the surface of the zona or the inherent elasticity of this layer will play a role in the successful generation of modes is, at this point, largely unknown. The investigation of the surface properties, as well as the experimental confirmation of the viability of the oocyte with respect to the other selection criteria, will be the subject of intensive study in Chapter 6.
(✓satisfied, ✗ not satisfied, borderline satisfied, – not determined)
5.7 Sample preparation
The extraction, preparation, storage, mounting and manipulation of the biological cell samples, particularly in the case mammalian oocytes, represent tasks that must be handled carefully according to the procedure outlined below.
First, bovine or murine ovaries are sourced from the Robinson Research Institute – The University of Adelaide. Upon extraction from an ovary, the oocytes must then be denuded in order to remove the residual cumulus cells, shown in Fig. 1 in the Prologue, increasing the smoothness of the outer surface of the zona pellucida. They are then cleaned and fixed using either of the methods described in Appendix D.4.1 and D.4. Note that the fixing method influences the osmolarity of the handling medium that is used in the experiment. Upon fixing, the oocytes can then be stored in a refrigerator at C.
Immediately prior to mounting the cells onto the experimental setup, either on the top surface of the prism coupler or on the glass coverslip (see Section 6.2), the medium must be diluted in order to control the inhibiting effects of salt contamination, described under Criterion 5. It is found that a dilution by a factor of is sufficient for the MOPS+BSA medium, whereas a much greater dilution factor of is required for the PBS medium.


In order to investigate the coupling of light into an oocyte, its position must be controlled precisely so that it is directly above the laser spot in the case of the prism, or within the evanescent field of the fibre taper. This is achieved through the use of a suction holding-pipette, as shown in Fig. 5.12. The sample preparation procedure is summarised on the next page, while the specific configurations of the experimental setups will be described in the Chapter 6.
While it is by no means certain that clearly identifiable whispering gallery modes will be measured within a biological cell, in this chapter, a concerted effort has been made to identify the most likely challenges, and the physical parameters of the cell and its environment to which they pertain.
Although a number of cell candidates has been examined, the primary focus of the experiments presented in the next chapter will be the bovine oocytes, presumptive zygotes and embryos, which are deemed to satisfy the selection criteria most closely. Thus difficulties in isolating WGM signals from the transmitted and scattered spectra can be clearly explained, and a pathway to overcoming them can be developed.
6Whispering Gallery Modes in an Embryo
This chapter describes both the experimental setups and the results for the study of WGMs within embryos. After an introduction as to how embryos may feasibly function as resonators in Section 6.1, the various experimental configurations and their respective methodologies and procedures are described in Section 6.2. Modelling predictions of the FSR, -factors and sensitivity of a simulated cell are investigated in Section 6.3. Then, in Section 6.4, the experimental results are explained and compared, and the new understandings of resonator behaviour that can be gleaned from each technique are summarised. Finally, the conclusions drawn from the results are stated in Section 6.5. The experimental results and the model simulations are thus tied together, with a view towards the next key steps and future direction of research on this topic.
6.1 Embryos as resonators
In Chapter 5, the structure of mammalian oocytes and embryos was explored and, after an analysis of their potential resonance properties using the selection criteria developed in Section 5.3, these cells were deemed the most viable candidates considered in Section 5.6. These embryos are thus chosen for a more in-depth experimental analysis, presented herein. While biological cells are not ideal resonators, in that they present challenges that can serve to frustrate the generation of WGMs, the mammalian oocyte exhibits some attractive features that make it particularly noteworthy as a resonator candidate.
First, its size and refractive index combination are estimated to lie in a region of the parameter space that can ostensibly support modes. Bovine oocytes in particular have an outer diameter of approximately m, and a refractive index of to for the outermost layer, known as the zona pellucida [220]. Next, the surface roughness, while presenting the potential for hampering the generation of WGMs, can nevertheless be potentially reduced by selecting a specific period in the life-cycle of the cell, and then exposing it to a carefully selected fixing solution, as outlined in Section 5.5.3. Bovine embryos – specifically presumptive zygotes, are used predominantly in these experiments for precisely this reason. It is these cells, when denuded, as described in the Prologue, that exhibit the most favorable surface properties in surface roughness, elasticity, and also potentially higher refractive index values via their greater density of surface fibril bundles in the zona pellucida region [235]. These attributes, together, present the greatest likelihood for sustaining modes within a cell. As a note on nomenclature, since these kinds of oocytes are fertilised, the removal of the cumulus cells (depicted in Figs. 1 and 5.7) is expedited by the underlying biological processes that govern zygote development. For convenience, the term embryo will be used from now on.
The embryos are studied using a number of excitation methods, namely, the passive interrogation methods – the prism coupler and the fibre taper technique, and the active interrogation methods – fluorescent dye-doping, and quantum dot coating. By using these methods alongside one another, and in combination, a picture of the resonance properties of the embryos is unveiled, including the sources of both scattering and loss. As a result, the vision of a WGM spectrum detected in a self-supporting biological resonator in a realistic environment becomes a real possibility.
6.2 Experimental methodology
In this section, the experimental methodologies, preparation procedures and measurement apparatus and techniques are described in detail. Each technique requires a coupling method, in which the radiation is introduced into the resonator, and energy is stored in the modes that are subsequently excited.
Coupling represents a vital experimental consideration in the generation of WGMs, as it profoundly affects the ability to detect modes, as well as the structure of the spectrum. Thus, a significant portion of this chapter is dedicated to the presentation and comparison of a range of coupling methods.
The coupling methods can be split into two categories: passive and active interrogation, as described in Section 1.2. Recall that passive interrogation involves tunnelling radiation into a resonator by placing an evanescent field from a coupler, such as a prism or fibre, in the vicinity of the surface. The radiation from the coupler must be phase-matched with the WGMs at the surface. The first passive interrogation technique to be discussed is the prism coupler.
6.2.1 Prism coupler method
The coupling of the light into a resonator through the use of a high-index coupling prism has long been used in the field [79, 78, 292, 59, 67, 293], and in this investigation it represents the first screening tool applied to the candidate cells passing the selection criteria of Chapter 5. The strength of this method is its reusability, in that samples of prospective biological resonators can be examined in quick succession. However, this method does require careful alignment to be maintained throughout the experiment, presenting practical challenges for the development of robust devices for WGM detection.
The experimental setup used for mounting, interrogating and measuring the scattered and transmitted signal from an embryo is shown in Fig. 6.1. A tunable DFB laser is used to scan across a wavelength range of to nm, which lies in the NIR portion of the electromagnetic spectrum – the optimal wavelength window for reducing absorbance in the embryo, as explained in Section 5.5.5.
The beam is collimated with an objective ( magnification), and passed through a focusing telescope constructed from a convex followed by a concave lens, with an overall magnification of . Then the beam is filtered through an adjustable polariser in order to provide some control on the excitation of WGMs. Since it is clear from the investigation into the decomposition of the power spectrum in Section 4.4 that the polarisation of the radiation couples selectively to certain modes only, the use of a polariser filter facilitates the acquisition of a cleaner spectrum and more convenient identification of any WGMs present in the signal.
The material used for the prism coupler can be chosen according to purpose. In the case of the bovine embryos, both a borosilicate Schott BK glass prism11 1 Thorlabs, Inc., Sparta Ave, Newton, NJ , USA, N-BK7 Right-Angle Prism, 15 mm, Catalogue Number: PS. and a titanium dioxide (TiO2) or rutile prism22 2 Team Photon, Inc., Carmel Mountain Rd, Suite -, San Diego, CA , USA, Rutile prism, Catalogue Number: TiO---. were tested. Since the ability of a prism to couple into WGMs requires that the refractive index of the prism exceed that of the prospective resonator, and since the precise value of the index of the glycoproteins that comprise the zona region of the bovine embryo is not known, the more conservative option of a rutile prism is selected. This is done in order to accommodate the possibility of larger refractive indices exhibited by the zona, suggested in Refs. [242, 243]. While the transmittance of rutile is % compared to that of BK glass at % at a wavelength of nm, the reduction of input power is not an issue for the generation of WGMs using the DFB laser, which has a maximum output power of approximately mW. Power values of the order of milliwatts are sufficient to excite modes.

In order to fulfill the phase-matching condition, the propagation constant of the portion of the incident beam that is parallel to the surface of the prism must match that of the WGM modes, . Within the prism with refractive index , the incident beam has a propagation constant . According to Fig. 6.2, the parallel portion of the beam corresponds to . The corresponding propagation constant of the WGMs can be estimated for the fundamental modes of a microsphere with mode numbers , from the derivation in Section 2.2 leading to Eq. (2.38), . Thus, the phase-matching condition can now be specified in terms of the angles of refraction and incidence from the entry point of the beam into the prism, and , respectively, using Snell’s Law
| (6.1) | ||||
| (6.2) | ||||
| (6.3) |
Note that, in these experiments, the prism is always surrounded by air, .


(a) (b)
Using Eq. (6.3), the angle of the incident laser beam upon the prism can be adjusted, and the coupling in the WGMs of the resonator thus optimised. Values of the angle are shown in Table 6.1 for a range of typical values of the resonator refractive index . By performing incremental adjustments to , the propagation constant can be swept across a range of values, providing the optimal chance of observing WGMs in a cell. This technique will be used in particular in Sections 6.4.1 and 6.4.2.
6.2.2 Fibre taper method
The fibre taper represents an alternative coupling method to the prism coupler for the passive interrogation of modes in a resonator. While the prism coupler is highly mode selective, thus making the detection of a single mode within an imperfect resonator a particular challenge, the fibre taper has been shown to couple effectively to a large number of modes across a wide wavelength range with comparatively high -factors, in the case of microspheres [118, 83, 244]. However, the prolific use of tapers for large-scale batch measurements is limited, as mentioned in Section 5.2, by the fact that the effective life-times of fibre tapers are typically less than a few hours after fabrication, due to their fragility, and by the ease of collecting contaminants that can greatly affect their signal-to-noise ratios.
| angle of incidence (degrees) | |
|---|---|
The manufacture of the fibre tapers may proceed in a number of ways. The method outlined in this chapter makes particular use of a Vytran,33 3 Thorlabs, Inc., Sparta Ave, Newton, NJ , USA, Vytran Filament Fusion Splicer, Catalogue Number: LFS. which uses a high-power filament to anneal a section of fibre a few centimetres in length down to a diameter of approximately m.
In producing a fibre taper of sufficient quality for the measurement of WGMs in resonators, a strict procedure must be followed. A filament that is capable of annealing an optical fibre evenly for an extended period (approximately minutes), such as graphite or iridium, must be loaded into the Vytran, and the corresponding software settings selected. A sufficient argon flow is mandatory to avoid damaging the filament. After activating the Vytran and its attached vacuum pump, a connectorised optical fibre, such as an SMF, must be prepared by ‘window-stripping’ the outer cladding, and cleaned using isopropyl alcohol and abrasion. The fibre is then mounted on the Vyrtran, and secured either side of the filament in m -grooves, ensuring that less than grams of tension is applied prior to activating the filament. While the program executes, the filament will evenly reduce the diameter of the stripped section of fibre to a prescribed value, while keeping the fibre taut. Upon completion of the fabrication process, it is important to adjust the tension of the taper to avoid breakage or loss due to deviations in the tapered section. Once this has been done, a fork-shaped brace is raised up underneath the taper, which is then clamped securely in place. After deactivating the vacuum pump, the brace and its attached taper are then transported to the experimental setup, and connected to the tunable DFB laser.
A diagram of this setup is shown in Fig. 6.3. A confocal microscope setup is used, similar to Fig. 3.6, with the addition of a fork-shaped brace mounted above the glass coverslip and resonator, as shown. The brace is attached to a stage of adjustable height so that the taper and its evanescent field can be lowered accurately in order to couple light into the resonator. The height of the taper above the resonator controls the phase-matching condition, and consequently, fine adjustments are required in order to efficiently couple radiation into WGMs. This will be explored in Section 6.4.2.

6.2.3 Fluorescence methods
The excitation of WGMs may occur through use of an active layer or dopant, as introduced in Chapter 1. While the uses of fluorescent materials such as organic fluorophores [102, 76, 103, 104, 105, 106, 107, 108], crystals [84, 85, 86] or quantum dots [87, 39, 88] have been explored extensively in the literature, the majority of WGM resonators studied in the literature nevertheless rely predominantly on passive interrogation techniques. While the advantages of active resonators are manifold, as described in detail in Section 1.2.2, of particular note is their convenience in allowing free-space excitation, alleviating the practical challenges involved in the alignment of complex apparatus. The key disadvantage of active interrogation also poses a quandary in the case of biological resonators, namely, the reduction in -factor inherent in the inability to specify a preferred orientation along a single axis of symmetry. The -factors of biological resonators are expected to be orders of magnitude lower than those of artificial resonators due to surface imperfections and asphericity. Additional reduction of the -factor due to the method of excitation, Criterion 6, may prevent the detection of any underlying modes altogether.
Assessment of the -factor is thus important in this investigation as it acts as an indicator as to whether WGMs have been measured. The feasibility studies presented in Chapter 5 place bounds on the values of the -factors and FSRs expected from a resonator with given physical characteristics. Thus, by analysing the -factors of features within a signal, as well as the FSR and the index sensitivity, evidence for or against the identification of WGMs can be established.
The presence of a uniform dye also has the effect of reducing the -factors, when compared to excitation via a dipole with a single orientation. This is a consequence of closely-spaced or overlapping modes, as shown in the FDTD simulations of Fig. 3.3, which are excited simultaneously, thus making the distinction of separate modes more difficult. The isolation of a fundamental radial mode, for example, using the selective prism method, also presents a challenge in the absence of well documented material properties, such as the glycoprotein refractive index. This, however, can be ameliorated with the introduction of an adjustable polariser, depicted in Fig. 6.1, as discussed in Section 6.4.1. The measurement of modes within a biological resonator provides the added advantage of providing a new methodology for the characterisation of the refractive index of glycoproteins.
In the case of biological cells, the exhibition of autofluorescence provides an additional method for the exploration of active mode coupling. While the genetic modification of cells to exhibit enhanced fluorescence properties is an intriguing prospect, discussed in Chapter 7, the natural autofluorescence of mammalian oocytes and embryos is typically insufficient for the purposes of generating WGMs, as evident from Fig. 5.11 in Chapter 5.
Since the principal intention of this thesis is to investigate the possibility of realising a biological resonator, both passive and active techniques are brought to bear, and the insights drawn from each experiment are used to establish a proof-of-concept. Thus, future work focused on developing this concept into practical applications may be informed, and scientific insight into biological systems may be revealed.
6.2.4 ICSI dye injection and co-culturing method
The introduction of an organic dye into a embryo can allow it to perform as an active resonator, and can proceed in a number of ways. Two particular methods that are used in this thesis are the intracytoplasmic sperm injection (ICSI) method, and the co-culturing method. In each case, an organic dye is selected that can be efficiently excited at nm wavelength, and also emits in the visible region – in this case, [9-(2-carboxyphenyl)-6-diethylamino-3-xanthenylidene]-diethylammonium chloride, otherwise known as Rhodamine B. The peak excitation and emission wavelengths of this dye are nm and nm, respectively [294]. Note that in the case of active resonators, which exhibit a broad range of emitted wavelengths, there is greater flexibility in selecting a suitable wavelength region, since a tunable laser is no longer a requirement in order to scan across a wavelength range.
ICSI must be performed on an embryo prior to fixing. This is due to the fact that the fixing procedure alters the mechanical properties of the zona pellucida region in such a way that the ICSI needle can no longer penetrate its outer layer. This introduces a time constraint, in that fresh cells must be sourced and ICSI performed immediately upon arrival. ICSI proceeds by placing an embryo on a micromanipulator setup, as shown in Fig. 6.4. The embryo is placed in conjunction with a suction holding-pipette, and a specialised ICSI injection needle is manoeuvred into position using the micromanipulator. This configuration is shown in Fig. 6.5(a). The ICSI needle is then used to puncture the zona region and inject a quantity of dye into the cytoplasm (see Fig. 5.7). The volume of dye solution that is able to be injected is relatively small, less than picolitre. Attempting to inject a greater volume typically results in rupturing of the zona, causing the embryo to lose structural cohesion, and the leaking of both cytoplasm and dye into the surrounding medium. Therefore, a concentrated solution of dye, mol, is used in order to offset the small volume. The injection stage is shown in Fig. 6.5(b). Upon completion of ICSI, the embryo is then fixed in PFA using the method described in Appendix D.4.

The behaviour of the dye within the cytoplasm represents an important consideration. Rhodamine B diffuses quickly, so that it is evenly distributed throughout the cytoplasm within a few minutes. One potential difficulty is that the dye is not adequately contained within the zona structure and quickly diffuses into the surrounding medium. The puncture region of the embryo post-ICSI is shown in Fig. 6.5(c). While this diffusion is a critical factor, it is well documented that intracellular mitochondria absorb and retain quantities of dye of the Rhodamine group [295, 296]. The co-culturing method relies on this fact in order to achieve uptake of dye within the embryo.
The co-culturing method must proceed prior to fixing. Living embryos are placed in a culture medium that contains the dye, and left to develop until the presumptive zygote stage. Then, the embryos undergo fixing in PFA, as in Appendix D.4. The uptake of Rhodamine dye is investigated for a variety of concentrations. It is found that the small quantities of dye retained in the mitochondria are not sufficient to generate substantial fluorescence for the generation of modes. However, sources of fluorescent materials other than organic dyes, such as quantum dots, present some unique advantages that will now be explored.


(a) (b) (c)
6.2.5 Quantum dot coating method
One potential method for facilitating the retention of an active material, either within or attached to the outer surface of the cell, is to make use of fluorescent nanoparticles that have been functionalised for such a purpose. Quantum dots represent a convenient form of fluorescent particle, which have proved successful in generating WGMs [297, 87, 39, 88]. They generally have a broad excitation range and can thus be readily excited using the nm CW laser. Furthermore, quantum dots can be produced with a range of chemical functional groups. Two such examples, amino (PEG) group44 4 Life Technologies Australia Pty Ltd, PO Box , Mulgrave, VIC , Australia, Qdot 705 ITK Amino (PEG) Quantum Dots, Catalogue Number: QMP. and carboxyl functionalised55 5 ibid. Qdot 705 ITK Carboxyl Quantum Dots, Catalogue Number: QMP. quantum dots are used in Section 6.4.3. It will become apparent that the use of the functionalised quantum dots alone does not result in an emitter density on the surface of the zona sufficient for the generation of modes. However, the functional groups of the quantum dots are able to be attached to a polyelectrolyte layer that can be added to the embryo. This new layer is able to support a much higher density of quantum dots, and a sufficient fluorescence signal can be generated. In this manner, the problem of dye retention within a cell can be averted, providing the most reliable test scenario for the observation of WGMs through active interrogation.
6.2.6 Polyelectrolyte layers and crosslinking for quantum dots
Polyelectrolytes are electrically charged polymers that are able to form thin films that can be attached to a surface of opposite charge. Positively and negatively charged polyelectrolytes can be combined to form alternating layers to which floating particles in solution can be adsorbed [298]. Quantum dots can be immobilised by transforming the amino/carboxyl functional groups in order to facilitate crosslinking. This process involves the bonding of one polymer chain to another, or to a functional group [299]. In this case, the negatively charged polyelectrolyte is polyallylamine hydrochloride (PAH), and the positively charged polyelectrolyte is poly acrylic acid (PAA) [300].
The process for adding a polyelectrolyte layer to each embryo is achieved by adding either a negatively or positively charged polyelectrolyte solution to the suspended embryos in media. The choice depends upon the electric charge of the surface of the embryo. Alternatively, if the electric charge of a surface is not known in advance, as is the case for embryos, one of each polyelectrolyte will be attempted, ensuring that the suspended embryos are thoroughly rinsed between each attempt. This procedure is summarised in the box on the next page.
First, L of the cationic PAH is added to the embryos in solution. The concentration of the PAH is mg/mL in mol/L of NaCl. The mixture is agitated, and allowed to settle for - minutes. Second, the solution is rinsed, by removing the supernatant, refilling with water, and agitating. This rinsing process is repeated until a dilution of times is achieved, which was found to be sufficient to limit unintended interaction between the polyelectrolytes PAH and PAA. This process is then repeated for a L volume of PAA at the same concentration, rinsing thoroughly. At this point, the embryos are coated with a polyelectrolyte layer, which can be crosslinked with the functional groups of the quantum dots to achieve the coating.
Volumes of L of amino group functionalised quantum dots, as well as carboxyl group activating reagents, -ethyl--(-dimethylaminopropyl) carbodiimide (EDC), and N-hydoxysuccinimide, are then added to the solution. The compounds EDC and NHS act as crosslinking reagents that are able to adsorb the floating quantum dots to the polyelectrolyte layer. After the solution is left for hour to interact, the embryos are rinsed, and the fluorescence properties analysed. The study of the generation of WGMs using this form of active interrogation will be integrated with predictions derived from the multilayer model presented in Chapter 4, and will be implemented experimentally in Section 6.4.3.
6.3 Modelling predictions
Having established the bovine embryo as the most viable candidate cell for the generation of WGMs, it is important to perform an assessment of the most likely spectral features using the modelling techniques developed in Chapters 2 through 4. In particular, the precise values of the FSR, the -factors and the refractive index sensitivity for a given diameter, zona thickness and refractive index profile of the components of the embryo, shown in Fig. 5.7, remain an open question.
An analysis of the scale image in Fig. 5.9(c) reveals an approximate outer diameter of m, with a variation of across a range of embryos. Recalling Section 5.5.1, the thickness of the zona region is typically m, and does not deviate below m unless specialised chemical or enzyme-based annealing procedures are used, described in Section 7.2.
Simulated spectra are shown in Fig. 6.6, using a nominal diameter of m, and cytoplasm and zona refractive index values of and , respectively, as an example. Since the cytoplasm is less compacted and more granulated than the zona region [235], measurements reported in the literature suggest it has a lower refractive index than the zona [243], and thus the lower value for the glycoprotein refractive index range from Chapter 5 is chosen. The zona region, on the other hand, is estimated as the mean value of the refractive index range, conservatively, . The surrounding medium is set to that of water , since the use of a specialised handling medium does not make a significant alteration to this value, and modes are excited by a dipole source with both radial and tangential components. The wavelength range is chosen to fit within the sweep range of the DFB laser, to nm. Note that each resonance in Fig. 6.6 comprises both TE and TM modes, which in this case are broad and overlapping, in the same manner as reported in Figs 4.3(b) and 4.4(b).
It is found that the behaviour of the spectrum is extremely insensitive to the thickness of the zona pellucida for m. This effect has been noted earlier, in the discussion of Fig. 3.10 in Section 3.3.2. In this case, while the refractive index of the outer layer is less than that explored in Section 3.3.2, the diameter of the resonator is significantly larger, leading to a more tightly constrained evanescent field, as described in Section 1.3. Radiation corresponding to WGMs does not penetrate the zona region sufficiently to feel the effects of the cytoplasm. Thus, the outer diameter and the refractive index can now be obtained exactly from measurements of the FSR and the sensitivity. Note that this discovery crucially depends upon the multilayer model developed in Chapter 4, which is ideally placed for automating the non-destructive determination of the geometric parameters of a cell, developed in Section 3.4.

(a)

(b)
The example in Fig. 6.6(a) also provides guidance on how to estimate the approximate values of the FSR, the -factors and the sensitivity as follows. The FSR as measured across this wavelength range has a mean value of nm, consistent with the value estimated from Eq. (2.59): nm near the central peak.
The -factors may also be extracted from a spectrum. Recall that the matching of simulated -factors with those of experiment is typically a difficult prospect, especially without the inclusion of surface roughness and asphericity [168, 181, 198, 199]. While the multilayer model includes the radiation component to the -factor described in Section 4.3, values of the -factor should be understood only as a guide to the order of magnitude expected. The sample spectrum of Fig. 6.6 yields a -factor of , which lies at the lower limit of detectability. This is due to the fact that -factors below are similar in magnitude to the FSR, and begin to overlap, thus making adequate detection of WGMs a challenge – a point which is explored in more detail in Section 6.4.2.
Experimentally, the addition of surface effects, such as those described under Criteria 3 and 4 in Section 5.3, are expected to reduce the -factors of the fundamental modes by more than an order of magnitude, reaching values as low as for RMS deformations in the diameter of nm, according to one study [231]. Higher values of the zona refractive index may be accessible, however, by carefully selecting embryos that have been fixed at a certain developmental stage. In the next section, bovine embryos in the presumptive zygote phase have been measured with an nominal roughness of nm [235]. The introduction of osmotic pressure from the surrounding medium can also serve to increase the diameter of the embryos by a small amount, as explained with respect to Criterion 5 in Section 5.5.4. As a result, a conservative estimate places the -factors measure in the laboratory in the order of .
By systematically altering the refractive index simulated for the surrounding medium, , in regular intervals, Fig. 6.6(a) yields a sensitivity value of nm/RIU. Having access to a prediction of the sensitivity can assist in determining whether the experimental shift is indicative of the presence of WGMs, and in assessing the likelihood of spectra features to be modes. In Section 6.4.3, the refractive index sensitivity is used specifically to identify whether modes are present. The surrounding index is increased with the addition of a droplet of glycerol, thus quenching any modes present in the cell. Furthermore, in Section 7.1, an experimental procedure is summarised whereby the refractive index of the local environment around the embryo is increased systematically using a more precise glycerol injection method. Thus, it is useful to determine the behaviour of the spectrum as the surrounding index approaches that of glycerol, , and at what value of modes can no longer be sustained. Figure 6.6(b) shows that a surrounding index of is sufficient to quench the modes present in the signal completely for resonators at m. Note that in Figure 6.6 both plots exhibit small highly localised peaks within the main envelopes of the spectra, which are part of the underlying mode structure as simulated by the multilayer model.
Considering now a broad range of diameters, the limiting refractive index values of the outer layer, , may also be calculated, as a counterpart to the limiting diameters estimated in Fig. 5.2. Using the range of diameters measured in Section 5.5.1, m, the resulting signals simulated using the model are shown in Fig. 6.7. Note that, as with Fig. 5.2(a), the relatively small fluctuation in the emitter power is a consequence of the diameter and index set at the limit of detectability, however, the purpose here is to establish this extreme limit. For the smaller diameter bound, m, the minimum refractive index for a resolvable mode in the multilayer model is , while for the larger bound, m, the minimum index is . Note that minimum refractive index required to measure WGMs experimentally in an imperfect multilayer structure, such as an embryo, will be larger than these values obtained from simulation. It is clear that the behaviour of the resonance is more sensitive to changes in the refractive index near the boundary of the resonator than for changes in the diameter. Thus, the broad range of diameters expected for an embryo ( to m) result in a relatively constrained range of minimum required index values ( to ), respectively.
With these modelling predictions in mind, attention will now be turned to the

(a)

(b)
experimental results, beginning with an intermediary test case in which each of the selection criteria of Chapter 5 can be examined, before continuing to the passive and active interrogation techniques as applied to embryos.
6.4 Experimental results
The presentation of the experimental results follows the same order as Section 6.2. First, the prism coupler method is used in the case of a silica glass microsphere that is known to support WGMs, and each of the selection criteria is examined. The successful tests in both water and handling medium narrow the challenges of producing modes within a biological cell to a few key possibilities. The microsphere is then replaced with a bovine embryo. Both the prism and taper coupling methods are applied in order to assess the scattering and absorption behaviour of the embryo. Finally, the active interrogation methods are applied in order to explore effects that could not have been achieved with a tunable DFB laser alone. It is discovered that while passive interrogation leads to the measurement of modes close to the lower detection limit in the -factors, the inability of free space excitation of an active medium to excite modes along a preferred orientation renders the modes undetectable without further treatment of the surface effects. Therefore, a combination of multiple measurement techniques is required for active interrogation of embryos, such as the addition of a fibre taper to excite the active layer and collect the emitted radiation. A systematic study of the WGM peaks detected using the prism coupler method also leads to estimates of the geometric parameters of the embryo, including the refractive index of the zona pellucida, using the methodology developed in Section 3.4. These values can then be compared to the geometric proportions estimated from confocal microscopy in order to assess the accuracy of the WGM measurements.
6.4.1 Test case: the silica microsphere
Recall that biological cells exhibit number of physical characteristics, each of which can have an impact on their ability to sustain WGMs. The relative effect of each of these characteristics on the resonance behaviour is non-trivial, and a thorough discussion and enumeration of these features can be found in Section 5.3. As a way forward in removing the ambiguity of the competing effects of these physical characteristics, silica glass resonators are manufactured with diameters comparable to those of the bovine embryos. These resonators are known in advance to support WGMs, and thus the effect of a range of selection criteria can be tested one by one.
Silica glass ( for nm) is chosen as the material that is closest in refractive index to the suggested values in the literature for glycoproteins of the type that comprise the embryo zona pellucida, and are manufactured to diameters within the most conservative specifications of embryo diameter, m (Criterion 1). Each microresonator is formed as an elongated spheroid to provide scope in testing the sphericity (Criterion 2), by altering the contact angle at the interface of the prism coupler or taper. The surface properties of the resonator (Criteria 3 and 4) represent the richest source of scientific investigation in this topic, particularly due to their intimate connection with the composition and chemical properties of the surrounding media (Criterion 5), which can affect the physical attributes of the zona region in embryos. This will be investigated by exploring the behaviour of different media, particularly with respect to their salt content, and the effect of crystallisation on the generation of WGMs. The spot size and phase-matching condition of the coupling method (Criterion 6) is also refined in this test scenario, and the coupling to WGMs in imperfect resonators represents a crucial step in addressing the vision of the project as outlined in the Prologue. Finally, the scattering and absorption profiles of the silica microspheres and bovine embryos are directly compared (Criterion 7), and insights are drawn with regard to the outstanding challenges in the realisation of a biological resonator.
Images of the microspheres are shown in Fig. 6.8(a), comparing the diameters of each. An image of the scattered radiation from a silica resonator supporting WGMs excited using the prism coupler method is shown in Fig. 6.8(b). Selecting the microsphere with a diameter of m, the signal obtained from the scattered light is shown in Fig. 6.9, scanning over a wavelength range of to nm, or roughly half the anticipated FSR. The surrounding medium, in this case, is air, thus removing any possible contaminating effects introduced by embryo handling media (the effect of the presence of media will be studied presently). In this case, the coupling efficiency is approximately %. The coupling condition is coarsely adjusted, and it is found that an angle of leads to -factors of . Further refinement of the angle leads to an experimental upper limit of [78, 301]. The polariser, shown in Fig. 6.1, filters any erroneous polarisations emanating from the laser so that the incident beam couples selectively to certain modes only. Note that the results have been clarified by removing part of the fluctuation noise in the same manner as in Fig. 3.12 of Chapter 3.


(a) (b)


(a)

(b)
The silica microsphere is now immersed in Milli-Q water, and the experiment described above is repeated. A critical study of the WGM behaviour is then conducted by examining zoomed-in plots of a few example modes, shown in Fig. 6.10.66 6 The detection of WGMs in this experiment was confirmed independently by Dr. Wenle Weng, The University of Adelaide. Note that the presence of WGMs is indicated definitively by the fact that each peak in the scattered spectrum corresponds exactly to a dip in the transmitted spectrum at the same wavelength. That is, as an increase in the power is measured from the scattered light, there is a corresponding reduction in the transmitted light owing to the presence of a resonator. Since these fluctuations are confined within a narrow wavelength region, they indicate the resonant behaviour associated with WGMs, as described in Section 1.1. Note that the noise in the scattered signal is much larger than for the transmitted signal since less scattered light reaches the detector. To remove part of the noise, the wavelength resolution has been smoothed in the same way as in Fig. 3.12.
In Fig. 6.10(a), the angle of incidence, as shown in Fig. 6.2(a), is chosen to be , near the critical angle for coupling to the fundamental modes of a silica microsphere, with a wavelength range scanned by the DFB laser of pm, centred on nm. By altering the angle of incidence, different modes may be selected using the prism coupler. In Fig. 6.10(b), an angle of is selected, which allows the incoming beam to couple to modes that extend deeper within the resonator. The -factor of the mode centred at nm in the scattered spectrum is , reflecting the fact that the angle has been deviated from the critical angle. The mode selectivity of the prism coupler method gives rise to a high sensitivity of the coupling condition on the angle of incidence, requiring extremely precise determination of both the refractive index and angle in order to select a given mode.
Osmolaric contamination and surface properties
Recalling Criterion 5 from Section 5.3, the total concentration of soluble particles in the medium surrounding the resonator and coupler apparatus can affect the detectability of WGMs. In order to determine whether the surrounding environment used in the case of real-life embryos has an adverse effect on the clear measurement of modes, the microsphere is immersed in several different forms of media.
In the first case, a droplet of PBS media, defined in Appendix D, is placed over the resonator. Because of the high salt content of this type of medium, no WGMs are observed across a range of angles of incidence. Furthermore, after the removal of the droplet, and the subsequent decontamination of the prism surface, the silica resonator is replaced at the interface. Once again, no WGMs are detected, regardless of the incoming beam angle. The reason for this mode loss is that residual salt from any evaporated PBS media, which is heated by the radiation introduced from the DFB laser, crystallises and encrusts the resonator, affecting the surface properties, and drastically reducing the -factors of the modes. This is a crucial point in the investigation into the limiting factors that apply to biological resonators, offering guidance with the direction of scientific inquiry that represents the next key challenge to be addressed on this topic. While the surface properties undoubtedly have a profound impact on the ability of a prospective resonator to sustain WGMs, any methods that can assist in the smoothness, reduction of contamination, or removal of extraneous detritus can significantly improve its resonance properties. Techniques for smoothing or annealing the outer surface of the zona pellucida of an embryo are discussed in more detail in Chapter 7.
The next case to be considered for the surrounding environment of the microsphere is an equal-parts mix of MOPS+BSA handling medium (see Appendix D) and Milli-Q water. The experiment is then repeated. For this medium, a much lower salt content leads to improved resonance properties. The reduced osmotic pressure serves to increase the outer diameter of the embryo by a small fraction, leading to an improved -factor, as described under Criterion 1 in Chapter 5. The dilution of the handling medium will prove useful in the next section for the case of real-life embryos.
WGM spectra measured in this scenario are shown in Fig. 6.11. One key feature of these spectra is that very little degradation of the -factor is apparent. In Fig. 6.11(a), the polariser shown in Fig. 6.1 is orientated so that a single polarisation is selected, as well as suppressing competing modes. In Fig. 6.11(b), an alternative orientation of the polariser is selected, revealing a less prominent mode near the wavelength of nm. This test serves to illustrate an important point – the selection of modes using the prism coupler method is greatly aided by the ability to remove competing modes of different polarisations, which are capable of overlapping, increasing the effective value of the -factor, and thus making the detection of clear modes more difficult. With these powerful tools in mind, an investigation of the resonance properties of embryos is now conducted.
6.4.2 Passive interrogation of modes in embryos
Prism coupler results
Using the setup illustrated in Fig. 6.1, fixed, denuded embryos are prepared and mounted in the same manner as the silica microsphere, making particular use of the suction holding-pipette to guide the cell precisely into position, as explained in Section 5.7. Each embryo is placed in a small droplet of MOPS+BSA/water mixture

(a)

(b)
at the edge of the rutile prism to ensure the minimum spot size is achieved. Figure 6.12(a) shows a zoomed-out view of the prism setup, which includes the suction holding-pipette for positioning the embryo within the droplet of the solution so that it exactly aligns with the laser spot on the surface of the prism. In Fig. 6.12(b), the glow of the embryo is apparent, indicating that real-life embryos do indeed scatter a portion of the incident radiation at approximately nm, and that not all the light is absorbed. This addresses Criterion 7, in that the relative magnitude of the absorption and scattering behaviour of embryos can potentially be measured using this technique.


(a) (b)


A visual inspection of the embryo via the mounted camera is shown in Fig. 6.13, where the light appears as a ring or corona around the embryo. While this observation does not of itself indicate the presence of WGMs, nor that the radiation is entirely constrained by the zona pellucida region, it is useful for distinguishing the individual structural components of the embryo. The zona pellucida can be seen as a faint ring around the central globe of the cytoplasm. By continuously deviating the laser spot position, a reflection from the inside of the top boundary of the zona is seen moving in the opposite direction. The droplet of solution is indicated by the sharp boundary (identified by the small air bubble on the right hand side). By comparing the effect with a silica microsphere resonator in the same solution, the measured scattering effect does not originate from residual salt within the media.
An investigation of the scattered and transmitted spectra may now be carried out, as shown in Fig. 6.14. The angle of incidence used to isolate the clearest signal is , with a DFB laser sweeping a range of wavelengths from to nm. The polariser is adjusted in order to clarify any underlying modes. Note that the magnitude of the collected transmitted power is two orders of magnitude greater than the scattered signal. The spectra have therefore been scale-adjusted in order to compare the positions of the broad envelopes in the spectra. While both signals contain high frequency noise, which appears as oscillations (particularly in the transmitted spectrum), this can be treated by resampling the data, applying a low-pass Fourier discrete cosine transform (DCT). It is clear from Fig. 6.14 that there is a broad peak in the scattered signal, with a corresponding dip in the transmitted signal. This observation, taken together with the photographic information, is strongly indicative of the presence of modes. In fact, this is the first observation of WGMs sustained within an embryo. A range of other tests will now be carried out before a definitive answer is established.

The spectrum may be used to estimate the physical parameters of the embryo. If the estimates lie within the bounds of the physical properties of the embryos, as established in Section 5.5, this lends credence to the supposed generation of WGMs in cells. The angle of incidence for which the best set of spectra was achieved may be used to obtain a value for the refractive index of the material in which the radiation propagates, the zona pellucida. Using Eq. (6.3), a value of is estimated. While this value is slightly larger than the upper estimate considered in Chapter 5, it is worth noting that Ref. [220] indicates that certain protein structures may exhibit refractive indices as high as . In addition, the value of may be increased relative to unfertilised embryos. This can occur due to the greater density of networked glycoproteins in the zona pellucida immediately after fertilisation. Such an effect is present in the presumptive zygotes chosen for these experiments. This phase of embryo development also leads to a degree of zona hardening [235], in conjunction with the increase in stiffness contributed by the fixing procedure of Appendix D.4. As a result of these factors affecting the surface properties of the embryo, the measured -factor from the spectrum is . This value agrees well with the modelling predictions of Section 6.3 that the -factor is expected to be of the order of , including the effects derived from the physical parameters, described in the selection criteria of Section 5.3.
The spectra in Fig. 6.14 may also be used to estimate the FSR, in the same manner reported in Section 3.3. The approximate peak positions in the scattered spectrum are shown as vertical dotted lines. Measuring an FSR of nm, an approximate value for the outer diameter may be determined using Eq. (2.59), as m. Note that the FSR must be equal to or larger than the width of the envelope in the spectra to satisfy the Rayleigh criterion [302]. A full-width at half-maximum value less than a third of the FSR indicates that the envelopes are well-spaced within the spectrum. While this outer diameter lies within the normal range of diameters for bovine oocytes as reported in Ref. [287], to m with a variation of %, it is larger than the mean value of the sample of embryos used in the experiment, m, by – outside of one standard deviation. According to Criterion 1, a larger diameter embryo is more likely to exhibit modes than those with smaller diameters, for a fixed refractive index, . Therefore, it is reasonable that a large number of experimental measurements should be required in order to obtain an embryo with a diameter this size. This, in part, explains why the generation of modes within embryos is not readily apparent, requiring multiple experimental techniques to answer the research question outlined in Section 1.4.
The larger diameter can also be explained by the fact that a diluted mixture of handling medium is used to minimise any detrimental effects on the acquisition of the spectrum caused by residual salts or stray detritus in the solution. It has been reported that a decrease in oocyte volume of up to % can occur during hypo-osmolaric processes that occur naturally post-ovulation [290], while the linear Boyle van’t Hoff relationship between cell volume and osmolarity [303] indicates that the radii of bovine embryos can be deformed up to % when placed under osmolar stress [289]. Thus, the reduction in the osmolarity, Criterion 5, applies a uniform negative pressure on the zona wall causing significant expansion of the surface of the embryo.
Taper results
The taper coupler method potentially offers some advantages over the use of a prism, particularly the fact that it is able to constrain the orientation of the modes excited to within a single plane, leading to improved -factors and coupling efficiencies [118, 83, 244]. An image of the experimental setup immediately prior to exposure of the taper to an embryo is shown in Fig. 6.15(a). The additional space afforded by the use of a broad coverslip, rather than a restrictively-sized prism, allows a number of experimental configurations to be incorporated, such as the refractive index sensitivity measurement apparatus, discussed in Chapter 7. However, the fabrication of a fibre taper, described in Section 6.2.2, is a precarious process, and the fragility of the taper leads to a number of drawbacks. First, a new taper must be manufactured immediately prior to each experiment. While fixed embryos need simply to be kept in a handling medium, the use of living cells in future experiments may present timing difficulties in carrying out measurements, since their survival rates drop severely after minutes without proper incubation. Second, the waist diameter required of a taper to achieve coupling to WGMs in resonators of the order of m in diameter is approximately to m [304]. One study found that waist diameters of m were required to obtain suitable coupling efficiency to smaller diameter ( m) high-index polystyrene microspheres [118]. While this is feasible through the use of a Vytran, the large extent of the evanescent field within a droplet of solution exposes the taper to contamination from a range of biological debris, dust, and small particles that are difficult to filter out entirely. This effect can severely compromise the transmission of the taper while adding non-specific background, making the detection of a WGM signal difficult [261].


During the setup procedure, it is important to ensure that the taper is lowered close to the glass coverslip prior to the introduction of the droplet of solution containing the embryo. This prevents the fragile taper from experiencing upward pressure from the surface tension of the droplet, which may cause physical damage to the taper. A droplet of media of approximately L is then added to the coverslip. Particularly in the case of larger volume pipettes, one must ensure that the nozzle velocity is sufficiently low to avoid breakage of the taper. Abrasion of the taper against the glass coverslip can be reduced by using a customised narrow sliver-shaped glass coverslip that does not extend beyond the tapered region, shown in Fig. 6.15(b).
Images of the taper coupling method applied to an embryo are shown in Fig. 6.16. While there appears to be a glow from the light scattered by the embryo, it is unclear whether this effect is due to the resonance behaviour observed using the prism coupler method. In order to investigate whether any underlying modes have been detected, the transmitted spectrum is measured several times, each time detaching the taper from the embryo and replacing it so that the evanescent field is in the vicinity of the zona pellucida.


(a) (b)
In carrying out the measurement in conjunction with the taper, the high level of noise makes identification of modes inconclusive. Examples of signals collected using passive taper excitation are shown in Fig. 6.17. The high noise within these signals is a consequence of the small diameter of the taper waist required for the phase-matching condition. Small waist diameters lead to a large evanescent field, resulting in high levels of loss, as well as increasing the sensitivity of the taper to contaminants in the surrounding medium, as described in Sections 5.5.4 and 6.2.2.

6.4.3 Active interrogation of modes in embryos
Quantum dot results – combining interrogation methods
Results for the quantum dot-coated embryos are now discussed, with a view to providing independent corroborating evidence for the generation of WGMs within embryos. While the introduction of either amino or carboxyl group functionalised dots directly into the handling media of the embryos does not result in significant emitter density on the surface of the zona of each embryo, the use of crosslinked polyelectrolyte layers, described in Section 6.2.6, is more successful.
Following the procedure outlined in Section 6.2.6, amino group quantum dot coated embryos are prepared and excited with a nm wavelength CW laser. Images of the fluorescence emission from a sample embryo are shown in Fig. 6.18. The zona and cytoplasm regions are clearly visible under a white light source in Fig. 6.18(a). When the white source is removed, in Fig. 6.18(b), it is evident that the emitter density is well distributed over the surface of the embryo.


(a) (b)
The interrogation of the coated embryo can proceed in a number of ways. Free space excitation and collection is the simplest technique from a logistics standpoint, requiring no additional apparatus beyond that shown in the confocal microscope setup of Fig. 3.6. However, the inability to select modes along a specific orientation limits the -factor and renders any underlying modes difficult to detect, as described in Section 6.4. To mitigate this effect, a combination of techniques is employed to maximise the likelihood of measuring WGMs in the embryo. Specifically, a fibre taper may be used to collect the emitted radiation along a specific axis of revolution. The practical limitations of using fibre tapers for the collection of WGM signals explored in Section 6.4.2 are ameliorated in this case, since the taper waist does not need to be perfectly phase matched with the WGMs within the resonator. In this case, tapers with diameters of to m are employed in order to excite the quantum dots and/or collect the fluorescent radiation.
A comparison of the signals obtained using free space or taper collection from the quantum dot coated embryo of Fig. 6.18 is shown in Fig. 6.19. The broad emission of the quantum dots allows a wider range of wavelengths to be investigated compared to that of the passive interrogation results. The results are normalised to the maximum value of the power, . In Fig. 6.19(a), it is initially unclear whether the envelope, corresponding to the scattered signal from the quantum dots, contains WGMs. By using the taper collection method, a portion of the background signal can be removed. The result is shown in Fig. 6.19(b), noting that the plot has been re-normalised with respect to the new value for the maximum power recorded. The signal now exhibits a modulation atop the scattered signal, which may indicate the presence of modes. However, in order to clarify the result, a number of signal processing and experimentation techniques are used. First, the contribution to the signal from the quantum dots, in the absence of a structure, should be removed. While the signals shown in Fig. 6.19 have already been normalised to , the background signal, , must also divide the power spectrum to isolate the portion of the signal derived purely from the presence of the embryo. The result of this treatment of the taper collection results is shown in Fig. 6.20(a). Note that, for clarity, the wavelength axis has been scaled to to m, in which the anticipated FSR of an embryo from the prism experiment, nm, can be clearly resolved when present. While this signal shows modulation of the main envelope, it is unclear whether there are embedded modes. A Fourier decomposition can determine whether a specific repeating pattern embedded in the data dominates. The result of this treatment of the taper collected signal with s acquisition time is displayed in Fig. 6.20(b).

(a)

(b)

(a)

(b)
The dominant peak in this Fourier spectrum is around nm, corresponding to a diameter of approximately m, through use of Eq. (2.59). While this value lies outside the range of embryo diameters determined from Ref. [287], and obtained from the embryos studied in Section 6.4.2, the peak is quite broad, indicating that a repeating pattern corresponding to WGMs is not easily determined. This may be a result of the effect noted in Sections 2.3.2, 3.3, and particularly in Section 4.4, where nearby overlapping modes form composite peaks that alter the structure of the spectrum.
Next, the presence of modes in the signal shown in Fig. 6.20(a) can be tested experimentally by altering the refractive index of the surrounding medium. This is achieved by adding a droplet of glycerol solution to the surrounding medium of the embryo. Since glycerol is both soluble and has a higher refractive index () than that of water and handling media (), any WGMs present inside the embryo will become quenched by the decrease in the refractive index contrast, as simulated in Section 6.3. A comparison of the normalised signals collected with a second exposure time, averaged over acquisitions, is shown before and after the addition of a % glycerol solution in Fig. 6.21(a). This concentration of glycerol solution is sufficient to achieve the critical surrounding index beyond which no WGMs can be sustained. While there is a marginal decrease in the clarity of mode structure in the signal, the reduction is nevertheless fairly subtle. An analysis of the Fourier spectrum after the addition of the glycerol solution, displayed in Fig. 6.21(b), shows that the main peak near the FSR value of nm is much less than that of Fig. 6.20(b). This indicates that the repeating pattern embedded within the signal is less prominent after glycerol is added.
While the analysis of the results obtained through active interrogation of embryos is not as definitive as those obtained from the prism method, a number of other methods may be utilised in order to improve the distinctiveness of the measured modes. Examples such as the use of chemical or enzyme-based annealing of the zona pellucida are anticipated to reduce the detrimental effect of surface roughness on the -factors of the modes, particularly the fundamental modes [231]. These

(a)

(b)
future directions are outlined more comprehensively in Chapter 7.
6.5 Conclusions from the experiments
In this chapter, the measurement of WGMs within bovine embryos was sought, and a positive result was recorded.
Using passive mode interrogation, modes present within the scattered and transmitted signals led to an estimate of the zona pellucida refractive index of , an FSR of nm, and a diameter of m. While the value of the diameter was consistent with the values expected from the literature [287], it was larger than the mean oocyte diameters measured prior to dilution of the handling medium, m. While the dilution of the handling medium explains the increase in cell volume, due to the Boyle van’t Hoff relationship between cell volume and osmolarity [303], a large number of trial experiments were required to obtain an embryo of optimal size and sphercity. The -factor of was also consistent with the expected values from both modelling and experiment.
In the context of the detection of WGMs in porcine adipocyte cells reported in the literature [114], a critical evaluation is necessary. A careful investigation of the generation of WGMs in a range of cells considered in this thesis, under ideal conditions, demonstrates that the challenge inherent in the detection of a clear signal. Successful detection is highly dependent on the interrogation method used, and the chemical preparation and handling of the cells prior to experimentation.
In active interrogation of embryos, a fibre taper was required for collection of the scattered light in order to resolve the modulation of the background signal, potentially corresponding to WGMs. The presence of a background signal is a result of the imperfect phase-matching of the embryo with the taper waist, with diameters of to m. To investigate the presence of WGMs, a range of signal processing and experimental techniques were employed. First, the signal was normalised to the residual background envelope. This served to isolate the contribution from the presence of the embryo. Second, a Fourier decomposition of the signal revealed a peak corresponding to an FSR of nm, corresponding to embryos of diameter m – a value that lies outside the bounds determined from the literature, and from observation of the embryos used for this thesis. However, the addition of a droplet of glycerol solution, reducing the refractive index contrast of the embryo with its surrounding medium, led to the reduction of the dominant peak at nm in the Fourier spectrum, indicating the quenching of modes.
The results derived from the model, the experiments and the analysis integrate to form a prediction that WGMs can be generated within a biological cell, and this effect was observed within the bovine embryo. The development of embryos as viable biological resonators can advance in a range of directions from this point onwards. In the next chapter, key techniques are explained, which are able to address and refine the limiting factors, including the surface properties, and a number of innovative directions are proposed for future research endeavours in the field.
7Future Directions: Towards a Biolaser Sensor
The investigation of biological resonators represents the chief aim of this thesis, along with an understanding of the physical characteristics that underpin the ability of biological cells to exhibit WGMs.
Refining the cell preparation methods, and introducing innovative techniques to facilitate the detection of WGMs, would serve to pave the way towards reliable cell resonator-based technologies in the future, including the ability to identify and track the behaviour of WGMs in the context of external macromolecules, or changes to the refractive index contrast of a cell. Such technologies are particularly attractive because resonances that are sustained by the cell itself are extremely sensitive to its internal features, as well as the surrounding environment. This means that, in principle, further development of WGM detection within a cell could provide vital information on the internal structure or status of the cell, as a complementary approach to the other label-free detection technologies [20, 21, 22, 23, 24, 25, 26] mentioned in Chapter 1. Examples of this include the ability to detect macromolecules in the vicinity of the cell; the cell can be introduced to known biomolecules of interest, such as viruses or proteins, and the characteristic shift in the WGM positions due to changes in the surrounding refractive index can be assessed [15].
In the specific case of embryo resonators, such innovations can have broad implications on health sciences, where the ability to avoid immune responses in an organism by using biological sensing modalities presents an attractive feature for technological development in the near future.
The following sections include a few examples of the methods that can be used to improve the performance of biological cell resonators, as well as summarising key directions of future research that may facilitate the construction of a fully-fledged cell-based modality for sensing applications.
7.1 Glycerol-based index sensitivity measurement
The measurement of the refractive index sensitivity of a biological cell resonator represents the next step in being able to identify modes and characterise the WGM shift in the presence of an external agent affecting the surrounding medium. While predictions of the sensitivity of an embryo from the multilayer model of Chapter 4 are presented in Section 6.3, a comparable measurement of the sensitivity can be performed using the following method.
A fluid with a higher refractive index than the medium surrounding the embryo, such as glycerol, can be circulated around the embryo during WGM measurement. The resultant change in the surrounding index, , can be estimated based on the relative refractive index difference between the two fluids and their relative molecular weights. This change in the index can be detected as a shift in the WGM peaks of the spectrum, and thus the sensitivity can be calculated using the definition, [115].
By using a series of different dilutions of glycerol () in water (), a range of refractive indices can be trialled, by adopting a tube-rigging system, shown in Fig. 7.1. Recalling the discussion in Section 6.4.2, the introduction of index sensitivity measuring apparatus requires physical space not easily afforded in the compact prism coupler setup described in Section 6.2.1. The inverted confocal microscope setup of Fig. 3.6 provides sufficient room to employ the glycerol flow method, shown in Fig. 7.1(a). However, one potential drawback is that the commencement of any flow of fluid causes the embryo to shift position, thus making consistent WGM measurements extremely challenging without more sophisticated optical compensation mechanisms. An alternative for handling this effect is to fix the embryo in place. This can be carried out conveniently in the case of the fibre taper coupling method. It is found that the taper itself acts as a brace, preventing the embryo from being dislodged from its initial position, as shown in Fig. 7.1(b). While the taper remains intact during this procedure, it is not known in what way this pressure applied from the embryo affects the behaviour of the resonances, and this would require further exploration.
A specific concentration of glycerol solution can be chosen from a range of values shown in Table 7.1, and placed in one of two SGE syringes, L in volume, each connected to a length of yellow IDEX tubing with an inner diameter of approximately m. The tubes can then be placed opposite each another, leaving to nL of fluid between them in which the embryo will be situated. The tube ends and embryo are then situated within a droplet of handling media. The upper tube expels the glycerol solution, while the lower tube collects the expelled fluid at the same rate, so as to avoid contamination of the droplet of media. Since the flow between the tube ends must be kept low, for example, less than L per hour to avoid dislodging the embryo, the diffusion rate of the glycerol solution in media plays an important role in assessing when the flow rate is consistent across the embryo. When this condition is met, the shift in the WGM peaks reaches its converged value.


(a) (b)
| glycerol concentration | refractive index shift (above ) |
|---|---|
| % | |
| % | |
| % | |
| % |
7.2 Zona pellucida annealing procedures
One of the principal discoveries in Chapter 6 is the dramatic influence of the surface roughness on the ability of a resonator to sustain modes. While the bovine embryo is able to sustain modes at the limit of detectability, there is scope for improving the -factors of the modes by applying a specialised range of annealing procedures selected for these kinds of cells.
The annealing procedures can be divided into two groups: chemical-based erosion of the zona pellucida [305, 306], and enzyme-based thinning methods [307, 308]. The motivation for the use of these techniques in reproductive biology is to induce qualitative changes in the zona region in order to facilitate hatching of the blastocyst [305, 306], and to collect cells for biopsies for preimplantation genetic screening [309], for which competing methods such as partial zona (mechanical) dissection and the use of a diode laser are used for assisted hatching [310, 309]. An investigation of annealing with respect to cell resonators should focus on the relative smoothness of the cells after treatment. One particular advantage of the zona thinning techniques over the total mechanical removal of the zona itself, apart from avoiding exposure of the embryo to chemical, mechanical and bacterial risks, is that the chemical and enzyme-based annealing can partially thin the zona uniformly [306]. Thus, the innermost layer of the zona is retained, offering control over the thickness of the remaining zona, as well as the -factor, sensitivity and FSR of any modes sustained within, as described in Chapters 3 and 4.
Of the chemical annealing methods, the use of an artificial interstitial fluid known as Acidified Tyrode’s Solution (ATS) has shown success in thinning the zona. (The recipe for ATS is reproduced for reference in Appendix D.) An embryo is attached to a holding pipette, with a secondary micropipette containing the ATS to induce an even flow over the embryo through expulsion for a limited duration [306, 309]. The solution dissolves the outer layer of the zona, with the inner layer remaining, which is both more compact and resilient after treatment [306]. Thus, the exposed inner layer of the zona has the potential to exhibit superior surface properties to the untreated zona, improving the quality of the modes.
The enzyme annealing method uses pronase to achieve similar results in removing the zona through digestion [307, 308]. By using a low concentration of pronase ( IU/mL) diluted with G- media,11 1 Vitrolife, Västra Frölunda, Västra Götalands Län, Sweden, G- media, see http://www.vitrolife.com/en/Products/G-SeriesTM-media/G-2/ an initial stretching and softening of the zona can be achieved, and the rate of digestion can be controlled [310].
While both these methods of annealing are capable of exposing the inner layer of the zona through partial removal of the glycoproteins, ATS is usually preferred in clinical practice, due to the fact that it allows the embryo to survive during parthenogenic activation in the absence of calcium [311]. For the purposes of sustaining modes, both these methods are expected to be comparable with each other.
7.3 Use of lasing to enhance detection of resonances
The autofluorescence properties of cells, and the introduction of artificial fluorescent coatings have been studied throughout this thesis; however, the possibility of constructing a biological cell laser has not been explored in the context of self-supported WGMs, such as those within an embryo. While the use of resonator technology within biological cells has been demonstrated in the literature, either by implanting microspheres in vivo [107], or exploiting natural oil cavities within certain animal cells [114], the capability of biological cells to exhibit lasing unassisted has not yet been fully realised.
The potential of biological cells to support lasing modes was first studied in Ref. [221], where GFP was used to excite modes, facilitated by placing the cell in a mirrored cavity. Achieving lasing within a resonator can potentially enhance the -factors of the modes [312, 76, 119, 95], as well as lower the detection limit for sensing applications [94]. While this is an attractive prospect, biological cells are significantly more fragile than most artificial resonators, and thus the lasing threshold may lie beyond the inherent damage thresholds of the cells. Since the lasing threshold takes the form for an effective mode volume [129], where the gain coefficient is highly dependent on the distribution of the fluorescent medium, high density of fluorophores can lead to self-quenching [313]. This indicates that there is an optimal fluorophore density for achieving a low lasing threshold. However, the low -factors of the embryos studied in Chapter 6 () lead to a strong opposing effect whereby the lasing threshold is increased significantly, due to the fact that . The damage threshold, on the other hand, is likely to be less than that of polystyrene microspheres – mJ/cm2 using a pump wavelength of nm [314, 116]. One recent study reports the damage threshold for nucleolus-like bodies in mammalian oocytes as less than W/cm2 using a fs pulse ( mJ/cm2) [315].
As a result, the realisation of a biological cell laser will require careful management of the lasing and damage thresholds. A solution for pursuing this particular direction, however, may lie in the field of genetic engineering.
7.4 Genetic modification
While the genetic modification of cells has been discussed in Chapter 5 in the case of yeast, specific isolation of genes that control fluorescence represents an important sub-branch of genetics that has seen much use in sensing applications since the discovery of GFP within jellyfish of the species Aequorea Victoria [316]. While recent studies of cells that incorporate GFP have shown an ability to sustain WGMs with artificial assistance from a pre-built mirrored cavity [221] mentioned above, the genetic modification of the cell itself to express GFP on its own may alleviate the practical difficulties in introducing an artificial fluorophore explored in Section 6.2.3. This avoids toxicity issues altogether, as well as the challenges in attaching or otherwise incorporating fluorescent material into a cell.
One such method for the modification of a cell to express fluorescent proteins is clustered regularly interspaced short palindromic repeats, or CRISPR [317]. While CRISPR has been used to carry out gene tagging [318], and to insert genetic sequences into embryonic stem cells in mice [319], and while oocytes have been used to improve the gene editing methodology behind CRISPR [320], its use as an efficient method for the introduction of fluorescent proteins into oocytes remains to be fully explored.
7.5 Living resonators
The interrogation of living matter represents the culmination of the interrogation methods presented herein, since the ability to report on the status of a living cell has the potential to impact health sciences by leading to new diagnostic tools, aiding in the early identification of diseases and pathologies that cannot easily be studied using more conventional techniques. However, the use of living cells presents the researcher with a number of additional complications to address.
The first complication is simply a logistical one – the life-time of many living cells, particularly embryos, is limited to a window of approximately minutes or less, without a thermal mount or carefully prepared oxygen/carbon dioxide control system to maintain the required environment provided by a standard incubator. Compounding this limitation with the additional treatments of the cells to incorporate fluorophores or quantum dots, and the fabrication of fibre tapers, the future development of these techniques as applied to living cells is initially a daunting proposition. However, these challenges can, in principle, be readily addressed with proper engineering to facilitate the preparation, mounting and interrogation of cells within this limited window of time. As an additional direction, the use of genetically engineered cells, which require no additional in vitro processes to be carried out post-incubation, presents an enticing opportunity for future development.
An additional feature in the context of living cells is the fact that they are in a state of continual growth, and in the case of embryos, progressing through the stages of maturation at a rate of a stage per day or faster. The notion of using embryos in the presumptive zygotes phase can no longer be treated as a static quality of the cell. As the cells mature, their surface properties inevitably change [235, 239]. This presents an opportunity to gain an understanding of how the WGMs change within a living cell. If WGMs can be sustained in one phase of development while they are unable to be sustained in other stages, the generation of modes may be used as an indicator to gauge the stage of development of the embryo, their health, and their responses to the surrounding media, including neighbouring macromolecules contained therein.
7.6 Cells as sensors
In this chapter, a variety of methods for extending the work of this thesis on generating WGMs within biological cells has been presented. While the immediate focus of the next challenges in this area of study is on the surface properties of the cells, annealing procedures for smoothing the outer layers of embryos, improving the -factors through lasing, and improving the fluorescent signal via genetic modification, the long-term goal remains the development of a sensing modality for cells.
Since cell biology represents a crucial area of study in pathology, diagnosis and medical technology, steps toward a novel sensing technology capable of exploring new aspects of cells is of paramount importance. Whispering gallery modes represent one such research direction in the development of sensing technologies, not only because of their high sensitivity to the internal and external environment of the cell, but because it is the cell itself that is capable of supporting the modes. Without the requirement of labelled proteins using specialised fluorophore markers, the light can be generated on site – within the cell itself, and the natural geometry of the cell provides a reporting modality for its current status. Using the cells themselves to report on their own status, without the addition of complex machinery or probes that must enter the cell, avoids the risks of contamination, immune response or physical damage. In summary, the generation of whispering gallery modes within a biological cell represents a conceptually elegant paradigm for the future realisation of autonomous biological cell sensors.
8Conclusion
8.1 Summary
In this thesis, the ability to sustain whispering gallery modes in biological cells was explored, by considering the conditions under which resonances can take place in an optical cavity. In the first chapters of the thesis, the properties of the emitted energy spectra from resonators were examined, and the behaviour of the wavelength positions of the modes, the free spectra range and the quality factors were investigated in order to interpret the critical conditions beyond which no modes can be sustained.
This understanding was applied to single and multilayer resonator architectures, and the principles of Mie scattering theory were extended to develop an efficient, general model for multilayer microspheres in Chapter 4. The unified nature of the multilayer model permitted its application in a number of settings, including a range of mode excitation strategies typically used in the field of biosensing that have resisted the development of a comprehensive model up to the present time. One such method in particular, active mode interrogation involving a uniform layer of fluorescent material, was able to be simulated for the first time in multilayer resonators, and the spectral properties were examined.
The development of sophisticated models for understanding the properties of resonators was accomplished in order to target the main research objective – to discover whether whispering gallery modes can be sustained within a biological cell. A detailed study of the physical parameters associated with resonators, with cells as a particular example, was conducted to distil the critical selection criteria required of a resonator, in Chapter 5. In this study, the limit of the detectability of WGMs within imperfect resonators was investigated. Criteria for the cases where modes can no longer be sustained or detected were developed, as well as the mechanisms for the deterioration of the spectrum. These criteria were applied in a range of examples of biological cells to demonstrate how they can be used in practice.
After a comprehensive analysis of the features inherent in the range of biological resonator candidates considered, the bovine embryo was selected as the most viable choice for further study and experimental treatment. The models, methods, understanding of the spectra and experimental techniques explored in this thesis were brought to bear in combination in order to analyse the resonance properties of embryos in Chapter 6. This work demonstrated that, through the measurement of scattered and transmitted spectra, as well as visual confirmation, whispering gallery modes can be sustained within a biological cell, in this case, the embryo.
8.2 Methodological evaluation and final analysis
An analysis of the techniques and findings of the thesis are as follows.
While Chapters 2 and 3 developed the Finite Difference Time Domain method, employing state-of-the-art supercomputing resources to examine the transient behaviour of the electromagnetic fields, the principal focus has been on understanding the properties of the whispering gallery mode spectra. By carefully examining the radiation collection time and the grid resolution, converged spectra derived from this general computational framework were matched to the results of Mie scattering theory, providing a robust and comprehensive calculation methodology for future research endeavours into novel resonator architecture. These methods are, in essence, exploratory technologies, which require significant computational resources in practice.
With the understanding gained through the computational methods, the research aim could be further refined, focusing only on the conditions of mode loss for a multilayer resonator. The development of the multilayer model in Chapter 4, while valuable in its own right as an efficient and general tool, was used principally to address this aim. The extraction of the free spectral range, quality factors and index sensitivity from a simulation, using carefully chosen input parameters to align closely with those of a candidate cell, yielded a robust prediction to which experimental results could be compared.
Since the modelling predictions do not incorporate all the physical parameters and defects of a real-life cell, an understanding of which physical parameters impact the generation of whispering gallery modes, and their relative impact on the quality of the modes, was necessary to establish prior to measurement. As a result of this evaluation, the studies conducted in Chapter 5 clearly illustrate how the selection criteria are applied in practice, as well as determine the most likely viable candidate cell to be used in the remainder of this project.
Extensive characterisation of the physical properties of the bovine embryo represented an important step in understanding how the modes might be realised, and which geometric and material parameters could serve to hamper the detection of modes. Studies of the shape, diameter, refractive index, surface properties, scattering and absorption profiles and the effect of the osmolarity of their surrounding handling media were conducted in order to isolate the most crucial physical feature to be addressed by way of improving the clarity of the modes in the future. It was found that the selectivity of the prism coupler method resulted in the clearest detection of modes in the experiments conducted in this project. The use of the polariser was a vital tool for the clarification of the modes, by suppressing nearby competing modes of differing polarisations, thereby allowing a mode structure to be detected. Furthermore, the surface properties of the resonator were identified as the principal physical attribute leading to reduced quality factors, and thus highest priority to be addressed in the future for embryo-based resonator technology.
A number of experimental methods were employed in order to measure the underlying modes within the structure, in Sections 6.4.2 and 6.4.3. It was found that the free spectral range and quality factors of the resonances obtained from the prism coupler method were consistent with the predictions from the modelling, and the selection criteria-based feasibility study. In the case of active interrogation using quantum dot coated embryos, a modulation of the fluorescent envelope was detected, and taper coupling was employed to remove a portion of the background radiation, as an attempt to resolve the underlying modes. A Fourier signal analysis of the measured radiation revealed a resonance corresponding to a resonator diameter lying outside the bounds determined in Section 6.4.2, placing tension upon the clear identification of modes. The broad peak in the Fourier decomposition indicated that a repeating pattern corresponding to WGMs was not easily determined in this experiment. While further development in measurement techniques will no doubt elucidate more properties of the detected signal modulation, the structure of the Fourier analysis is anticipated to originate from broad, composite peaks within the emitted power spectrum that exhibit significant overlap with each other. Finally, the behaviour of the spectrum was recorded while a droplet of glycerol solution was added to the surrounding medium of the embryo, as a method for increasing the refractive index of the medium, and thus quenching any WGMs that may be present. A marginal decrease in the clarity of the mode structure was noted; however, this result taken alone on its own merits was inconclusive.
A complete summary of the evidence for each experiment, discussed in Section 6.5, presents a compelling picture of resonances within an embryo. While the detection of clear modes posed many technical challenges as outlined in Chapters 5 and 6, each experimental method revealed unique advantages that shed light on different aspects of the viability of biological cells as resonators. While it is clear that further refinement and investigation will be necessary for the effective utilisation of the definitive proof-of-concept contained in this thesis, it is anticipated that these research endeavours will become a vital asset for the future realisation of autonomous biological cell sensors.
Thus, I shall conclude with the following summary statement:
8.2.1 Concluding statement
The understanding of the spectral behaviour of resonators, together with the predictions from sophisticated models and carefully-chosen selection criteria, have been applied to a biological cell – the bovine embryo, leading to the detection of whispering gallery modes sustained within the cell. This is an original contribution of this thesis.
O Epilogue
“In a thought experiment the scientist puts nature to the test in his mind’s eye. The thought experiment combines the visual and abstract mathematical modes of thinking in a manner that can permit the scientist to “see” the deep structure in a problem situation.”
A. I. Miller, “Imagery and Intuition in Creative Scientific Thinking:
Albert Einstein’s Invention of the Special Theory of Relativity,” in
Creative People at Work, Twelve Cognitive Case Studies,
(D. B. Wallace and H. E. Gruber, eds.), p. 172 (Oxford University, 1989 Ed.)
[321].
Novel sensing technologies and beyond
The journey laid out in this thesis has traversed across multiple disciplines, and incorporated many different aspects of science that play an important role in contemporary research. In the quotation above, Einstein’s scientific approach successfully integrated experimental data from the laboratory and conceptual frameworks in order to explore natural processes. Recalling the motivation for the vision described in the Prologue, “to have a cell act as a resonator is to have a new window into its internal structure and its immediate environment”, the realisation of this vision opens the door into new directions in biology, chemistry and physics.
While the discovery of embryos as novel resonators is a compelling result, and the development of biosensing in a way that circumvents the need for cumbersome interrogation methods is a promising possibility for the future, laying the groundwork for new technologies represents only one aspect of the value of integrative research. Beyond facilitating the development of novel utilities, science involves the exploration of the mysteries of nature to gain a new understanding of the world. In this context, the goal of a scientific endeavour is not merely to predict, nor simply to measure or analyse, but to take these aspects together in order to synthesise a coherent picture that provides new meaning and insights into the whole.
In this thesis, the understanding gained in how
whispering gallery modes behave in novel resonator architectures
prompted the development of a unified multilayer model.
The physical limits for non-ideal resonators were
distilled into selection criteria, using the predictions afforded by
the model. The predictions, the measurement of
the modes within a biological cell, and the analysis of the results,
together form an integrated picture of resonances within a cell,
and the discovery of purely biological resonators.
“If we microscope inward, we see molecules underlying our physical structure. Go even more micro, and we see atoms comprising the molecules. An even more fine-grained focus gets us to the now accepted reality that the vast majority of an atom itself is empty space… we can see that even what we think of as the physical nature of the world, the world of things comprised of mass, is actually made up of very dense energy.”
D. J. Siegel,
Mind, a journey to the heart of being human,
p. 318 (W. W. Norton, 2017)
[322].
Appendix A Vector Spherical Harmonics
In this appendix, the notation and properties of the vector spherical harmonics used in Chapter 4 and Appendix B are explained.
A.1 Notation
Considering the spherical symmetry of the resonators used in Chapter 4, the use vector spherical harmonics (VSH) is important for the construction of a general model from first principles. Different conventions exist for the definitions of the VSH in the literature, for example, in atomic physics, or electrodynamics (see Refs. [149] and [323]). For this work, the definitions given by Barrera [324] are modified to the following form
| (A.1) | ||||
| (A.2) | ||||
| (A.3) |
where are standard scalar spherical harmonics [165], and and are the azimuthal and polar quantum numbers, respectively.
These definitions of the VSH can be related to the other forms that appear in the literature. Key examples are as follows
A.2 Properties
Several salient properties of the VSH are now summarised.
First, the VSH are
orthogonal
| (A.10) |
Second, they are orthonormal in Hilbert space
| (A.11) |
The following summation rules apply to dyadic products of the VSH
| (A.12) | ||||
| (A.13) | ||||
| (A.14) |
where represents unit vectors in the basis of the coordinate space.
Appendix B Multilayer Examples
The general formulae presented for the multilayer model in Chapter 4 can be adapted to consider a number of specific scenarios, particularly in terms of the number of dipole sources, their orientation, or if a uniform layer of sources is used. This appendix presents the more detailed derivations of these formulae, which could not be presented in Chapter 4 without compromising the flow of the narrative structure of the thesis.
B.1 Scattered power in the outermost region
The first example involves the derivation of the general formula for the total radiated power of the system. First, the behaviour of the electric and magnetic fields in the far field must be considered. The total transverse parts of the fields in Eq. (4.30) in the outermost region , and for , are given by
| (B.1) |
In the limit of , this equation leads to the following forms for the scattered fields
| (B.2) | ||||
| (B.3) |
In the above equations, the property as has been used. The total scattered power through a sphere of radius can then be calculated:
| (B.4) |
where the orthonormal properties of and functions given in Eq. (A.10) through (A.16) have been used. Note that in the limit of , it can be shown that and [133], and hence
| (B.5) |
The coefficients , , and are known, based on Eqs. (4.44), (4.46), (4.25), and (4.26) respectively. Note that if there is no dipole in the outermost region, then .
B.2 Single dipole embedded in a layer
In this section, the scenario is selected where there is only one dipole in the layer , for . This is useful when comparing simulations with results from embedded nanoparticles [84, 85, 86]. In this case, according to Scenario 2 of Section 4.3, the following field coefficients may be obtained using the transfer matrix approach
| (B.6) | ||||
| (B.7) | ||||
| (B.8) | ||||
| (B.9) |
In addition, the dipole vector introduced in Chapter 4 takes the following form
Thus, the coefficients required for the general formula in Eq. (B.5) can be obtained for this specific case of a single dipole in a layer. For the contributions to the TM modes, it is found that
| (B.14) |
where and . Similarly, for the contributions to the TE modes one may write
| (B.15) |
where and . Equations (B.14) and (B.15) are general, and can be applied to a dipole in any layer , including the outermost layer or the innermost layer .
By considering the forms of the dipole coefficients that appear in Section 4.2.2, the field coefficients and , which appear in the total scattered power of Eq. (B.5), may be found explicitly
| (B.16) | ||||
| (B.17) |
Using the properties of orthonormal functions , , and as stated in Appendix A, in conjunction with Eq. (A.16), the coefficients may be written in the following forms
| (B.18) | ||||
| (B.19) |
where , and are functions of . Hence, the properties of the dyadic products of , , and from Eqs. (A.12) through (A.14) may be used to perform the summation over and simplify the field coefficients that appear in the general formulae of Eq. (B.5)
| (B.20) | ||||
| (B.21) |
Note that the quantities and are the polar components of the polarisation vector . Based on the above equations, the total scattered power from a sphere can be expressed as the sum of the emitted powers due to the normal and transverse components of
| (B.22) |
B.3 Deriving an active layer case
Consider a multilayer structure where one of the layers, , consists of active material. In this context, a uniform distribution of randomly-oriented dipoles, with density is introduced into that layer. As a result, one must integrate Eqs. (B.23) and (B.24) with respect to the variable , which is located within the layer . Since the dipoles are randomly oriented, and the orientations of the constituent dipoles are averaged over the distribution, , one may calculate the normal and transverse components of the emitted power independently, even in the case of an active layer. In the case of the normal component, one finds
| (B.25) |
which can be simplified to a summation over a one-dimensional integral over the shell region that forms the layer
| (B.26) | ||||
| (B.27) |
As explained in Chapter 4, the volume of the shell, , is defined so that if , then is taken to be zero, since the relevant volume is simply a sphere bounded by the innermost radius.
In the case of the transverse component of the power, one may similarly express the result as a summation over a set of one-dimensional integrals, in this case, and
| (B.28) | ||||
| (B.29) | ||||
| (B.30) | ||||
| (B.31) |
The total emitted power then takes the form
| (B.32) |
While this result exactly matches Eq. (4.66), the computation of the integrals may be carried out prior to numerical calculation, using the properties of the Bessel and Hankel functions as follows.
Let the following functional form be defined, which relates the integral over the Bessel and/or Hankel functions to a sequence of terms and their derivatives
| (B.33) |
Here, and can be any of the Riccati-Bessel or Riccati-Hankel functions, or . One may then expand the integrals appearing in Eq. (B.32), beginning with the contributions to the TM modes
| (B.34) |
where and are the radii of the upper and lower interfaces of the region , respectively. The contributions to the TE modes may be calculated in a similar fashion
| (B.35) | ||||
| (B.36) |
With and now known, they may be substituted into Eq. (B.32) in order to calculate the total averaged power for an uniform distribution of dipoles in one of the layers of a multilayer microsphere. This result is computed numerically, and the results are presented in Chapter 4 and Appendix C.
Appendix C Transfer Matrix Method Verification
The active multilayer microsphere model introduced in Chapter 4 has been shown to provide powerful functionality and guidance in examining the properties of whispering gallery modes within resonators.
While the highlights of the results are explained in the body of the thesis, it is important, for due diligence, to outline exactly how the multilayer model has been verified with extant models in the literature. This is achieved by selecting the special cases that correspond to each of the models mentioned throughout the thesis, and described in this appendix. Since the multilayer model is more general than these previous models, prompting its development as a powerful tool for examining a number of resonator designs not easily studied thus far, the comparisons between it and extant models predominantly involves a simplification of the multilayer model, followed by a mathematical check to ensure that identical results are produced.
C.1 Chew model for an unlayered microsphere
Consider the Chew model, from which one is able to calculate the emitted power of an unlayered microsphere in a dielectric medium [132, 143, 136]. The first scenario of interest is the case where a dipole source is placed in the outermost region.
C.1.1 Single dipole in the outermost region
Assume that a dipole source is located in the outermost region, which corresponds to the choice , in the multilayer model. Then, the vector defined in Eq. (4.40) simplifies to
| (C.1) |
Using Eq. (B.14) and (B.15) from Appendix B, one can then find the field coefficients and in this scenario, which take the forms
| (C.2) | ||||
| (C.3) |
Having identified the coefficients , , and , the normal and transverse components of the emitted power simplify to
| (C.4) | ||||
| (C.5) |
Since is defined as , it follows that and . In addition, the scattering matrix takes the form , and hence the continuity condition of Section 4.2.2 can be used to find the ratios
| (C.6) | ||||
| (C.7) | ||||
| (C.8) | ||||
| (C.9) |
Having found the coefficients and , one may directly calculate and . It is found that Eqs. (C.6) and (C.8) are identical to Eqs. (6) and (7) of Ref. [143].
C.1.2 Single dipole in the innermost region
Now assume a dipole is in the innermost region, then , and from Eqs. (4.25), (4.35) and (4.40) it is found that
| (C.10) |
Using Eq. (B.14) and (B.15), the coefficients and can be found
| (C.11) | ||||
| (C.12) |
and similarly
| (C.13) | ||||
| (C.14) |
Now the forms of the scattering matrix, , and its inverse, , can be specified. According to Eq. (4.40), , and hence . As a result, the following simple forms for the coefficients can be found, and . Furthermore, since , and , and hence Eqs. (4.38) and (4.39) can be used to find the matrix element corresponding to the TM modes
| (C.15) | ||||
| (C.16) |
In the same manner, the matrix element corresponding to the TE modes takes the form
| (C.17) | ||||
| (C.18) |
Now that the TE and TM contributions have been simplified from the general transfer matrix approach to a a form composed of Bessel and Hankel functions and their derivatives, the formulae for the normalised emitted powers and may be written
| (C.19) | ||||
| (C.20) | ||||
| (C.21) |
These equations exactly match Eqs. (1), (2) and (3) of Ref. [136], respectively.
C.1.3 Active inner regions
Assume that the inner region is now filled with randomly oriented dipoles. Then, Eqs. (B.32), (B.34), and (B.36) may be used, together with , , , and , calculated in the previous section, to simplify the form of the integral components of the TM modes
| (C.22) |
Note that in the case of a microsphere, is set to zero, as well as all functionals of the form from Eq. (B.33). Similarly, for the TE modes
| (C.23) |
Possessing known forms for and , and substituting into the equation
| (C.24) |
one may check to see if this result is consistent with the Chew model through numerical analysis. A numerical comparison of both the single dipole of both normal and transverse polarisations, and a uniform layer of dipoles, is shown in Fig. C.1. The multilayer model for a single layer matches the microsphere case for a vanishingly small layer coating, or a vanishingly small internal sphere size. Furthermore, it is found that both of these limits converge to within numerical precision.
C.2 Johnson model for an unlayered microsphere
Recall the Johnson model [153] for the mode positions of a microsphere. Setting , and then using Eq. (4.35), the scattering matrix takes the form
| (C.25) |
The elements of the scattering matrix can then be extracted
| (C.26) | ||||
| (C.27) |
By making the assumption that , which is a required condition in the derivation of the Johnson model, the TM and TE resonance conditions, and , lead to the following characteristic equations
| (C.28) | ||||
| (C.29) |

(a)

(b)
Equations. (C.28) and (C.29) exactly match Eqs. (19) and (13) in [41], respectively. Furthermore, these equations are consistent with the formulae for the Mie scattering coefficients as stated in Eq. (4.53) of Ref. [149]. It should be noted that in Eq. (33) of Ref. [133] the labels of the TE and TM modes are interchanged.
C.3 Teraoka-Arnold model for a microsphere with a single layer
In the case of a microsphere coated by a single layer, , and the following form for the scattering matrix, , is found
| (C.30) |
One can find the TM and TE resonances of this coated microsphere by setting and , respectively
| (C.31) | ||||
| (C.32) |
This results in the following characteristic equations for the resonance positions
| (C.33) | ||||
| (C.34) |
where
| (C.35) | ||||
| (C.36) |
The characteristic equations in Eqs. (C.33) and (C.34) exactly match Eq. (7) in [148] and Eq. (10) in [147], respectively. Furthermore, a consistency check is carried out by comparing the mode positions of the spectrum and the behaviour of the positions as a function of layer thickness, for both the multilayer model and the Teraoka-Arnold model.
Consider an example of a silica microsphere, with dispersion included through the Sellmeier equation [227], coated with a single high refractive index layer of the same value as in Ref. [147], . The microsphere is surrounded by water, , and the thickness of the coating is changed from nm to nm. Figure C.2 shows the results obtained from the multilayer model for an electric dipole placed just outside the surface, with normal and transverse orientations considered separately. A range of wavelengths to nm is simulated, and the outer diameter is kept fixed at m. The thin vertical lines marking the position of the resonances, with their corresponding mode numbers and labels, are obtained from the structure resonance positions of Eqs. (4.49) and (4.50) for a two-layer microsphere, setting in the general multilayer formalism. The thick vertical lines indicate the resonance positions obtained from the Teraoka-Arnold model [147, 148], which agree exactly. Note that in the case of the parallel excitation in Fig. C.2(b), there is a small additional contribution from the TM mode, as expected from Eq. (B.24). It is found that in both models there is a systematic shift in the prominent WGM peaks towards higher wavelengths as the thickness of the layer is increased. The free spectral range, however, remains largely unchanged over this range of wavelength values. In the limit , the results match the simple case of the Chew model [143] as anticipated.

(a)

(b)
C.4 Yariv model of scattering for concentric resonators
In the model that has been developed for spherical concentric ‘onion’ resonators [144, 145, 146], denoted the Yariv model, the transfer matrix approach is adopted, and therefore a comparison with the multilayer model introduced in Chapter 4 becomes more straightforward. A crucial difference between the Yariv model and the other models discussed in this thesis is that, in this case, the modes are excited via an incident wave only, and the scattering cross section is considered, rather than the emitted power. Since the incident field takes the form [146]
| (C.37) |
it is clear that the quantum number takes only the values . Therefore, there is no summation, as was performed in the case of Eqs. (B.20) and (B.21). The form of the field coefficients in each layer, however, is consistent with the multilayer model, as can be seen in Eqs. (7a) and (7b) of Ref. [146]
where is an impedance function, and . By recognising that the definition of the transverse VSH, in Refs. [146, 165], is equivalent to the function in Eq. (A.7), the relations among the field coefficients and the values of the fields may be compared to Eqs (4.3) and (4.4) in the multilayer model, and the forms are found to be consistent with each other.
C.5 Algorithm scaling behaviour
The precise implementation of the algorithm for the calculation of the emitted power is presented in the code online (see Appendix E.4). In this version of the code, the summation, , is calculated to an upper bound, , determined by a prescribed tolerance , so that
| (C.50) |
This prescription is sufficient so long as the behavior of is convergent, which is the case unless unstable parameter regions are selected [155]. At each value of , the spherical Bessel and Hankel functions are calculated using their recursion relations [325], and function calls are minimised within the algorithm in order to improve the efficiency of the calculation.
Examples of the scaling behavior of the execution times () for the functions with respect to wavelength, for numbers of layers , and , are shown in Fig. C.3 for a fixed outer diameter of m. The results are fairly insensitive to the layer thickness, allowing Fig. C.3 to be an accurate measure of the execution time for a given number of layers and prescribed tolerance, . Furthermore, it is found that the implementation of the recursion relations results in an improvement of approximately one order of magnitude in the execution time compared to function-call based methods. This represents a significant improvement in the performance efficiency of the algorithm for the calculation of the WGM spectrum from a multilayer resonator.

(a)

(b)

(c)
Appendix D Chemical Compositions of Media
D.1 Standard non-selective yeast media (YEPD)
Yeast Extract Peptone Dextrose (YEPD) agar promotes the growth of Saccharomyces cerevisiae. For more information, see the HiMedia product documentation.
The proportions of the ingredients in solid or powder form are as follows.
agar –
peptone –
dextrose –
Method: A YEPD solution of concentration approximately mg/mL is made with Milli-Q water and placed in an autoclave at C for minutes for sterilisation. The resultant pH at C is .
D.2 MLA algal media
A variety of algae of the family Volvocaceae,
including Eudorina-Pandorina, may be cultivated in MLA media
[273]. For more information, see the
CSIRO media recipes.
MgSOH2O – g
NaNO3 – g
K2HPO4 – g
H3BO3 – g
H2SeO3 – mg
NaHCO3 – g
CaClH2O – g
Vitamins (per 100 mL Milli-Q ):
Biotin – mL primary stock
B – mL primary stock
Thiamine HCl – mg
Vitamin primary stocks (per 100 mL Milli-Q):
Biotin primary stock – mg
B primary stock – mg
Micronutrients (per 800 mL Milli-Q):
Na2EDTA – g (dissolve on low heat)
FeClH2O – g
NaHCO3 – g
MnClH2O – g
Micronutrient primary stocks – mL each
Micronutrient primary stocks (per litre Milli-Q):
CuSOH2O – g
ZnSOH2O – g
CoClH2O – g
Na2MoOH2O – g
Method: Autoclave the distilled water to sterilise. Make up micronutrient stock to litre. Store all stock solutions in a refrigerator at C. Then, prepare MLA 40 concentrated nutrient mixture to mL.
MLA 40 concentrated nutrient mixture (per mL Milli-Q):
MgSOH2O stock – mL
NaNO3 stock – mL
K2HPO4 stock – mL
H3BO3 stock – mL
H2SeO3 stock – mL
Vitamin stock – mL
Micronutrient stock – mL
Filter-sterilise using mm filter into a sterile mL Schott bottle. To make litre of MLA, add mL of Milli-Q water into a sterile litre Schott bottle, add mL of MLA nutrients, mL of NaHCO3 stock, mL of sterile CaClH2O stock and mix well.
D.3 Eudorina-Pandorina geometric analysis
Once algae of the Eudorina-Pandorina genus have been cultivated in sufficient quantity, an analysis on their geometric characteristics is carried out. An example of a sample of the solution containing the Eudorina-Pandorina algae suspended in MLA media is shown in Fig. D.1. This image is used as a representative sample for extracting the geometric parameters of the identifiable particles. The results of the analysis are shown in Table D.1.

See pages 1 of Tv5Asheet1a.pdf
D.4 Paraffin formaldehyde (PFA) oocyte fixing method
One of the most common ways of fixing oocytes and embryos, which essentially entails placing the cells into a permanently storable state and preventing all metabolic activity, is that of washing them in paraffin formaldehyde (PFA). Typically, the cells are placed in PFA of a concentration of between and for approximately minutes at C, and then placed in one of the following handling media.
D.4.1 Phosphate-buffered saline (PBS) media
The handling and storage of mammalian oocytes and embryos can involve a number
of different procedures and media. In this thesis, two methods in particular
are investigated. The zona salt solution, or PBS, represents the first
of these media, and the method for fixing
these cells is as follows. For more information, see
Protocols Online.
KCl – g
Na2HPO4 – g
KH2PO4 – g
Method: litre of PBS media is prepared with mL of Milli-Q water, and sequentially adding the ingredients above. After this has been achieved, add HCl to the mixture so the pH of the solution has decreased to at C. Sterilise using an autoclave for min at C and store at C.
D.4.2 MOPS-buffered wash and bovine serum albumin (BSA)
handling media
The second choice of media for storing mammalian oocytes and embryos
considered in this thesis
is that of a solution composed of (3-(N-morpholino)propanesulfonic
acid (MOPS)-buffered wash11
1
Cook Medical Australia,
Brandl St, Brisbane Technology Park, Eight
Mile Plains, QLD , Australia, Research Vitro Wash, Catalogue
Number: K-RVWA-.
and bovine albumin serum (BSA).
This medium has a lower salt content than PBS, and its recipe is as follows.
BSA – mg/mL
Method: A MOPS-buffered solution of wash medium is diluted to an osmolarity of mOsm. BSA is added to a concentration is mg/mL. The final pH should be in the range to . Live culturing must be handled at C. However, this medium may also be used for fixed cells and stored in a refrigerator at C.
D.5 Chemical annealing - Acidified Tyrode’s Solution
In Section 7.2 of Chapter 7, the method
for thinning or annealing the zona pellucida region
of embryos is described. This can be achieved using other chemical-based
or enzyme-based solutions, exposed to the outer layer of the zona
for a limited time. The predominant chemical-based annealing procedure
uses Acidified Tyrode’s Solution (ATS), whose recipe is as follows [326].
For more information, see the
Origio product datasheet.
KCl – mM
MgCl2 – mM
CaCl2 – mM
Na2HPO4 – mM
NaHCO3 – mM
D-glucose – mM
Appendix E Lists of Publications
The following lists of published journal articles, conference papers and open-source code were produced during the time of candidature, based on work submitted to the degree of Doctor of Philosophy. For more information, visit my academic website: http://drjonathanmmhallfrsa.wordpress.com.
E.1 Peer-reviewed published journal articles
Lead author:
1. “Method for predicting whispering gallery mode spectra of
spherical microresonators”; J. M. M. Hall,
S. Afshar V., M. R. Henderson, A. François, T. Reynolds, N. Riesen,
T. M. Monro; Optics Express, Vol. 23, Issue 8,
pp. 9924-9937 (2015) – in-text Ref. [157];
DOI: http://dx.doi.org/10.1364/OE.23.009924,
web: http://www.opticsinfobase.org/oe/abstract.cfm?uri=oe-23-8-9924 .
2. “Determining the geometric parameters of microbubble
resonators from their spectra”; J. M. M. Hall,
A. François, S. Afshar V., N. Riesen, M. R. Henderson, T. Reynolds,
T. M. Monro;
Journal of the Optical Society of America B 34, pp. 2699-2706 (2017)
– in-text Ref. [109];
DOI: http://doi.org/10.1364/JOSAB.34.002699,
web: https://www.osapublishing.org/josab/abstract.cfm?uri=josab-34-1-44.
3. “Unified theory of whispering gallery multilayer
microspheres with single dipole or active layer sources”;
J. M. M. Hall, T. Reynolds, M. R. Henderson, N. Riesen, T. M. Monro,
S. Afshar, V.; Optics Express, Vol. 25, Issue 6,
pp. 6192-6214 (2017) – in-text Ref. [40];
DOI: http://doi.org/10.1364/OE.25.006192,
web: http://www.osapublishing.org/oe/abstract.cfm?uri=oe-25-6-6192.
Co-author:
4. “Optimization of whispering gallery resonator design for
biosensing applications”; T. Reynolds, M. R. Henderson,
A. François, N. Riesen, J. M. M. Hall, S. Afshar V., S. J.
Nicholls,
T. M. Monro; Optics Express, Vol. 23, Issue 13,
pp. 17067-17076 (2015) – in-text Ref. [115];
DOI: http://dx.doi.org/10.1364/OE.23.017067,
web: http://www.osapublishing.org/oe/abstract.cfm?uri=oe-23-13-17067.
5. “Combining whispering gallery mode lasers and
microstructured optical fibers: limitations, applications and
perspectives for in-vivo biosensing”; A. François, T. Reynolds, N. Riesen,
J. M. M. Hall, M. R. Henderson, E. Zhao, S. Afshar V.
and T. M. Monro; MRS Advances, 2059-8521, pp. 1-12 (2016) –
in-text Ref. [116];
DOI: http://dx.doi.org/10.1557/adv.2016.342,
web: http://journals.cambridge.org/action/displayAbstract?fromPage=online
&aid=10321592&fileId=S205985211600342X.
6. “Fluorescent and lasing whispering gallery mode
microresonators for sensing applications”; T. Reynolds, N. Riesen,
A. Meldrum, X. Fan, J. M. M. Hall, T. M. Monro and A. François;
Laser & Photonics Reviews, 1600265,
– in-text Ref. [95];
DOI: http://dx.doi.org/10.1002/lpor.201600265,
web: http://onlinelibrary.wiley.com/wol1/doi/10.1002/lpor.201600265/full.
E.2 Published conference proceedings
7. “Predicting the whispering gallery mode spectra of
microresonators”; J. M. M. Hall, S. Afshar V.,
M. R. Henderson, A. François, T. Reynolds, N. Riesen, T. M. Monro;
Proc. SPIE 9343, Laser Resonators, Microresonators, and
Beam Control XVII, 93431Y (2015)
– in-text Ref. [158];
DOI: http://dx.doi.org/10.1117/12.2078526,
web: http://proceedings.spiedigitallibrary.org/proceeding.aspx?articleid=2194939.
E.3 Press releases
8. “Shining new light on the body”;
A. Greentree and J. M. M. Hall;
National Computational Infrastructure (NCI),
press release,
web:
http://nci.org.au/research/shining-new-light-on-the-body/.
9. “WGM Laser-Tipped Fiber for Biomedical Applications”;
A. François, S. Afshar V., T. M. Monro, T. Reynolds,
N. Riesen, J. M. M. Hall and M. R. Henderson;
Optics & Photonics News, Year in Optics 2015, Nano-optics,
web:
http://www.osa-opn.org/home/articles/volume_26/december_2015/extras/wgm_laser-tipped_fiber_for_biomedical_applications/#.VmDGrPl94fQ.
E.4 Code produced as part of this thesis
The following directories of original code, produced for this thesis, have been placed online for public availability.
1. FDTD-based toolkit for MEEP:
https://sourceforge.net/projects/npps/files/FDTD_WGM_Simulator —
associated with Refs. [157, 109].
2. Active multilayer microsphere WGM simulator for
MATLAB:
http://www.photonicsimulation.net
— associated with Ref. [40].
E.5 Conferences and workshops organised
In organising the following conferences and workshops, I functioned as the Chair and Founder of the IPAS Science Network (ISN) in the Institute for Photonics and Advanced Sensing (IPAS), Chair of the International Conference on Optics, Atoms & Laser Applications (IONS-KOALA) 2014 Organising Committee, Inaugural Elected Representative of the Faculty of Sciences on the Alumni Council of The University of Adelaide, Secretary of the Optical Society of America (OSA) and International Society for Optical Engineering (SPIE) Adelaide Chapters, Listed Expert of the Australian Science Media Centre (AusSMC) and Committee Member of the SA Branch of the Australian Institute of Physics (AIP) and the Australian Research Council (ARC) Centre for Nanoscale BioPhotonics (CNBP) Early Career Researcher (ECR) Committee. In chronological order:
OSA Scientific Photography Competition 2013, The University of Adelaide, SA, Australia.
IONS-KOALA 2014 Welcome Reception and Opening Address, The University of Adelaide, SA, Australia.
IONS-KOALA 2014 Industry Workshop, representative of the OSA and SPIE, The University of Adelaide, SA, Australia.
IONS-KOALA 2014 Banquet Presentation Day and New Horizons in Science Grant Award Ceremony, McLaren Vale, SA, Australia
IONS-KOALA 2014 Scientific Seminars, Session Chair,
The University of Adelaide, SA, Australia.
OSA / IONS-KOALA Co-sponsored Scientific Photography Competition 2014, The University of Adelaide, SA, Australia.
IONS-KOALA 2014 Closing Address and Prize Ceremony,
The University of Adelaide, SA, Australia.
IPAS Research Presentation Event 2015, Convenor as Chair
of the ISN,
The University of Adelaide, SA, Australia.
Alumni Council Convenor for Alumni Ambassadors and Class Champions 2015, Engagement Branch, The University of Adelaide, SA, Australia.
![[Uncaptioned image]](1709.02534v2/KOALA.jpg)
E.6 Conferences and workshops participated
2014 International Conference on Nanoscience and Nanotechnology (ICONN) / 23 Australian Conference on Microscopy and Microanalysis (ACMM), The University of Adelaide, SA, Australia.
CNBP Inaugural Workshop 2014, The University of Adelaide, SA, Australia.
Australian Nanotechnology Network (ANN) ECR Workshop 2014, University of Technology Sydney (UTS), NSW, Australia: Developing a method for predicting the whispering gallery mode spectrum of micro-resonators.
CNBP Workshop 2014, Macquarie University, NSW, Australia: Living resonators: cells as sensors.
Royal Institution of Australia (RiAus), ECR Grant Writing Workshop, Science Exchange Centre, SA, Australia.
CNBP Annual Retreat 2014, Port Lincoln, SA, Australia:
Towards living cell sensors.
IONS-KOALA 2014, The University of Adelaide, SA,
Australia:
Resonator sensors.
5 Mount Lofty Workshop on Frontier Technologies for Nervous System Function & Repair 2014, Mount Lofty, SA: Contribution to seminar Biophotonics: living resonators, via Prof. Andre Luiten.
University of Adelaide Research Symposium 2014, Cells as Lasers.
IPAS Research Presentation Event, The University of Adelaide, SA, Australia: Toward cell-lasers in biophotonics.
SPIE Photonics West, LASE (Laser Technology and Industrial Laser Conference), Laser Resonators, Microresonators and Beam Control XVII, Moscone Center, San Francisco, CA, USA 2015: Predicting the whispering gallery mode spectra of microresonators.
CNBP ECR Presentation Series 2015, The University of Adelaide, SA, Australia: Living cells: sensors of the future?
ETHOS Australia Pty Ltd Workshop, “Industry engaged research: Seven principles guiding an enduring relationship”, Adelaide, SA, Australia.
Royal Melbourne Institute of Technology (RMIT) CNBP Launch, Melbourne, VIC, Australia.
Commonwealth Scientific and Industrial Research Organisation (CSIRO) and CNBP Partnership Launch, Melbourne, VIC, Australia.
IPAS Scientific Management Committee, Strategic Planning Meeting 2015, The University of Adelaide, SA, Australia.
The Australian and New Zealand Conference on Optics and Photonics (ANZCOP) 2015, The University of Adelaide, SA, Australia: Multilayer resonator sensitivity analysis.
Australian Conference on Optics, Lasers and Spectroscopy (ACOLS) 2015, The University of Adelaide, SA, Australia: Microbubble resonator simulation using FDTD.
40 Australian Conference on Optical Fibre Technology (ACOFT) 2015, The University of Adelaide, SA: Contribution to seminar Combining whispering gallery mode lasers and microstructured optical fibres for in-vivo biosensing applications, via Dr. Alexandre François.
Innovation Voucher Program Workshop 2016, Flinders University, Tonsley, SA, Australia.
CNBP Annual Retreat 2015, Lake Macquarie, NSW, Australia: Biolaser.
Contribution to seminar Unlocking the secrets within, using light - from wine to embryos, via Prof. Tanya Monro, The Shine Dome, Acton, ACT, Australia.
Robinson Research Institute in reproductive health, group research presentation, CNBP, SA, Australia.
ACOFT 2016, The Australian National University (ANU), Canberra, ACT, Australia: Contribution to seminar A Unified Model for Active Multilayer Microsphere Resonators, via Assoc. Prof. Shahraam Afshar V.
SPIE BioPhotonics Australasia 2016, Adelaide Convention Centre, SA, Australia.
CNBP Annual Retreat 2016, Victor Harbor, SA, Australia: Towards an Embryo Laser.
CSIRO ON Prime Pre-Accelerator Program 2016, Australian Technology Park, Sydney, NSW, Australia.
Australian eChallenge Venture Showcase 2016, Adelaide Convention Centre, SA, Australia.
E.7 Journals - acting as reviewer
Applied Optics (OSA)
The Journal of the Optical Society of America A (OSA)
Optics Express (OSA)
IEEE Photonics Technology Letters
Physical Review Letters, American Physical Society (APS)
Physical Review A, C and D (APS)
E.8 Grants and funding
ARC Laureate Scholarship 2014-2017.
ANN Invited Presenter Travel Grant, UTS, 2014.
ISN Funding 2014-2016 - $10,000 p.a.
IONS-KOALA 2014 Institutional and Industry
Sponsorship - $56,000 + in-kind support:
Gold sponsor:
OSA;
Silver sponsors:
SPIE, The ARC Centre of Excellence in Ultrahigh
Bandwidth Devices for Optical Systems (CUDOS - Universities of
Sydney, Macquarie, Monash, Swinburne, RMIT, UTS and ANU),
The Centre for Micro-Photonics: Swinburne University of Technology,
MQ Photonics: Macquarie University, Lastek Pty Ltd (Industry),
IPAS, CNBP and The Australian Optical Society (AOS);
Bronze sponsors:
The AIP National Executive, Maptek (Industry),
Coherent Scientific (Industry), Grey Innovation Technology
Commercialisation (Industry), The Photon Factory: University of Auckland
(New Zealand), Edmund Optics (Industry), NewSpec (Industry), Griffith
University, The ARC T-ray Facility, School of Electrical & Electronic
Engineering (The University of Adelaide) and The Department of State
Development (DSD) (formerly Department for Manufacturing, Innovation, Trade,
Resources and Energy (DMITRE)), Government of South Australia.
Auxilliary sponsors:
Photon Scientific (Industry), Melbourne
School of Physical Sciences (formerly
School of Chemistry and Physics, The University of Adelaide);
Travel grant sponsors:
OSA, Lastek Pty Ltd, IPAS and The New Zealand Institute of Physics.
IPAS Pilot Project Scheme 2016 - $5,000.
E.9 Recognition and presentations
Election to the Alumni Council of The University of Adelaide as Representative for the Faculty of Sciences 2014-2015.
Australian Academy of Science EMCR Forum Nomination 2014.
Australian Academy of Science Young Tall Poppy Award Nomination 2015.
IPAS Research Presentation Awards 2016 - Honourable Mention.
Australian eChallenge 2016 - Research Commercialisation 1 Prize - $10,000.
Australian eChallenge 2016 - Medical Innovations 1 Prize - $10,000.
References
- [1]
National Academy of Engineering,
National Academy of Sciences, Policy
and Global Affairs, Institute of Medicine, Committee on Science,
Engineering and Public Policy, and Committee on Facilitating
Interdisciplinary Research, Facilitating Interdisciplinary Research (National Academies, 2005). - [2] R. W. Boyd and J. E. Heebner, “Sensitive disk resonator photonic biosensor,” Appl. Opt. 40, 5742–5747 (2001).
- [3] S. Arnold, M. Khoshsima, I. Teraoka, S. Holler, and F. Vollmer, “Shift of whispering-gallery modes in microspheres by protein adsorption,” Opt. Lett. 28, 272–274 (2003).
- [4] A. Ksendzov and Y. Lin, “Integrated optics ring-resonator sensors for protein detection,” Opt. Lett. 30, 3344–3346 (2005).
- [5] H. Quan and Z. Guo, “Simulation of whispering-gallery-mode resonance shifts for optical miniature biosensors,” J. Quant. Spectrosc. Radiat. Transfer 93, 231–243 (2005).
- [6] H. Zhu, J. D. Suter, I. M. White, and X. Fan, “Aptamer based microsphere biosensor for thrombin detection,” Sensors (Basel) 6, 785–795 (2006).
- [7] H.-C. Ren, F. Vollmer, S. Arnold, and A. Libchaber, “High-Q microsphere biosensor - analysis for adsorption of rodlike bacteria,” Opt. Express 15, 17410–17423 (2007).
- [8] A. Weller, F. Liu, R. Dahint, and M. Himmelhaus, “Whispering gallery mode biosensors in the low-Q limit,” Appl. Phys. B 90, 561–567 (2008).
- [9] J. D. Suter, I. M. White, H. Zhu, H. Shi, C. W. Caldwell, and X. Fan, “Label-free quantitative DNA detection using the liquid core optical ring resonator,” Biosens. Bioelectron. 23, 1003–1009 (2008).
- [10] A. François and M. Himmelhaus, “Whispering gallery mode biosensor operated in the stimulated emission regime,” Appl. Phys. Lett. 94, 031101 (2009).
- [11] L. Huang and Z. Guo, “Biosensing in a microelectrofluidic system using optical whispering-gallery mode spectroscopy,” Biomicrofluidics 5 (2011).
- [12] K. A. Wilson, C. A. Finch, P. Anderson, F. Vollmer, and J. J. Hickman, “Whispering gallery mode biosensor quantification of fibronectin adsorption kinetics onto alkylsilane monolayers and interpretation of resultant cellular response,” Biomaterials 33, 225–236 (2012).
- [13] F. Vollmer and L. Yang, “Label-free detection with high-Q microcavities: a review of biosensing mechanisms for integrated devices,” Nanophotonics pp. 267–291 (2012).
- [14] M. D. Baaske, M. R. Foreman, and F. Vollmer, “Single-molecule nucleic acid interactions monitored on a label-free microcavity biosensor platform,” Nat. Nanotechnol. 9, 933–939 (2014).
- [15] F. Vollmer and S. Arnold, “Whispering-gallery-mode biosensing: Label-free detection down to single molecules,” Nat. Methods 5, 591–596 (2008).
- [16] F. Vollmer, D. Braun, A. Libchaber, M. Khoshsima, I. Teraoka, and S. Arnold, “Protein detection by optical shift of a resonant microcavity,” Appl. Phys. Lett. 80, 4057–4059 (2002).
- [17] F. Vollmer, S. Arnold, and D. Keng, “Single virus detection from the reactive shift of a whispering-gallery mode,” Proc. Natl. Acad. Sci. U.S.A. 105, 20701–20704 (2008).
- [18] A. M. Armani, R. P. Kulkarni, S. E. Fraser, R. C. Flagan, and K. J. Vahala, “Label-free, single-molecule detection with optical microcavities,” Science 317, 783–787 (2007).
- [19] D. T. Nguyen and R. A. Norwood, “Label-free, single-object sensing with a microring resonator: FDTD simulation,” Opt. Express 21, 49–59 (2013).
- [20] A. C. Romano, E. M. Espana, S. H. Yoo, M. T. Budak, J. M. Wolosin, and S. C. G. Tseng, “Different cell sizes in human limbal and central corneal basal epithelia measured by confocal microscopy and flow cytometry,” Invest. Ophthalmol. Vis. Sci. 44, 5125 (2003).
- [21] C. W. Freudiger, W. Min, B. G. Saar, S. Lu, G. R. Holtom, C. He, J. C. Tsai, J. X. Kang, and X. S. Xie, “Label-free biomedical imaging with high sensitivity by stimulated raman scattering microscopy,” Science 322, 1857–1861 (2008).
- [22] J. Emmelkamp, F. Wolbers, H. Andersson, R. S. DaCosta, B. C. Wilson, I. Vermes, and A. van den Berg, “The potential of autofluorescence for the detection of single living cells for label-free cell sorting in microfluidic systems,” Electrophoresis 25, 3740–3745 (2004).
- [23] H. Shao, D. Kumar, and K. L. Lear, “Single-cell detection using optofluidic intracavity spectroscopy,” IEEE Sens. J. 6, 1543–1550 (2006).
- [24] S. Kita, S. Hachuda, S. Otsuka, T. Endo, Y. Imai, Y. Nishijima, H. Misawa, and T. Baba, “Super-sensitivity in label-free protein sensing using a nanoslot nanolaser,” Opt. Express 19, 17683–17690 (2011).
- [25] T. Endo, K. Kerman, N. Nagatani, Y. Takamura, and E. Tamiya, “Label-free detection of peptide nucleic acid- DNA hybridization using localized surface plasmon resonance based optical biosensor,” Anal. Chem. 77, 6976–6984 (2005).
- [26] F. C. Dudak and İ. H. Boyacı, “Rapid and label-free bacteria detection by surface plasmon resonance (SPR) biosensors,” Biotechnol. J. 4, 1003–1011 (2009).
- [27] W. Liang, A. A. Savchenkov, A. B. Matsko, V. S. Ilchenko, D. Seidel, and L. Maleki, “Generation of near-infrared frequency combs from a MgF2 whispering gallery mode resonator,” Opt. Lett. 36, 2290–2292 (2011).
- [28] M. Li, X. Wu, L. Liu, and L. Xu, “Kerr parametric oscillations and frequency comb generation from dispersion compensated silica micro-bubble resonators,” Opt. Express 21, 16908–16913 (2013).
- [29] N. Riesen, S. Afshar V., A. François, and T. M. Monro, “Material candidates for optical frequency comb generation in microspheres,” Opt. Express 23, 14784–14795 (2015).
- [30] A. Schliesser and T. J. Kippenberg, “Chapter 5 - Cavity optomechanics with whispering-gallery mode optical micro-resonators,” in “Advances in Atomic, Molecular, and Optical Physics,” vol. 58, E. A. Paul Berman and C. Lin, eds. (Academic, 2010), pp. 207–323.
- [31] W. von Klitzing, R. Long, V. S. Ilchenko, J. Hare, and V. Lefèvre-Seguin, “Tunable whispering gallery modes for spectroscopy and CQED experiments,” New J. Phys. 3, 14 (2001).
- [32] Y. Louyer, D. Meschede, and A. Rauschenbeutel, “Tunable whispering-gallery-mode resonators for cavity quantum electrodynamics,” Phys. Rev. A 72, 031801 (2005).
- [33] Y. F. Xiao, B. Min, X. Jiang, C. H. Dong, and L. Yang, “Coupling whispering-gallery-mode microcavities with modal coupling mechanism,” IEEE J. Quant. Electron. 44, 1065–1070 (2008).
- [34] D. L. McAuslan, D. Korystov, and J. J. Longdell, “Coherent spectroscopy of rare-earth-metal-ion-doped whispering-gallery-mode resonators,” Phys. Rev. A 83, 063847 (2011).
- [35] V. N. Astratov, J. P. Franchak, and S. P. Ashili, “Optical coupling and transport phenomena in chains of spherical dielectric microresonators with size disorder,” Appl. Phys. Lett. 85, 5508–5510 (2004).
- [36] K. W. Allen, A. Darafsheh, F. Abolmaali, N. Mojaverian, N. I. Limberopoulos, A. Lupu, and V. N. Astratov, “Microsphere-chain waveguides: Focusing and transport properties,” Appl. Phys. Lett. 105, 021112 (2014).
- [37] Y. He, H. Deng, X. Jiao, S. He, J. Gao, and X. Yang, “Infrared perfect absorber based on nanowire metamaterial cavities,” Opt. Lett. 38, 1179–1181 (2013).
- [38] C. Qu and E. C. Kinzel, “Polycrystalline metasurface perfect absorbers fabricated using microsphere photolithography,” Opt. Lett. 41, 3399–3402 (2016).
- [39] J. Geng, R. W. Ziolkowski, R. Jin, and X. Liang, “Numerical study of the near-field and far-field properties of active open cylindrical coated nanoparticle antennas,” IEEE Photon. J. 3, 1093–1110 (2011).
- [40] J. M. M. Hall, T. Reynolds, M. R. Henderson, N. Riesen, T. M. Monro, and S. Afshar, “Unified theory of whispering gallery multilayer microspheres with single dipole or active layer sources,” Opt. Express 25, 6192–6214 (2017).
- [41] I. Teraoka and S. Arnold, “Theory of resonance shifts in TE and TM whispering gallery modes by nonradial perturbations for sensing applications,” J. Opt. Soc. Am. B 23, 1381–1389 (2006).
- [42] K. J. Vahala, “Optical microcavities,” Nature 424, 839–846 (2003).
- [43] B. D. Jones, M. Oxborrow, V. N. Astratov, M. Hopkinson, A. Tahraoui, M. S. Skolnick, and A. M. Fox, “Splitting and lasing of whispering gallery modes in quantum dot micropillars,” Opt. Express 18, 22578–22592 (2010).
- [44] M. Sumetsky, “Whispering-gallery-bottle microcavities: the three-dimensional etalon,” Opt. Lett. 29, 8–10 (2004).
- [45] Q. Lu, X. Wu, L. Liu, and L. Xu, “Mode-selective lasing in high-Q polymer micro bottle resonators,” Opt. Express 23, 22740–22745 (2015).
- [46] Y. Wang, K. Zhang, S. Zhou, Y.-H. Wu, M.-B. Chi, and P. Hao, “Coupled-mode induced transparency in a bottle whispering-gallery-mode resonator,” Opt. Lett. 41, 1825–1828 (2016).
- [47] D. K. Armani, T. J. Kippenberg, S. M. Spillane, and K. J. Vahala, “Ultra-high-Q toroid microcavity on a chip,” Nature 421, 925–928 (2003).
- [48] S. L. McCall, A. F. J. Levi, R. E. Slusher, S. J. Pearton, and R. A. Logan, “Whispering-gallery mode microdisk lasers,” Appl. Phys. Lett. 60, 289–291 (1992).
- [49] J. Wiersig, “Structure of whispering-gallery modes in optical microdisks perturbed by nanoparticles,” Phys. Rev. A 84, 063828 (2011).
- [50] P. S. Kuo, W. Fang, and G. S. Solomon, “-quasi-phase-matched interactions in GaAs microdisk cavities,” Opt. Lett. 34, 3580 (2009).
- [51] J.-F. Ku, Q.-D. Chen, R. Zhang, and H.-B. Sun, “Whispering-gallery-mode microdisk lasers produced by femtosecond laser direct writing,” Opt. Lett. 36, 2871–2873 (2011).
- [52] E. F. Franchimon, K. R. Hiremath, R. Stoffer, and M. Hammer, “Interaction of whispering gallery modes in integrated optical micro-ring or -disk circuits: Hybrid CMT model,” J. Opt. Soc. Am. B 30, 1048–1057 (2013).
- [53] H.-Y. Ryu, M. Notomi, G.-H. Kim, and Y.-H. Lee, “High quality-factor whispering-gallery mode in the photonic crystal hexagonal disk cavity,” Opt. Express 12, 1708–1719 (2004).
- [54] H.-Y. Ryu, M. Notomi, Y.-H. Lee, G.-H. Kim, and G. H. Song, “High-Q whispering-gallery mode in the photonic crystal hexagonal cavity,” Proc. SPIE 5356, 21–30 (2004).
- [55] P.-T. Lee, T.-W. Lu, F.-M. Tsai, T.-C. Lu, and H.-C. Kuo, “Whispering gallery mode of modified octagonal quasiperiodic photonic crystal single-defect microcavity and its side-mode reduction,” Appl. Phys. Lett. 88, 201104 (2006).
- [56] P.-T. Lee, T.-W. Lu, and F.-M. Tsai, “Octagonal quasi-photonic crystal single-defect microcavity with whispering gallery mode and condensed device size,” IEEE Photon. Technol. Lett. 19, 710–712 (2007).
- [57] F. Valdivia-Valero and M. Nieto-Vesperinas, “Whispering gallery mode propagation in photonic crystals in front of subwavelength slit arrays: Interplay with extraordinary transmission,” Opt. Commun. 284, 1726–1733 (2011).
- [58] G.-Y. Liu, Y.-Q. Ning, X.-D. Qi, Y. Zhang, Z.-F. Wang, X. Zhang, J.-J. Shi, L.-S. Zhang, W. Wang, Y.-F. Sun, J.-J. Cui, L. Qin, Y. Liu, and L. Wang, “Study of whispering-gallery-mode in a photonic crystal microcavity,” Optoelectron. Lett. 7, 105–108 (2011).
- [59] Y.-L. Pan and R. K. Chang, “Highly efficient prism coupling to whispering gallery modes of a square cavity,” Appl. Phys. Lett. 82, 487–489 (2003).
- [60] H.-J. Moon, K. An, and J.-H. Lee, “Single spatial mode selection in a layered square microcavity laser,” Appl. Phys. Lett. 82, 2963–2965 (2003).
- [61] H.-J. Moon, S.-P. Sun, G.-W. Park, J.-H. Lee, and K. An, “Whispering gallery mode lasing in a gain-coated square microcavity with round corners,” Jpn. J. Appl. Phys. 42, L652 (2003).
- [62] Y.-Z. Huang, K.-J. Che, Y.-D. Yang, S.-J. Wang, Y. Du, and Z.-C. Fan, “Directional emission InP/GaInAsP square-resonator microlasers,” Opt. Lett. 33, 2170–2172 (2008).
- [63] M.-Y. Tang, S.-S. Sui, Y.-D. Yang, J.-L. Xiao, Y. Du, and Y.-Z. Huang, “Mode selection in square resonator microlasers for widely tunable single mode lasing,” Opt. Express 23, 27739–27750 (2015).
- [64] L. Tong, R. R. Gattass, J. B. Ashcom, S. He, J. Lou, M. Shen, I. Maxwell, and E. Mazur, “Subwavelength-diameter silica wires for low-loss optical wave guiding,” Nature 426, 816–819 (2003).
- [65] S. Afshar V., M. R. Henderson, A. D. Greentree, B. C. Gibson, and T. M. Monro, “Self-formed cavity quantum electrodynamics in coupled dipole cylindrical-waveguide systems,” Opt. Express 22, 11301–11311 (2014).
- [66] Y. Ruan, K. Boyd, H. Ji, A. François, H. Ebendorff-Heidepriem, J. Munch, and T. M. Monro, “Tellurite microspheres for nanoparticle sensing and novel light sources,” Opt. Express 22, 11995–12006 (2014).
- [67] S. M. Wildgen and R. C. Dunn, “Whispering gallery mode resonators for rapid label-free biosensing in small volume droplets,” Biosensors 5, 118–130 (2015).
- [68] X. Liu, S. T. Ha, Q. Zhang, M. de la Mata, C. Magen, J. Arbiol, T. C. Sum, and Q. Xiong, “Whispering gallery mode lasing from hexagonal shaped layered lead iodide crystals,” ACS Nano 9, 687–695 (2015).
- [69] M. Förtsch, G. Schunk, J. U. Fürst, D. Strekalov, T. Gerrits, M. J. Stevens, F. Sedlmeir, H. G. L. Schwefel, S. W. Nam, G. Leuchs, and C. Marquardt, “Highly efficient generation of single-mode photon pairs from a crystalline whispering-gallery-mode resonator source,” Phys. Rev. A 91, 023812 (2015).
- [70] V. S. Ilchenko, A. A. Savchenkov, A. B. Matsko, and L. Maleki, “Nonlinear optics and crystalline whispering gallery mode cavities,” Phys. Rev. Lett. 92, 043903 (2004).
- [71] I. S. Grudinin, A. B. Matsko, A. A. Savchenkov, D. Strekalov, V. S. Ilchenko, and L. Maleki, “Ultra high Q crystalline microcavities,” Opt. Commun. 265, 33–38 (2006).
- [72] I. S. Grudinin, A. B. Matsko, and L. Maleki, “On the fundamental limits of Q factor of crystalline dielectric resonators,” Opt. Express 15, 3390–3395 (2007).
- [73] J. Pfeifle, A. Coillet, R. Henriet, K. Saleh, P. Schindler, C. Weimann, W. Freude, I. V. Balakireva, L. Larger, C. Koos, and Y. K. Chembo, “Optimally coherent Kerr combs generated with crystalline whispering gallery mode resonators for ultrahigh capacity fiber communications,” Phys. Rev. Lett. 114, 093902 (2015).
- [74] C.-Y. Chao and L. J. Guo, “Biochemical sensors based on polymer microrings with sharp asymmetrical resonance,” Appl. Phys. Lett. 83, 1527–1529 (2003).
- [75] A. François, N. Riesen, H. Ji, S. Afshar V., and T. M. Monro, “Polymer based whispering gallery mode laser for biosensing applications,” Appl. Phys. Lett. 106, 031104 (2015).
- [76] T. Wienhold, S. Kraemmer, S. F. Wondimu, T. Siegle, U. Bog, U. Weinzierl, S. Schmidt, H. Becker, H. Kalt, T. Mappes, S. Koeber, and C. Koos, “All-polymer photonic sensing platform based on whispering-gallery mode microgoblet lasers,” Lab Chip 15, 3800–3806 (2015).
- [77] C. Uzoigwe, “The human erythrocyte has developed the biconcave disc shape to optimise the flow properties of the blood in the large vessels,” Med. Hypotheses 67, 1159–1163 (2006).
- [78] M. L. Gorodetsky and V. S. Ilchenko, “Optical microsphere resonators: optimal coupling to high-Q whispering-gallery modes,” J. Opt. Soc. Am. B 16, 147–154 (1999).
- [79] V. Braginsky, M. Gorodetsky, and V. Ilchenko, “Quality-factor and nonlinear properties of optical whispering-gallery modes,” Physics Letters A 137, 393–397 (1989).
- [80] Z. Guo, H. Quan, and S. Pau, “Near-field gap effects on small microcavity whispering-gallery mode resonators,” J. Phys. D: Appl. Phys. 39, 5133 (2006).
- [81] D. Xiao-Wei, L. Shao-Hua, F. Su-Chun, X. Ou, and J. Shui-Sheng, “All-fibre micro-ring resonator based on tapered microfibre,” Chin. Phys. B 17, 1029 (2008).
- [82] F. Monifi, S. Odemir, J. Friedlein, and L. Yang, “Encapsulation of a fiber taper coupled microtoroid resonator in a polymer matrix,” IEEE Photon. Technol. Lett. 25, 1458–1461 (2013).
- [83] J. C. Knight, G. Cheung, F. Jacques, and T. A. Birks, “Phase-matched excitation of whispering-gallery-mode resonances by a fiber taper,” Opt. Lett. 22, 1129–1131 (1997).
- [84] J. J. Kaufman, G. Tao, S. Shabahang, E.-H. Banaei, D. S. Deng, X. Liang, S. G. Johnson, Y. Fink, and A. F. Abouraddy, “Structured spheres generated by an in-fibre fluid instability,” Nature (2012).
- [85] V. S. Ilchenko, A. M. Bennett, P. Santini, A. A. Savchenkov, A. B. Matsko, and L. Maleki, “Whispering gallery mode diamond resonator,” Opt. Lett. 38, 4320–4323 (2013).
- [86] G. Tao, J. J. Kaufman, S. Shabahang, R. Rezvani Naraghi, S. V. Sukhov, J. D. Joannopoulos, Y. Fink, A. Dogariu, and A. F. Abouraddy, “Digital design of multimaterial photonic particles,” Proc. Nat. Acad. Sci. U.S.A. 113, 6839–6844 (2016).
- [87] E. Nuhiji, F. G. Amar, H. Wang, N. Byrne, T.-L. Nguyen, and T. Lin, “Whispering gallery mode emission generated in tunable quantum dot doped glycerol/water and ionic liquid/water microdroplets formed on a superhydrophobic coating,” J. Mater. Chem. 21, 10823–10828 (2011).
- [88] N. V. Kryzhanovskaya, M. V. Maximov, and A. E. Zhukov, “Whispering-gallery mode microcavity quantum-dot lasers,” IEEE J. Quant. Electron. 44, 189–200 (2014).
- [89] M. Gupta, D. K. Maity, S. K. Nayak, and A. K. Ray, “Modulation of photophysics and photostability of cationic coumarin 1 dye upon inclusion with macrocyclic host cucurbit[7]uril,” J. Photochem. Photobiol. A 300, 15–21 (2015).
- [90] O. Redy-Keisar, K. Huth, U. Vogel, B. Lepenies, P. H. Seeberger, R. Haag, and D. Shabat, “Enhancement of fluorescent properties of near-infrared dyes using clickable oligoglycerol dendrons,” Org. Biomol. Chem. 13, 4727–4732 (2015).
- [91] G. Niu, W. Liu, J. Wu, B. Zhou, J. Chen, H. Zhang, J. Ge, Y. Wang, H. Xu, and P. Wang, “Aminobenzofuran-fused rhodamine dyes with deep-red to near-infrared emission for biological applications,” J. Org. Chem. 80, 3170–3175 (2015).
- [92] Y. S. L. V. Narayana, D. Venkatakrishnarao, A. Biswas, M. A. Mohiddon, N. Viswanathan, and R. Chandrasekar, “Visible-near-infrared range whispering gallery resonance from photonic -sphere cavities self-assembled from a blend of polystyrene and poly[4,7-bis(3-octylthiophene-2-yl)benzothiadiazole-co-2,6-bis(pyrazolyl)pyridine] coordinated to Tbacac,” ACS Appl. Mater. Interfaces 8, 952–958 (2016).
- [93] X. Lin, Y. Fang, L. Zhu, J. Zhang, G. Huang, J. Wang, and Y. Mei, “Self-rolling of oxide nanomembranes and resonance coupling in tubular optical microcavity,” Adv. Opt. Mater. 4, 936–942 (2016).
- [94] A. François, T. Reynolds, and T. M. Monro, “A fiber-tip label-free biological sensing platform: a practical approach toward in-vivo sensing,” Sensors (Basel) 15, 1168–1181 (2015).
- [95] T. Reynolds, N. Riesen, A. Meldrum, X. Fan, J. M. M. Hall, T. M. Monro, and A. François, “Fluorescent and lasing whispering gallery mode microresonators for sensing applications,” Laser Photon. Rev. 1600265 (2017).
- [96] C. G. B. Garrett, W. Kaiser, and W. L. Bond, “Stimulated emission into optical whispering modes of spheres,” Phys. Rev. 124, 1807–1809 (1961).
- [97] E. M. Purcell, H. C. Torrey, and R. V. Pound, “Resonance absorption by nuclear magnetic moments in a solid,” Phys. Rev. 69, 37–38 (1946).
- [98] H. Benisty, J. Gérard, R. Houdré, J. Rarity, and C. Weisbuch, Confined Photon Systems: Fundamentals and Applications, Lecture Notes in Physics (Springer Berlin Heidelberg, 1999).
- [99] T. Baba and D. Sano, “Low-threshold lasing and Purcell effect in microdisk lasers at room temperature,” IEEE J. Sel. Top. Quantum Electron. 9, 1340–1346 (2003).
- [100] J. Zhu, Ş. K. Özdemir, H. Yilmaz, B. Peng, M. Dong, M. Tomes, T. Carmon, and L. Yang, “Interfacing whispering-gallery microresonators and free space light with cavity enhanced Rayleigh scattering,” Sci. Rep. 4 (2014). Article.
- [101] International Agency for Research on Cancer, IARC Monograph on th Evaluation of Carcinogenic Risk to Humans, vol. 99 (World Health Organisation, 2010).
- [102] V. Duong Ta, R. Chen, L. Ma, Y. Jun Ying, and H. Dong Sun, “Whispering gallery mode microlasers and refractive index sensing based on single polymer fiber,” Laser Photon. Rev. 7, 133–139 (2013).
- [103] C. L. Linslal, M. Kailasnath, S. Mathew, T. K. Nideep, P. Radhakrishnan, V. P. N. Nampoori, and C. P. G. Vallabhan, “Tuning whispering gallery lasing modes from polymer fibers under tensile strain,” Opt. Lett. 41, 551–554 (2016).
- [104] S. K. Vanga and A. A. Bettiol, “Proton beam writing of dye doped polymer microlasers,” Nucl. Instrum. Meth. B 348, 209–212 (2015).
- [105] H. Chandrahalim and X. Fan, “Reconfigurable solid-state dye-doped polymer ring resonator lasers,” Sci. Rep. 5, 18310 (2015).
- [106] M. Saito, H. Shimatani, and H. Naruhashi, “Tunable whispering gallery mode emission from a microdroplet in elastomer,” Opt. Express 16, 11915–11919 (2008).
- [107] M. Himmelhaus and A. François, “In-vitro sensing of biomechanical forces in live cells by a whispering gallery mode biosensor,” Biosens. Bioelectron. 25, 418–427 (2009).
- [108] M. Himmelhaus, “Microsensors on the fly,” Optik Photonik 11, 43–47 (2016).
- [109] J. M. M. Hall, A. François, S. Afshar V., N. Riesen, M. R. Henderson, T. Reynolds, and T. M. Monro, “Determining the geometric parameters of microbubble resonators from their spectra,” J. Opt. Soc. Am. B 34, 2699–2706 (2017).
- [110] V. R. Dantham, S. Holler, C. Barbre, D. Keng, V. Kolchenko, and S. Arnold, “Label-free detection of single protein using a nanoplasmonic-photonic hybrid microcavity,” Nano. Lett. 13, 3347–3351 (2013).
- [111] S. I. Shopova, R. Rajmangal, S. Holler, and S. Arnold, “Plasmonic enhancement of a whispering-gallery-mode biosensor for single nanoparticle detection,” Appl. Phys. Lett. 98, 243104 (2011).
- [112] M. Baaske and F. Vollmer, “Optical resonator biosensors: Molecular diagnostic and nanoparticle detection on an integrated platform,” ChemPhysChem 13, 427–436 (2012).
- [113] M. Schubert, A. Steude, P. Liehm, N. M. Kronenberg, M. Karl, E. C. Campbell, S. J. Powis, and M. C. Gather, “Lasing within live cells containing intracellular optical microresonators for barcode-type cell tagging and tracking,” Nano Letters 15, 5647–5652 (2015).
- [114] M. Humar and S. Hyun Yun, “Intracellular microlasers,” Nat. Photon. 9, 572–576 (2015).
- [115] T. Reynolds, M. R. Henderson, A. François, N. Riesen, J. M. M. Hall, S. Afshar V., S. J. Nicholls, and T. M. Monro, “Optimization of whispering gallery resonator design for biosensing applications,” Opt. Express 23, 17067–17076 (2015).
- [116] A. François, T. Reynolds, N. Riesen, J. M. M. Hall, M. R. Henderson, E. Zhao, S. Afshar V., and T. M. Monro, “Combining whispering gallery mode lasers and microstructured optical fibers: limitations, applications and perspectives for in-vivo biosensing,” MRS Advances 1, 2309–2320 (2016).
- [117] J. Zhu, S. K. Özdemir, Y.-F. Xiao, L. Li, L. He, D.-R. Chen, and L. Yang, “On-chip single nanoparticle detection and sizing by mode splitting in an ultrahigh-Q microresonator,” Nat. Photon. 4, 46–49 (2010).
- [118] N. Riesen, T. Reynolds, A. François, M. R. Henderson, and T. M. Monro, “Q-factor limits for far-field detection of whispering gallery modes in active microspheres,” Opt. Express 23, 28896–28904 (2015).
- [119] A. François, N. Riesen, K. Gardner, T. M. Monro, and A. Meldrum, “Lasing of whispering gallery modes in optofluidic microcapillaries,” Opt. Express 24, 12466–12477 (2016).
- [120] M. M. Karow, P. Munnelly, T. Heindel, M. Kamp, S. Höfling, C. Schneider, and S. Reitzenstein, “On-chip light detection using monolithically integrated quantum dot micropillars,” Appl. Phys. Lett. 108, 081110 (2016).
- [121] L.-J. Chen, L.-L. Gong, Y.-L. Lin, X.-Y. Jin, H.-Y. Li, S.-S. Li, K.-J. Che, Z.-P. Cai, and C. J. Yang, “Microfluidic fabrication of cholesteric liquid crystal core-shell structures toward magnetically transportable microlasers,” Lab Chip 16, 1206–1213 (2016).
- [122] Y. Ding, H. Fan, X. Zhang, X. Jiang, and M. Xiao, “Ultralow-threshold neodymium-doped microsphere lasers on a silicon chip,” Optics Communications (2016).
- [123] S. Yakunin, L. Protesescu, F. Krieg, M. I. Bodnarchuk, G. Nedelcu, M. Humer, G. De Luca, M. Fiebig, W. Heiss, and M. V. Kovalenko, “Low-threshold amplified spontaneous emission and lasing from colloidal nanocrystals of caesium lead halide perovskites,” Nat. Commun. 6, 8056 (2015). Article.
- [124] H. Fan, X. Jiang, Y. Ding, and M. Xiao, “Demonstration of ultralow-threshold 2 micrometer microlasers on chip,” Sci. China Phys. Mech. Astron. 58, 114204 (2015).
- [125] Y. Huang and Y. Y. Lu, “Efficient method for lasing eigenvalue problems of periodic structures,” J. Mod. Opt. 61, 390–396 (2014).
- [126] E. I. Smotrova and A. I. Nosich, “Mathematical study of the two-dimensional lasing problem for the whispering-gallery modes in a circular dielectric microcavity,” Opt. Quant. Electron. 36, 213–221 (2004).
- [127] S.-W. Chang, Modeling of Micro and Nanolaser Cavities (Springer Netherlands, Dordrecht, 2015), pp. 361–376.
- [128] V. Sandoghdar, F. Treussart, J. Hare, V. Lefèvre-Seguin, J. M. Raimond, and S. Haroche, “Very low threshold whispering-gallery-mode microsphere laser,” Phys. Rev. A 54, R1777–R1780 (1996).
- [129] S. M. Spillane, T. J. Kippenberg, and K. J. Vahala, “Ultralow-threshold Raman laser using a spherical dielectric microcavity,” Nature 415, 621–623 (2002).
- [130] D. J. Gargas, M. C. Moore, A. Ni, S.-W. Chang, Z. Zhang, S.-L. Chuang, and P. Yang, “Whispering gallery mode lasing from zinc oxide hexagonal nanodisks,” ACS Nano 4, 3270–3276 (2010).
- [131] J.-R. Carrier, M. Boissinot, and C. Nì. Allen, “Dielectric resonating microspheres for biosensing: An optical approach to a biological problem,” Am. J. Phys. 82, 510–520 (2014).
- [132] H. Chew, P. J. McNulty, and M. Kerker, “Model for Raman and fluorescent scattering by molecules embedded in small particles,” Phys. Rev. A 13, 396–404 (1976).
- [133] A. Moroz, “A recursive transfer-matrix solution for a dipole radiating inside and outside a stratified sphere,” Ann. Phys. 315, 352–418 (2005).
- [134] K. Imakita, H. Shibata, M. Fujii, and S. Hayashi, “Numerical analysis on the feasibility of a multi-layered dielectric sphere as a three-dimensional photonic crystal,” Opt. Express 21, 10651–10658 (2013).
- [135] R. Chance, A. Prock, and R. Silbey, “Molecular fluorescence and energy transfer near interfaces,” Adv. Chem. Phys. 37, 65 (1978).
- [136] H. Chew, “Radiation and lifetimes of atoms inside dielectric particles,” Phys. Rev. A 38, 3410–3416 (1988).
- [137] K. Kolmakov, V. N. Belov, J. Bierwagen, C. Ringemann, V. Muller, C. Eggeling, and S. W. Hell, “Red-emitting rhodamine dyes for fluorescence microscopy and nanoscopy,” Chem. Eur. J. 16, 158–166 (2010).
- [138] D. Farnesi, A. Barucci, G. C. Righini, G. N. Conti, and S. Soria, “Generation of hyper-parametric oscillations in silica microbubbles,” Opt. Lett. 40, 4508–4511 (2015).
- [139] G. Kozyreff, J. Dominguez-Juarez, and J. Martorell, “Nonlinear optics in spheres: from second harmonic scattering to quasi-phase matched generation in whispering gallery modes,” Laser Photon. Rev. 5, 737–749 (2011).
- [140] D. Farnesi, A. Barucci, G. C. Righini, S. Berneschi, S. Soria, and G. Nunzi Conti, “Optical frequency conversion in silica-whispering-gallery-mode microspherical resonators,” Phys. Rev. Lett. 112, 093901 (2014).
- [141] W. Liang, A. A. Savchenkov, Z. Xie, J. F. McMillan, J. Burkhart, V. S. Ilchenko, C. W. Wong, A. B. Matsko, and L. Maleki, “Miniature multioctave light source based on a monolithic microcavity,” Optica 2, 40–47 (2015).
- [142] Z. Ruan and S. Fan, “Superscattering of light from subwavelength nanostructures,” Phys. Rev. Lett. 105, 013901 (2010).
- [143] H. Chew, “Transition rates of atoms near spherical surfaces,” J. Chem. Phys. 87, 1355–1360 (1987).
- [144] Y. Xu, W. Liang, A. Yariv, J. G. Fleming, and S.-Y. Lin, “High-quality-factor Bragg onion resonators with omnidirectional reflector cladding,” Opt. Lett. 28, 2144–2146 (2003).
- [145] Y. Xu, W. Liang, A. Yariv, J. G. Fleming, and S.-Y. Lin, “Modal analysis of Bragg onion resonators,” Opt. Lett. 29, 424–426 (2004).
- [146] W. Liang, Y. Xu, Y. Huang, A. Yariv, J. Fleming, and S.-Y. Lin, “Mie scattering analysis of spherical Bragg “onion” resonators,” Opt. Express 12, 657–669 (2004).
- [147] I. Teraoka and S. Arnold, “Enhancing the sensitivity of a whispering-gallery mode microsphere sensor by a high-refractive-index surface layer,” J. Opt. Soc. Am. B 23, 1434–1441 (2006).
- [148] I. Teraoka and S. Arnold, “Whispering-gallery modes in a microsphere coated with a high-refractive index layer: polarization-dependent sensitivity enhancement of the resonance-shift sensor and TE–-TM resonance matching,” J. Opt. Soc. Am. B 24, 653–659 (2007).
- [149] C. F. Bohren and D. R. Huffman, Absorption and Scattering by a Sphere (Wiley-VCH Verlag GmbH, 2007), pp. 82–129.
- [150] X. Fan, Advanced Photonic Structures for Biological and Chemical Detection, Integrated Analytical Systems (Springer, 2009).
- [151] V. Saetchnikov and E. Tcherniavskaia, “Using optical resonance of whispering gallery modes in microspheres for real-time detection and identification of biological compounds,” J. Appl. Spectrosc. 77, 714–721 (2010).
- [152] A. François, K. J. Rowland, S. Afshar V., M. R. Henderson, and T. M. Monro, “Enhancing the radiation efficiency of dye doped whispering gallery mode microresonators,” Opt. Express 21, 22566–22577 (2013).
- [153] B. R. Johnson, “Theory of morphology-dependent resonances: shape resonances and width formulas,” J. Opt. Soc. Am. A 10, 343–352 (1993).
- [154] H. Chew, M. Kerker, and P. J. McNulty, “Raman and fluorescent scattering by molecules embedded in concentric spheres,” J. Opt. Soc. Am. 66, 440–444 (1976).
- [155] W. Yang, “Improved recursive algorithm for light scattering by a multilayered sphere,” Appl. Opt. 42, 1710–1720 (2003).
- [156] T. C. Preston and J. P. Reid, “Determining the size and refractive index of microspheres using the mode assignments from Mie resonances,” J. Opt. Soc. Am. A 32, 2210–2217 (2015).
- [157] J. M. M. Hall, S. Afshar V., M. R. Henderson, A. François, T. Reynolds, N. Riesen, and T. M. Monro, “Method for predicting whispering gallery mode spectra of spherical microresonators,” Opt. Express 23, 9924–9937 (2015).
- [158] J. M. M. Hall, S. Afshar V., M. R. Henderson, A. François, T. Reynolds, N. Riesen, and T. M. Monro, “Predicting the whispering gallery mode spectra of microresonators,” Proc. SPIE 9343, 93431Y–93431Y–7 (2015).
- [159] R. Chance, A. Prock, and R. Silbey, “Molecular fluorescence and energy transfer near interfaces,” Adv. Chem. Phys. 37, 65 (1978).
- [160] J. Gersten and A. Nitzan, “Electromagnetic theory of enhanced Raman scattering by molecules adsorbed on rough surfaces,” J. Chem. Phys. 73, 3023–3037 (1980).
- [161] J. Gersten and A. Nitzan, “Spectroscopic properties of molecules interacting with small dielectric particles,” J. Chem. Phys. 75, 1139–1152 (1981).
- [162] R. Ruppin, “Decay of an excited molecule near a small metal sphere,” J. Chem. Phys. 76, 1681–1684 (1982).
- [163] M. K. Schmidt, R. Esteban, J. J. Sáenz, I. Suárez-Lacalle, S. Mackowski, and J. Aizpurua, “Dielectric antennas - a suitable platform for controlling magnetic dipolar emission,” Opt. Express 20, 13636–13650 (2012).
- [164] S. Afshar V., M. R. Henderson, A. D. Greentree, B. C. Gibson, and T. M. Monro, “Self-formed cavity quantum electrodynamics in coupled dipole cylindrical-waveguide systems,” Opt. Express 22, 11301–11311 (2014).
- [165] J. Jackson, Classical electrodynamics (Wiley, 1975).
- [166] H. M. Lai, P. T. Leung, K. Young, P. W. Barber, and S. C. Hill, “Time-independent perturbation for leaking electromagnetic modes in open systems with application to resonances in microdroplets,” Phys. Rev. A 41, 5187–5198 (1990).
- [167] R. G. Jackson, Resonator sensors (Taylor & Francis, 2004), chap. Novel Sensors and Sensing, Series in Sensors.
- [168] B. E. Little, J.-P. Laine, H. A. Haus, and L. Fellow, “Analytic theory of coupling from tapered fibers and half-blocks into microsphere resonators,” J. Lightwave Technol. 17, 704 (1999).
- [169] V. S. Ilchenko, X. S. Yao, and L. Maleki, “High-Q microsphere cavity for laser stabilization and optoelectronic microwave oscillator,” Proc. SPIE 3611, 190–198 (1999).
- [170] L. Prkna, J. Čtyroký, and M. Hubálek, “Ring microresonator as a photonic structure with complex eigenfrequency,” Opt. Quant. Electron. 36, 259–269 (2004).
- [171] N. D. Smith, “A technique for continuous measurement of the quality factor of mechanical oscillators,” Rev. Sci. Instrum. 86, 053907 (2015).
- [172] V. V. Datsyuk, “Some characteristics of resonant electromagnetic modes in a dielectric sphere,” Appl. Phys. B 54, 184–187 (1992).
- [173] C. C. Lam, P. T. Leung, and K. Young, “Explicit asymptotic formulas for the positions, widths, and strengths of resonances in Mie scattering,” J. Opt. Soc. Am. B 9, 1585–1592 (1992).
- [174] F. Di Paolo, Networks and Devices Using Planar Transmissions Lines (Taylor & Francis, 2000).
- [175] M. L. Gorodetskii, Y. A. Demchenko, D. F. Zaitsev, V. N. Krutikov, Y. M. Zolotarevskii, and V. L. Lyaskovskii, “High-Q factor optical whispering-gallery mode microresonators and their use in precision measurements,” Meas. Tech. 57, 1386–1395 (2015).
- [176] M. L. Gorodetsky, A. D. Pryamikov, and V. S. Ilchenko, “Rayleigh scattering in high-Q microspheres,” J. Opt. Soc. Am. B 17, 1051–1057 (2000).
- [177] K. ichi Nagata, T. Umehara, and J. Nishiwaki, “The determination of rms roughness and correlation length of rough surface by measuring spatial coherence function,” Jpn. J. Appl. Phys. 12, 1693 (1973).
- [178] J. Lutti, W. Langbein, and P. Borri, “High Q optical resonances of polystyrene microspheres in water controlled by optical tweezers,” Appl. Phys. Lett. 91, 141116 (2007).
- [179] J. Zhang, L. Xue, and Y. Han, “Fabrication gradient surfaces by changing polystyrene microsphere topography,” Langmuir 21, 5–8 (2005).
- [180] G. E. Yakubov, O. I. Vinogradova, and H.-J. Butt, “A study of the linear tension effect on the polystyrene microsphere wettability with water,” Colloid J. 63, 518–525 (2001).
- [181] R. Talebi, K. Abbasian, and A. Rostami, “Analytical modeling of quality factor for shell type microsphere resonators,” Prog. Electromagn. Res. B 30, 293–311 (2011).
- [182] A. Kaplan, M. Tomes, T. Carmon, M. Kozlov, O. Cohen, G. Bartal, and H. G. L. Schwefel, “Finite element simulation of a perturbed axial-symmetric whispering-gallery mode and its use for intensity enhancement with a nanoparticle coupled to a microtoroid,” Opt. Express 21, 14169–14180 (2013).
- [183] M. A. C. Shirazi, W. Yu, S. Vincent, and T. Lu, “Cylindrical beam propagation modelling of perturbed whispering-gallery mode microcavities,” Opt. Express 21, 30243–30254 (2013).
- [184] Y. Yang, J. Ward, and S. N. Chormaic, “Quasi-droplet microbubbles for high resolution sensing applications,” Opt. Express 22, 6881–6898 (2014).
- [185] E. M. Purcell, “Spontaneous emission probabilities at radio frequencies,” Phys. Rev. 69, 681 (1946).
- [186] W. Lukosz and R. E. Kunz, “Light emission by magnetic and electric dipoles close to a plane interface. I: Total radiated power,” J. Opt. Soc. Am. 67, 1607–1615 (1977).
- [187] X. Brokmann, L. Coolen, J.-P. Hermier, and M. Dahan, “Emission properties of single CdSe/ZnS quantum dots close to a dielectric interface,” Chem. Phys. 318, 91–98 (2005). Molecular Nanoscience.
- [188] P. Anger, P. Bharadwaj, and L. Novotny, “Enhancement and quenching of single-molecule fluorescence,” Phys. Rev. Lett. 96, 113002 (2006).
- [189] W. Żakowicz and M. Janowicz, “Spontaneous emission in the presence of a dielectric cylinder,” Phys. Rev. A 62, 013820 (2000).
- [190] T. Søndergaard and B. Tromborg, “General theory for spontaneous emission in active dielectric microstructures: Example of a fiber amplifier,” Phys. Rev. A 64, 033812 (2001).
- [191] P. Bermel, J. D. Joannopoulos, Y. Fink, P. A. Lane, and C. Tapalian, “Properties of radiating pointlike sources in cylindrical omnidirectionally reflecting waveguides,” Phys. Rev. B 69, 035316 (2004).
- [192] R. Coccioli, M. Boroditsky, K. W. Kim, Y. Rahmat-Samii, and E. Yablonovitch, “Smallest possible electromagnetic mode volume in a dielectric cavity,” IEE Proc. Optoelectron. 145, 391–397 (1998).
- [193] A. Narayanaswamy and G. Chen, “Dyadic green’s functions and electromagnetic local density of states,” J. Quant. Spectrosc. Radiat. Transfer 111, 1877–1884 (2010).
- [194] K. Joulain, R. Carminati, J.-P. Mulet, and J.-J. Greffet, “Definition and measurement of the local density of electromagnetic states close to an interface,” Phys. Rev. B 68, 245405 (2003).
- [195] M. B. Bacardit, Optical characterisation of the whispering gallery modes in Nd3+ doped glass active microspheres (Universitat Politècnica de Catalunya, 2011), chap. Introduction.
- [196] D. G. Rabus, Ring Resonators: Theory and Modeling (Springer Berlin Heidelberg, Berlin, Heidelberg, 2007), pp. 3–40.
- [197] A. Taflove, Computational Electrodynamics: The Finite-Difference Time-Domain Method (Artech House, Incorporated, 1995).
- [198] B. Min, E. Ostby, V. Sorger, E. Ulin-Avila, L. Yang, X. Zhang, and K. Vahala, “High-Q surface-plasmon-polariton whispering-gallery microcavity,” Nature 457, 455–458 (2009).
- [199] K. Vahala, Optical Microcavities, Advanced series in applied physics (World Scientific, 2004).
- [200] A. F. Oskooi, D. Roundy, M. Ibanescu, P. Bermel, J. D. Joannopoulos, and S. G. Johnson, “MEEP: A flexible free-software package for electromagnetic simulations by the FDTD method,” Comput. Phys. Commun. 181, 687–702 (2010).
- [201] M. D. Barnes, W. B. Whitten, S. Arnold, and J. M. Ramsey, “Homogeneous linewidths of rhodamine 6G at room temperature from cavity-enhanced spontaneous emission rates,” J. Chem. Phys. 97, 7842–7845 (1992).
- [202] K. Kolmakov, V. N. Belov, J. Bierwagen, C. Ringemann, V. Muller, C. Eggeling, and S. W. Hell, “Red-emitting rhodamine dyes for fluorescence microscopy and nanoscopy,” Chem. Eur. J. 16, 158–166 (2010).
- [203] M. Himmelhaus, S. Krishnamoorthy, and A. François, “Optical sensors based on whispering gallery modes in fluorescent microbeads: response to specific interactions,” Sensors 10, 6257–6274 (2010).
- [204] C. F. Marki, Design and Optimization of Bidirectional and Optical Logic Systems in the Presence of Noise (University of California, Electrical Engineering (Photonics), San Diego, 2007).
- [205] A. François, K. J. Rowland, and T. M. Monro, “Highly efficient excitation and detection of whispering gallery modes in a dye-doped microsphere using a microstructured optical fiber,” Appl. Phys. Lett. 99, 141111 (2011).
- [206] R. Henze, T. Seifert, J. Ward, and O. Benson, “Tuning whispering gallery modes using internal aerostatic pressure,” Opt. Lett. 36, 4536–4538 (2011).
- [207] Y. Yang, S. Saurabh, J. Ward, and S. N. Chormaic, “Coupled-mode-induced transparency in aerostatically tuned microbubble whispering-gallery resonators,” Opt. Lett. 40, 1834–1837 (2015).
- [208] N. Riesen, W. Q. Zhang, and T. M. Monro, “Dispersion in silica microbubble resonators,” Opt. Lett. 41, 1257–1260 (2016).
- [209] M. Sumetsky, Y. Dulashko, and R. S. Windeler, “Super free spectral range tunable optical microbubble resonator,” Opt. Lett. 35, 1866–1868 (2010).
- [210] P.-T. Lee, T.-W. Lu, F.-M. Tsai, T.-C. Lu, and H.-C. Kuo, “Whispering gallery mode of modified octagonal quasiperiodic photonic crystal single-defect microcavity and its side-mode reduction,” Appl. Phys. Lett. 88, 201104 (2006).
- [211] M. Sumetsky, Y. Dulashko, and R. S. Windeler, “Optical microbubble resonator,” Opt. Lett. 35, 898–900 (2010).
- [212] S. Berneschi, D. Farnesi, F. Cosi, G. N. Conti, S. Pelli, G. C. Righini, and S. Soria, “High Q silica microbubble resonators fabricated by arc discharge,” Opt. Lett. 36, 3521–3523 (2011).
- [213] G. Palma, C. Falconi, V. Nazabal, T. Yano, T. Kishi, T. Kumagai, M. Ferrari, and F. Prudenzano, “Modeling of whispering gallery modes for rare earth spectroscopic characterization,” IEEE Photon. Technol. Lett. 27, 1861–1863 (2015).
- [214] D. Ristić, M. Mazzola, A. Chiappini, A. Rasoloniaina, P. Féron, R. Ramponi, G. C. Righini, G. Cibiel, M. Ivanda, and M. Ferrari, “Tailoring of the free spectral range and geometrical cavity dispersion of a microsphere by a coating layer,” Opt. Lett. 39, 5173–5176 (2014).
- [215] N. Riesen, W. Q. Zhang, and T. M. Monro, “Dispersion analysis of whispering gallery mode microbubble resonators,” Opt. Express 24, 8832–8847 (2016).
- [216] Y. Yang, J. Ward, and S. Nic Chormaic, “Optimization of whispering gallery modes in microbubble resonators for sensing applications,” Proc. SPIE 8960, 89600I–89600I–6 (2014).
- [217] M. R. Foreman, W.-L. Jin, and F. Vollmer, “Optimizing detection limits in whispering gallery mode biosensing,” Opt. Express 22, 5491–5511 (2014).
- [218] E. Klantsataya, A. François, H. Ebendorff-Heidepriem, B. Sciacca, A. Zuber, and T. M. Monro, “Effect of surface roughness on metal enhanced fluorescence in planar substrates and optical fibers,” Opt. Mater. Express 6, 2128–2138 (2016).
- [219] A. François and M. Himmelhaus, “Optical sensors based on whispering gallery modes in fluorescent microbeads: Size dependence and influence of substrate,” Sensors 9, 6836 (2009).
- [220] J. Vörös, “The density and refractive index of adsorbing protein layers,” Biophys. J. 87, 553–561 (2004).
- [221] M. C. Gather and S. H. Yun, “Single-cell biological lasers,” Nat. Photon. 5, 406–410 (2011).
- [222] Y. Yang, S. Saurabh, J. M. Ward, and S. N. Chormaic, “High-Q, ultrathin-walled microbubble resonator for aerostatic pressure sensing,” Opt. Express 24, 294–299 (2016).
- [223] A. Cosci, F. Quercioli, D. Farnesi, S. Berneschi, A. Giannetti, F. Cosi, A. Barucci, G. N. Conti, G. Righini, and S. Pelli, “Confocal reflectance microscopy for determination of microbubble resonator thickness,” Opt. Express 23, 16693–16701 (2015).
- [224] V. N. Astratov, Photonic Microresonator Research and Applications (Springer US, 2010).
- [225] M. R. Foreman, J. D. Swaim, and F. Vollmer, “Whispering gallery mode sensors,” Adv. Opt. Photon. 7, 168–240 (2015).
- [226] A. Edmonds, Angular Momentum in Quantum Mechanics, Investigations in Physics Series (Princeton University, 1996).
- [227] I. H. Malitson, “Interspecimen comparison of the refractive index of fused silica,” J. Opt. Soc. Am. 55, 1205–1209 (1965).
- [228] S. N. Kasarova, N. G. Sultanova, C. D. Ivanov, and I. D. Nikolov, “Analysis of the dispersion of optical plastic materials,” Opt. Mater. 29, 1481–1490 (2007).
- [229] J. J. Abel, “Experimental and chemical studies of the blood with an appeal for more extended chemical training for the biological and medical investigator. II,” Science 42, 165–178 (1915).
- [230] G. Vanroose, H. Nauwynck, A. V. Soom, M.-T. Ysebaert, G. Charlier, P. V. Oostveldt, and A. de Kruif, “Structural aspects of the zona pellucida of in vitro-produced bovine embryos: A scanning electron and confocal laser scanning microscopic study1,” Biol. Reprod. 62, 463 (2000).
- [231] A. I. Rahachou and I. V. Zozoulenko, “Effects of boundary roughness on a Q factor of whispering-gallery-mode lasing microdisk cavities,” J. Appl. Phys. 94, 7929–7931 (2003).
- [232] B. P. Joshi and Q.-H. Wei, “Cavity resonances of metal-dielectric-metal nanoantennas,” Opt. Express 16, 10315–10322 (2008).
- [233] C. G. Biris and N. C. Panoiu, “Nonlinear surface-plasmon whispering-gallery modes in metallic nanowire cavities,” Phys. Rev. Lett. 111, 203903 (2013).
- [234] F. Lou, M. Yan, L. Thylen, M. Qiu, and L. Wosinski, “Whispering gallery mode nanodisk resonator based on layered metal-dielectric waveguide,” Opt. Express 22, 8490–8502 (2014).
- [235] M. Papi, R. Brunelli, L. Sylla, T. Parasassi, M. Monaci, G. Maulucci, M. Missori, G. Arcovito, F. Ursini, and M. De Spirito, “Mechanical properties of zona pellucida hardening,” Eur. Biophys. J. 39, 987–992 (2010).
- [236] T. Kippenberg and K. Vahala, “Cavity opto-mechanics,” Opt. Express 15, 17172–17205 (2007).
- [237] M. Aspelmeyer, T. J. Kippenberg, and F. Marquardt, “Cavity optomechanics,” Rev. Mod. Phys. 86, 1391–1452 (2014).
- [238] G. Bahl, X. Fan, and T. Carmon, “Acoustic whispering-gallery modes in optomechanical shells,” New J. Phys 14, 115026 (2012).
- [239] L. Z. Yanez, J. Han, B. B. Behr, R. A. R. Pera, and D. B. Camarillo, “Human oocyte developmental potential is predicted by mechanical properties within hours after fertilization,” Nat. Commun. 7, 10809 (2016).
- [240] D. B. Hand, “The refractivity of protein solutions,” J. Biol. Chem. 108, 703–707 (1935).
- [241] T. L. McMeekin, M. L. Groves, and N. J. Hipp, Refractive Indices of Amino Acids, Proteins, and Related Substances (American Chemical Society, 1964), chap. 4, pp. 54–66.
- [242] I. R. Ivascu, R. Zeggari, C. Pieralli, B. Wacogne, and C. Roux, “Measuring the refractive index of oocytes by means of an optical microsystem - a non invasive technique to estimate the evolution of oocytes maturity,” in “Proceedings of the Third International Conference on Biomedical Electronics and Devices - Volume 1: BIODEVICES, (BIOSTEC 2010),” (2010), pp. 127–132.
- [243] B. Wacogne, I. Ivascu, R. Zeggari, C. Pieralli, C. Amiot, L. Pazart, and C. Roux, “Microsensors and image processing for single oocyte qualification: toward multiparametric determination of the best time for fertilization,” Laser Phys. Lett. 10, 105601 (2013).
- [244] D. Xiao-Wei, L. Shao-Hua, F. Su-Chun, X. Ou, and J. Shui-Sheng, “All-fibre micro-ring resonator based on tapered microfibre,” Chin. Phys. B 17, 1029 (2008).
- [245] X. Jin, Y. Dong, and K. Wang, “Selective excitation of axial modes in a high-Q microcylindrical resonator for controlled and robust coupling,” Appl. Opt. 54, 8100–8107 (2015).
- [246] A. McNaught, A. Wilkinson, I. U. of Pure, and A. Chemistry, Compendium of Chemical Terminology: IUPAC Recommendations, IUPAC Chemical Data Series (Blackwell Science, 1997).
- [247] S. L. Jacques, “Optical properties of biological tissues: a review,” Phys. Med. and Biol. 58, R37 (2013).
- [248] F. Fereidouni, A. Datta-Mitra, S. Demos, and R. Levenson, “Microscopy with UV surface excitation (MUSE) for slide-free histology and pathology imaging,” Proc. SPIE 9318, 93180F–93180F–6 (2015).
- [249] R. M. Levenson, Z. Harmany, F. Fereidouni, and S. Demos, “Slide-free (but not necessarily stain-free) microscopy via UV excitation,” Conference on Lasers and Electro-Optics SM1O.1 (2016).
- [250] G. J. Clydesdale, G. W. Dandie, and H. K. Muller, “Ultraviolet light induced injury: Immunological and inflammatory effects,” Immunol. Cell Biol. 79, 547–568 (2001).
- [251] S. P. Jackson and J. Bartek, “The DNA-damage response in human biology and disease,” Nature 461, 1071–1078 (2009).
- [252] J. M. Squirrell, D. L. Wokosin, J. G. White, and B. D. Bavister, “Long-term two-photon fluorescence imaging of mammalian embryos without compromising viability,” Nat. Biotech. 17, 763–767 (1999).
- [253] P. F. Mullaney and P. N. Dean, “The small-angle light scattering of biological cells,” Biophys. J. 10, 764–772 (1970).
- [254] R. Drezek, A. Dunn, and R. Richards-Kortum, “A pulsed finite-difference time-domain (FDTD) method for calculating light scattering from biological cells over broad wavelength ranges,” Opt. Express 6, 147–157 (2000).
- [255] C. H. See, R. A. Abd-Alhameed, P. S. Excell, G. Qasim, and J. Vaul, “Biological cell modelling using quasi static FDTD/lumped element method,” 8th International Multitopic Conference - Proceedings of INMIC, pp. 553–559 (2004).
- [256] H. Ding, E. Berl, Z. Wang, L. J. Millet, M. U. Gillette, J. Liu, M. Boppart, and G. Popescu, “Fourier transform light scattering of biological structure and dynamics,” IEEE J. Sel. Top. Quantum Electron. 16, 909–918 (2010).
- [257] D. Ami, P. Mereghetti, A. Natalello, S. M. Doglia, M. Zanoni, C. A. Redi, and M. Monti, “FTIR spectral signatures of mouse antral oocytes: Molecular markers of oocyte maturation and developmental competence,” Biochim. Biophys. Acta 1813, 1220–1229 (2011).
- [258] R. An, C. Wang, J. Turek, Z. Machaty, and D. D. Nolte, “Biodynamic imaging of live porcine oocytes, zygotes and blastocysts for viability assessment in assisted reproductive technologies,” Biomed. Opt. Express 6, 963–976 (2015).
- [259] M. Fujii, M. Haraguchi, T. Okamoto, and M. Fukui, “Characteristics of whispering gallery modes in single dielectric spheroid excited by gaussian beam,” Jpn. J. Appl. Phys. 44, 4948 (2005).
- [260] M. Fujii, M. Haraguchi, T. Okamoto, and M. Fukui, “Characteristics of whispering gallery modes in single spheroid: Dependence on the direction of incident light,” J. Korean Phys. Soc. 47, S38–S42 (2005).
- [261] Z. Ballard, M. D. Baaske, and F. Vollmer, “Stand-off biodetection with free-space coupled asymmetric microsphere cavities,” Sensors 15, 8968–8980 (2015).
- [262] F. C. Landim-Alvarenga, S. E. A. Boyazoglu, L. R. Carvalho, Y. H. Choi, E. L. Squires, and G. E. J. Seidel, “Effects of fetuin on zona pellucida hardening, fertilization and embryo development in cattle,” Anim. Reprod. Sci. 71, 181–191 (2002).
- [263] M. G. Shapiro, K. Homma, S. Villarreal, C.-P. Richter, and F. Bezanilla, “Infrared light excites cells by changing their electrical capacitance,” Nat. Commun. 3, 736 (2012).
- [264] K. A. Sem’yanov, P. A. Tarasov, J. T. Soini, A. K. Petrov, and V. P. Maltsev, “Calibration-free method to determine the size and hemoglobin concentration of individual red blood cells from light scattering,” Appl. Opt. 39, 5884–5889 (2000).
- [265] M. A. Yurkin, K. A. Semyanov, P. A. Tarasov, A. V. Chernyshev, A. G. Hoekstra, and V. P. Maltsev, “Experimental and theoretical study of light scattering by individual mature red blood cells by use of scanning flow cytometry and a discrete dipole approximation,” Appl. Opt. 44, 5249–5256 (2005).
- [266] Y. Park, M. Diez-Silva, G. Popescu, G. Lykotrafitis, W. Choi, M. S. Feld, and S. Suresh, “Refractive index maps and membrane dynamics of human red blood cells parasitized by plasmodium falciparum,” Proceedings of the National Academy of Sciences 105, 13730–13735 (2008).
- [267] S. Buaprathoom, S. Sweeney, and S. Pedley, “Dual wavelength multiple-angle light scattering system for cryptosporidium detection,” Progress in Biomedical Optics and Imaging - Proceedings of SPIE 8427 (2012).
- [268] R. Mercado and F. Santander, “Size of Cryptosporidium oocysts excreted by symptomatic children of Santiago, Chile,” Rev. Inst. de Med. Trop. de São Paulo 37, 473–474 (1995).
- [269] H. Dungrawala, H. Hua, J. Wright, L. Abraham, T. Kasemsri, A. McDowell, J. Stilwell, and B. L. Schneider, “Identification of new cell size control genes in S. cerevisiae,” Cell Division 7, 24 (2012).
- [270] J. J. Turner, J. C. Ewald, and J. M. Skotheim, “Cell size control in yeast,” Curr. Biol. 22, R350–R359 (2012).
- [271] J. A. Glasel, “Validity of nucleic acid purities monitored by 260nm/280nm absorbance ratios,” BioTechniques 18, 62—63 (1995).
- [272] E. Aas, “Refractive index of phytoplankton derived from its metabolite composition,” J. of Plankton Res. 18, 2223 (1996).
- [273] C. J. S. Bolch and S. I. Blackburn, “Isolation and purification of Australian isolates of the toxic cyanobacterium Microcystis aeruginosa Kütz,” J. Appl. Phycol. 8, 5–13 (1996).
- [274] Govindjee and B. Z. Braun, Volume 10 of Botanical monographs: Algal Physiology and Biochemistry (University of California, 1974), chap. Chapter 12: Light Absorption, Emission and Photosynthesis.
- [275] D. Wu, M. Chen, Q. Wang, and W. Gao, “Algae (microcystis and scenedesmus) absorption spectra and its application on chlorophyll a retrieval,” Front. of Earth Sci. 7, 522–530 (2013).
- [276] M. Humar and S. H. Yun, “Whispering-gallery-mode emission from biological luminescent protein microcavity assemblies,” Optica 4, 222–228 (2017).
- [277] J. D. Bleil and P. M. Wassarman, “Structure and function of the zona pellucida: Identification and characterization of the proteins of the mouse oocyte’s zona pellucida,” Dev. Biol. 76, 185–202 (1980).
- [278] P. Wassarman, J. Chen, N. Cohen, E. Litscher, C. Liu, H. Qi, and Z. Williams, “Structure and function of the mammalian egg zona pellucida,” J. Exp. Zool. 285, 251–258 (1999).
- [279] S. K. Gupta, “Role of zona pellucida glycoproteins during fertilization in humans,” J, Reprod. Immunol. 108, 90–97 (2015).
- [280] P. M. Wassarman, “Zona pellucida glycoproteins,” J. Biol. Chem. 283, 24285–24289 (2008).
- [281] B. Imperiali and S. E. O’Connor, “Effect of N-linked glycosylation on glycopeptide and glycoprotein structure,” Curr. Opin. in Chem. Biol. 3, 643–649 (1999).
- [282] N. Yonezawa, S. Kanai-Kitayama, T. Kitayama, A. Hamano, and M. Nakano, “Porcine zona pellucida glycoprotein ZP4 is responsible for the sperm-binding activity of the ZP3/ZP4 complex,” Zygote 20, 389–397 (2012).
- [283] D. Green, “Three-dimensional structure of the zona pellucida,” Rev. Reprod. 2, 147–156 (1997).
- [284] M. V. Duin, J. E. Polman, C. C. Verkoelen, H. Bunschoten, J. H. Meyerink, W. Olijve, and R. J. Aitken, “Cloning and characterization of the human sperm receptor ligand ZP3: Evidence for a second polymorphic allele with a different frequency in the Caucasian and Japanese populations,” Genomics 14, 1064–1070 (1992).
- [285] S. K. Gupta, B. Bhandari, A. Shrestha, B. K. Biswal, C. Palaniappan, S. S. Malhotra, and N. Gupta, “Mammalian zona pellucida glycoproteins: structure and function during fertilization,” Cell Tissue Res. 349, 665–678 (2012).
- [286] M. El-Mestrah, P. E. Castle, G. Borossa, and F. W. Kan, “Subcellular distribution of ZP1, ZP2, and ZP3 glycoproteins during folliculogenesis and demonstration of their topographical disposition within the zona matrix of mouse ovarian oocytes,” Biol. Reprod. 66, 866 (2016).
- [287] G. Bó and R. J. Mapletoft, “Evaluation and classification of bovine embryos,” Anim. Reprod. Sci. 10, 344–348 (2013).
- [288] T. Fair, P. Hyttel, and T. Greve, “Bovine oocyte diameter in relation to maturational competence and transcriptional activity,” Mol. Reprod. Dev. 42, 437–442 (1995).
- [289] Y. Xie, W. Zhong, Y. Wang, A. Trostinskaia, F. Wang, E. Puscheck, and D. Rappolee, “Using hyperosmolar stress to measure biologic and stress-activated protein kinase responses in preimplantation embryos,” Mol. Hum. Reprod. 13, 473 (2007).
- [290] J. M. Baltz and A. P. Tartia, “Cell volume regulation in oocytes and early embryos: connecting physiology to successful culture media,” Hum. Reprod. Update 16, 166 (2010).
- [291] D. Ami, S. M. Doglia, and P. Mereghetti, Multivariate Analysis for Fourier Transform Infrared Spectra of Complex Biological Systems and Processes (InTech, 2013), chap. 10.
- [292] S. Götzinger, O. Benson, and V. Sandoghdar, “Towards controlled coupling between a high-Q whispering-gallery mode and a single nanoparticle,” Appl. Phys. B 73, 825–828 (2001).
- [293] M. R. Foreman, F. Sedlmeir, H. G. L. Schwefel, and G. Leuchs, “Dielectric tuning and coupling of whispering gallery modes using an anisotropic prism,” J. Opt. Soc. Am. B 33, 2177–2195 (2016).
- [294] R. Kubin and A. Fletcher, “Fluorescence quantum yields of some rhodamine dyes,” JOL 27, 455–462 (1982).
- [295] L. V. Johnson, M. L. Walsh, and L. B. Chen, “Localization of mitochondria in living cells with rhodamine 123,” Proc. Natl. Acad. Sci. 77, 990–994 (1980).
- [296] A. Baracca, G. Sgarbi, G. Solaini, and G. Lenaz, “Rhodamine 123 as a probe of mitochondrial membrane potential: evaluation of proton flux through F0 during ATP synthesis,” BBA Bioenergetics 1606, 137–146 (2003).
- [297] H. T. Beier, G. L. Coté, and K. E. Meissner, “Whispering gallery mode biosensors consisting of quantum dot-embedded microspheres,” Ann. Biomed. Eng. 37, 1974–1983 (2009).
- [298] A. A. Antipov, D. Shchukin, Y. Fedutik, A. I. Petrov, G. B. Sukhorukov, and H. Möhwald, “Carbonate microparticles for hollow polyelectrolyte capsules fabrication,” Colloids Surf. A 224, 175–183 (2003).
- [299] M. J. E. Fischer, “Amine coupling through EDC/NHS: a practical approach, surface plasmon resonance: methods and protocols,” in “Methods in Molecular Biology,” vol. 627, N. J. Mol and M. J. E. Fischer, eds. (Humana, Totowa, NJ, 2010), pp. 55–73.
- [300] C. Wang, Q. Yan, H.-B. Liu, X.-H. Zhou, and S.-J. Xiao, “Different EDC/NHS activation mechanisms between PAA and PMAA brushes and the following amidation reactions,” Langmuir 27, 12058–12068 (2011).
- [301] M. Noto, D. Keng, I. Teraoka, and S. Arnold, “Detection of protein orientation on the silica microsphere surface using transverse electric/transverse magnetic whispering gallery modes,” Biophys. J. 92, 4466–4472 (2007).
- [302] J. W. Strutt (Lord Rayleigh), “XXXI. Investigations in optics, with special reference to the spectroscope,” Phil. Mag. Series 5 8, 261–274 (1879).
- [303] S. Mullen, M. Rosenbaum, and J. Critser, “The effect of osmotic stress on the cell volume, metaphase II spindle and developmental potential of in vitro matured porcine oocytes,” Cryobiology 54, 281–289 (2007).
- [304] M. Cai, O. Painter, and K. J. Vahala, “Observation of critical coupling in a fiber taper to a silica-microsphere whispering-gallery mode system,” Phys. Rev. Lett. 85, 74–77 (2000).
- [305] A. E. Jones, G. Wright, H. I. Kort, R. J. Straub, and Z. P. Nagy, “Comparison of laser-assisted hatching and acidified Tyrode’s hatching by evaluation of blastocyst development rates in sibling embryos: a prospective randomized trial,” Fertil. Steril. 85, 487–491 (2006).
- [306] K. Yano, C. Yano, T. Kubo, I. Ôhashi, N. Maeda, and T. Fukaya, “Chemical zona pellucida thinning with acidified tyrode’s solution: comparison between partial and circumferential techniques,” J. Assist. Reprod. Genet. 24, 471–475 (2007).
- [307] C. Fong, A. Bongso, S. Ng, J. Anan Kumar, A. Trounson, and S. Ratnam, “Blastocyst transfer after enzymatic treatment of the zona pellucida: improving in-vitro fertilization and understanding implantation,” Hum. Reprod. 13, 2926–2932 (1998).
- [308] D. Frankfurter, R. Hackett, L. Meng, and D. L. Keefe, “Complete removal of the zona pellucida by pronase digestion prior to blastocyst embryo transfer does not eliminate monozygotic pregnancies following IVF.” Fertil. Steril. 76, S144 (2001).
- [309] S. Geber, R. Bossi, C. B. Lisboa, M. Valle, and M. Sampaio, “Laser confers less embryo exposure than acid tyrode for embryo biopsy in preimplantation genetic diagnosis cycles: a randomized study,” Reprod Biol Endocrinol. 9, 58 (2011).
- [310] B. Balaban, B. Urman, C. Alatas, R. Mercan, A. Mumcu, and A. Isiklar, “A comparison of four different techniques of assisted hatching,” Hum. Reprod. 17, 1239 (2002).
- [311] R. Ribas, B. Oback, W. Ritchie, T. Chebotareva, J. Taylor, A. C. Maurício, M. Sousa, and I. Wilmut, “Modifications to improve the efficiency of zona-free mouse nuclear transfer,” Cloning Stem Cells 8, 10–15 (2006).
- [312] K. L. van der Molen, P. Zijlstra, A. Lagendijk, and A. P. Mosk, “Laser threshold of Mie resonances,” Opt. Lett. 31, 1432–1434 (2006).
- [313] M. Akbulut, P. Ginart, M. E. Gindy, C. Theriault, K. H. Chin, W. Soboyejo, and R. K. Prud’homme, “Generic method of preparing multifunctional fluorescent nanoparticles using flash nanoprecipitation,” Adv. Funct. Mater. 19, 718–725 (2009).
- [314] J. Venturini, E. Koudoumas, S. Couris, J. M. Janot, P. Seta, C. Mathis, and S. Leach, “Optical limiting and nonlinear optical absorption properties of c60-polystyrene star polymer films: C60 concentration dependence,” J. Mater. Chem. 12, 2071–2076 (2002).
- [315] A. M. Shakhov, A. A. Astafiev, A. A. Osychenko, and V. A. Nadtochenko, “Effect of femtosecond laser radiation on mammalian oocytes,” Russ. J. Phys. Chem. B 10, 816–819 (2016).
- [316] F. G. Prendergast and K. G. Mann, “Chemical and physical properties of aequorin and the green fluorescent protein isolated from Aequorea forskålea,” Biochemistry US 17, 3448–3453 (1978).
- [317] P. Horvath and R. Barrangou, “CRISPR/Cas, the immune system of bacteria and archaea,” Science 327, 167–170 (2010).
- [318] D. H. Lackner, A. Carré, P. M. Guzzardo, C. Banning, R. Mangena, T. Henley, S. Oberndorfer, B. V. Gapp, S. M. B. Nijman, T. R. Brummelkamp, and T. Bürckstümmer, “A generic strategy for CRISPR-Cas9-mediated gene tagging,” Nat. Commun. 6, 10237 (2015).
- [319] Y. Kimura, M. Oda, T. Nakatani, Y. Sekita, A. Monfort, A. Wutz, H. Mochizuki, and T. Nakano, “CRISPR/Cas9-mediated reporter knock-in in mouse haploid embryonic stem cells,” Sci. Rep. 5, 10710 (2015).
- [320] S.-L. Xie, W.-P. Bian, C. Wang, M. Junaid, J.-X. Zou, and D.-S. Pei, “A novel technique based on in vitro oocyte injection to improve CRISPR/Cas9 gene editing in zebrafish,” Sci. Rep. 6, 34555 (2016).
- [321] A. I. Miller, “Imagery and intuition in creative scientific thinking: Albert einstein’s invention of the special theory of relativity,” in “Creative People at Work, Twelve Cognitive Case Studies,” vol. 1, D. B. Wallace and H. E. Gruber, eds. (New York: Oxford University, 1989 Ed.), p. 172.
- [322] D. Siegel, Mind: A Journey to the Heart of Being Human (Norton Series on Interpersonal Neurobiology), Norton Series on Interpersonal Neurobiology (W. W. Norton, 2017).
- [323] J. Blatt and V. Weisskopf, Theoretical Nuclear Physics, Dover Books on Physics Series (Dover Publications, 1991).
- [324] R. G. Barrera, G. A. Estevez, and J. Giraldo, “Vector spherical harmonics and their application to magnetostatics,” Eur. J. Phys. 6, 287 (1985).
- [325] M. Abramowitz and I. Stegun, Handbook of Mathematical Functions: With Formulas, Graphs, and Mathematical Tables, Applied Mathematics Series (Dover Publications, 1964).
- [326] Anon., “Tyrode’s solution,” Cold Spring Harb. Protoc. 10479 (2006).