The opticalinfrared L dwarf spectral sequence of young planetary-mass objects in the Upper Scorpius association Thanks: Based on observations collected with the Gran Telescopio Canarias (programmes GTC4-14A, GTC25-16A, and GTC40-17A) installed in the Spanish Observatorio del Roque de los Muchachos of the Instituto de Astrofísica de Canarias, in the island of La Palma and the ESO VLT telescope under programmes 095.C-0812(A) and 089-C.0102(ABC).
Abstract
We present the results of photometric and spectroscopic follow-ups of the lowest mass member candidates in the nearest OB association, Upper Scorpius (5–10 Myr; 14517 pc), with the Gran Telescopio de Canarias (GTC) and European Southern Observatory (ESO) Very Large Telescope (VLT). We confirm the membership of the large majority ( 80%) of the candidates selected originally photometrically and astrometrically based on their spectroscopic features, weak equivalent widths of gravity-sensitive doublets, and radial velocities. Confirmed members follow a sequence over a wide magnitude range ( = 17.0–19.3 mag) in several colour-magnitude diagrams with optical, near-, and mid-infrared photometry, and have near-infrared spectral types in the L1–L7 interval with likely masses below 15 Jupiter masses. We find that optical spectral types tend to be earlier than near-infrared spectral types by a few subclasses for spectral types later than M9. We investigate the behaviour of spectral indices defined in the literature as a function of spectral type and gravity by comparison with values reported in the literature for young and old dwarfs. We also derive effective temperatures in the 1900–1600 K from fits of synthetic model-atmosphere spectra to the observed photometry but we caution the procedure carries large uncertainties. We determine bolometric corrections for young L dwarfs with ages of 5–10 Myr (Upper Sco association) and find them similar in the -band but larger by 0.1-0.4 mag in the -band with respect to field L dwarfs. Finally, we discovered two faint young L dwarfs, VISTA J16072146 (L4.5) and VISTA J16112215 (L5) that have H emission and possible flux excesses at 4.5 m, pointing towards the presence of accretion from a disk onto the central objects of mass below 15 MJup at the age of 5–10 Myr.
Keywords:
Stars: low-mass stars and brown dwarfs — techniques: photometric — techniques: spectroscopic — surveys — stars: luminosity function, mass function1 Introduction
Various independent groups explored the very low-mass end of the initial mass function (Salpeter, 1955; Miller & Scalo, 1979; Scalo, 1986; Chabrier, 2005; Kroupa et al., 2013, IMF;) in young clusters and star-forming regions following L to T-type spectral sequences. Barrado y Navascués et al. (2007) conducted a deep ( 17 mag) 1-deg2 survey in Orionis down to the low-mass and substellar regimes with subsequent optical and near-infrared spectroscopy (Bayo et al., 2011) and in-depth study of the physical properties of the confirmed members (Bayo et al., 2012). Scholz et al. (2009) reported a possible mass cut-off in NGC 1333 in the range 0.02–0.012 M⊙ from a deep photometric and spectroscopic survey of 0.25 deg2 down to = 20.8 mag with spectroscopic follow-up (Scholz et al., 2012). The census of spectroscopic members in this region is now complete down to 0.01 M⊙ at an age of 3 Myr (Luhman et al., 2016). In IC 348, Alves de Oliveira et al. (2013) presented optical and near-infrared spectroscopy of late-M/early-L dwarf candidates while Burgess et al. (2009) reported one high-probability T-type candidate. The current census of spectroscopic members in IC 348 amounts for 478 objects down to = 16.2 mag and AJ 3 mag (Luhman et al., 2016). In Orionis, Peña Ramírez et al. (2012) reported 23 new candidates extending the previous mass functions (Zapatero Osorio et al., 2000; Béjar et al., 2001; Caballero et al., 2007; Bihain et al., 2009; Lodieu et al., 2009; Béjar et al., 2011, e.g.) down to a completeness of 0.006 M⊙. The membership of T-type sources (Zapatero Osorio et al., 2000; Zapatero Osorio et al., 2002; Burgasser et al., 2004; Zapatero Osorio et al., 2008) towards the cluster was revised in Peña Ramírez et al. (2011) and Peña Ramírez et al. (2015). Many independent surveys investigated spectroscopically the substellar population of the Orion Nebula Cluster (Lucas et al., 2001; Weights et al., 2009; Hillenbrand et al., 2013; Ingraham et al., 2014; Suenaga et al., 2014). In Oph, Geers et al. (2011) selected member candidates from a deep ( = 20.6 mag) multi-band survey of 0.25 deg2 with near-infrared spectroscopic follow-up down to the deuterium-burning limit (Mužić et al., 2012). In the same region, Alves de Oliveira et al. (2012) presented optical spectroscopy of brown dwarf candidates as faint 20.5 mag (Alves de Oliveira et al., 2010), casting doubts about the membership of the T2-type member (Marsh et al., 2010) identified in a deep near-infrared survey (Marsh et al., 2010). Chiang & Chen (2015) presented two young early T-type candidates as well as a L-type dwarf identified in their methane and mid-infrared survey (Chiang et al., 2015). In Serpens, Spezzi et al. (2012) reported a few T-type candidates that require additional follow-up before deriving the IMF below the deuterium-burning limit. In Lupus-3, Mužić et al. (2014) conducted an optical and near-infrared survey of 1.4 deg2 down to planetary masses (0.009 M⊙ or = 18.3 mag) with one probable new brown dwarf (Mužić et al., 2015). In more mature clusters, Zapatero Osorio et al. (2014) confirmed seven early-L and L/T transition members in the Pleiades with masses in the 0.035–0.010 M⊙ range from a deep 0.8-deg2 survey (Zapatero Osorio et al., 2014). Bouvier et al. (2008) confirmed astrometrically and spectroscopically two early-T dwarfs with masses around 0.05 M⊙ in a deep optical survey of 16 deg2 in the 625 Myr-old Hyades cluster.
The spectroscopic characterisation of L dwarf members of young open clusters and star-forming regions has revealed key features sensitive to gravity. After photometric selection and astrometric confirmation (when possible depending on the mean proper motion of the cluster/region), weak gravity-sensitive features such as alkali lines (e.g. the potassium and sodium doublets) at optical and infrared wavelengths add strong credit to the membership of candidates (Martín et al., 1996; Luhman et al., 1998; McLean et al., 2000; Martín et al., 2001; Gorlova et al., 2003). Other criteria include weaker hydride (e.g. FeH and CrH) and stronger oxide (e.g. VO, TiO) bands (Kirkpatrick et al., 2006) and the presence of the triangular or peaked-shape of the -band spectra (Lucas et al., 2001), which together with the aforementioned features, are well-accepted low surface gravity features (Zapatero Osorio et al., 2000; Martín & Zapatero Osorio, 2003; Lodieu et al., 2008; Cruz et al., 2009; Scholz et al., 2012; Allers & Liu, 2013; Bonnefoy et al., 2014; Manjavacas et al., 2014; Mužić et al., 2014; Mužić et al., 2015; Martin et al., 2017).
Upper Scorpius (hereafter UpSco) is part of the nearest OB association to the Sun, Scorpius Centaurus. The region is nearby with a distance of 145 pc from Hipparcos (de Bruijne et al., 1997) and a recent update from Gaia (Fang et al., 2017, 144.217.6 pc;). UpSco is young with different age determinations and a possible spread among its members (Preibisch & Zinnecker, 1999; Preibisch et al., 2001; Pecaut et al., 2012; Song et al., 2012; Pecaut, 2016; Rizzuto et al., 2016). The members of UpSco exhibit a significant mean proper motion (de Bruijne et al., 1997; de Zeeuw et al., 1999; Fang et al., 2017, = 10.5 and = 23.2 mas/yr with a standard dispersion of about 6.4 mas/yr). The bright end of the UpSco population has been examined in X-rays (Walter et al., 1994; Kunkel, 1999; Preibisch et al., 1998), astrometrically (de Bruijne et al., 1997; de Zeeuw et al., 1999), and spectroscopically (Preibisch & Zinnecker, 2002). The low-mass and substellar population has been investigated over the past decade in great detail with the advent of modern detectors permitting wide and/or deep surveys (Ardila et al., 2000; Martín et al., 2004; Slesnick et al., 2006; Lodieu et al., 2006; Lodieu et al., 2007; Kraus et al., 2008; Béjar et al., 2008; Slesnick et al., 2008; Lafrenière et al., 2010; Dawson et al., 2011; Lodieu et al., 2011; Lafrenière et al., 2011; Dawson et al., 2013; Lodieu, 2013; Lafrenière et al., 2014; Dawson et al., 2014; Peña Ramírez et al., 2016; Best et al., 2017). The first transiting systems in the association have been announced in the last years thanks to the Kepler K2 mission (Borucki et al., 2010; Lissauer et al., 2014; Batalha, 2014), including a triple system made of a F star and two solar-type stars (Alonso et al., 2015) and several M dwarf eclisping binaries (Kraus et al., 2015; Lodieu et al., 2015; David et al., 2016). These systems are of prime importance because they provide the first mass and radius measurements independent of models in this region. Finally, we should note the existence of a transiting Neptune-size planet candidate around a M3 member of UpSco (Mann et al., 2016; David et al., 2016).
Our group has recently identified several tens of substellar and isolated planetary-mass candidates from a deep infrared survey of 13.5 square degrees in the central region of UpSco (Lodieu et al., 2013, hereafter L13), which represents the basis of the work presented in this paper. This photometric survey is among the widest and deepest in a young star-forming region to investigate the shape of the IMF at very low masses. Here, we present optical photometry in the Sloan filter obtained with the OSIRIS instrument (Cepa et al., 2000, Optical System for Imaging and low Resolution Integrated Spectroscopy;) on the 10.4-m Gran Telescopio de Canarias (GTC). We also present optical and near-infrared spectroscopy of photometrically-confirmed member candidates with GTC/OSIRIS and the European Southern Observatory (ESO) Very Large Telescope (VLT) X-shooter spectrograph (Vernet et al., 2011). In Section 2 we describe the optical photometric observations obtained with the GTC and its associated data reduction. In Section 3 we detail the spectroscopic follow-up conducted with ESO VLT for 15 member candidates in UpSco, including optical spectroscopic of a sub-sample with GTC/OSIRIS. In Section 4 we show mid-infrared photometry from the AllWISE public catalogue for the coolest UpSco members. In Section 5 we present an analysis of the photometric and spectroscopic properties of the L-type members in UpSco, discuss their membership and physical properties. We define the first sequence for young L dwarf members of the UpSco association with an age of 5–10 Myr. In the literature, it has been shown that the low gravity sequence of L dwarfs does not logically flow from the high gravity sequence. In this paper, we are looking to create a uniform sample out of the UpSco objects, which have the same metallicity and age.
| Name | R.A. | Dec | ExpT | Date | Seeing | Airmass | SDSS | |
|---|---|---|---|---|---|---|---|---|
| VISTA J | hh:mm:ss.ss | ∘:′:′′ | sec | yyyy-mm-dd | arcsec | mag | mag | |
| 160731612146544 | 16:07:31.61 | 21:46:54.4 | 1160 | 2014-08-27 | 0.7 | 1.87 | 23.420.21 | 5.380.27 |
| 160413042241034 | 16:04:13.04 | 22:41:03.4 | 1160 | 2014-08-28 | 0.8 | 1.87 | 22.160.22 | 3.990.23 |
| 161407562211522 | 16:14:07.56 | 22:11:52.2 | 1160 | 2014-08-23 | 1.3 | 1.92 | 22.650.28 | 4.390.28 |
| 160843432245162 | 16:08:43.43 | 22:45:16.2 | 1160 | 2014-08-23 | 1.3 | 1.86 | 23.080.21 | 3.480.64 |
| 160539092403328 | 16:05:39.09 | 24:03:32.8 | 1160 | 2014-08-23 | 1.3 | 1.84 | 23.180.26 | 4.860.26 |
| 160420422134530 | 16:04:20.42 | 21:34:53.0 | 1160 | 2014-08-31 | 1.2 | 1.89 | 22.320.22 | 3.910.23 |
| 160200002057341 | 16:02:00.00 | 20:57:34.1 | 1160 | 2014-08-21 | 0.9 | 1.80 | 22.770.21 | 4.270.21 |
| 160412342127470 | 16:04:12.34 | 21:27:47.0 | 1160 | 2014-08-24 | 1.3 | 1.79 | 22.690.21 | 4.170.22 |
| 160829152116296 | 16:08:29.15 | 21:16:29.6 | 1160 | 2014-08-21 | 0.9 | 1.70 | 23.240.22 | 4.550.22 |
| 160136922212027 | 16:01:36.92 | 22:12:02.7 | 3060 | 2014-08-01 | 1.2 | 1.80 | 23.670.23 | 4.400.24 |
| 161512702229492 | 16:15:12.70 | 22:29:49.2 | 3060 | 2014-08-17 | 1.5 | 1.79 | 23.500.22 | 4.160.23 |
| 161148922105286 | 16:11:48.92 | 21:05:28.6 | 3060 | 2014-08-18 | 1.6 | 1.69 | 24.05 | 4.38 |
| 161621042355201 | 16:16:21.04 | 23:55:20.1 | 3060 | 2014-08-12 | 0.9 | 1.62 | 24.05 | 4.05 |
| 161251832316500 | 16:12:51.83 | 23:16:50.0 | 3060 | 2014-08-16 | 0.9 | 1.74 | 23.910.23 | 4.070.25 |
| 161306552255327 | 16:13:06.55 | 22:55:32.7 | 3060 | 2014-08-03 | 0.9 | 1.68 | 22.450.21 | 2.650.23 |
| 161027632305543 | 16:10:27.63 | 23:05:54.3 | 3060 | 2014-08-11 | 0.9 | 1.71 | 21.260.20 | 1.260.25 |
| 160918682229239 | 16:09:18.68 | 22:29:23.9 | 1160 | 2014-08-26 | 0.9 | 1.70 | 22.870.21 | 4.930.25 |
| 161144372215446 | 16:11:44.37 | 22:15:44.6 | 1160 | 2014-08-24 | 1.0 | 1.71 | 22.450.21 | 4.590.26 |
| 160517052130449 | 16:05:17.05 | 21:30:44.9 | 1060 | 2014-08-28 | 0.8 | 1.88 | 22.330.21 | 3.950.21 |
| 161422562331178 | 16:14:22.56 | 23:31:17.8 | 260 | 2014-08-28 | 0.8 | 1.91 | 21.740.21 | 4.290.21 |
| 161302312124285 | 16:13:02.31 | 21:24:28.5 | 165 | 2014-08-28 | 0.8 | 2.05 | 21.960.21 | 4.780.21 |
| 155936382214159 | 15:59:36.38 | 22:14:15.9 | 165 | 2014-08-31 | 1.7 | 2.00 | 21.800.21 | 4.830.21 |
| 160727822239042 | 16:07:27.82 | 22:39:04.2 | 170 | 2014-08-28 | 0.8 | 2.20 | 21.140.21 | 4.280.21 |
| 161610642151243 | 16:16:10.64 | 21:51:24.3 | 165 | 2014-08-28 | 0.8 | 2.17 | 20.320.20 | 3.690.20 |
| 160714782321013 | 16:07:14.78 | 23:21:01.3 | 260 | 2014-08-28 | 0.8 | 2.33 | 20.890.21 | 4.330.21 |
| 161301402142547 | 16:13:01.40 | 21:42:54.7 | 160 | 2014-08-28 | 0.8 | 2.07 | 19.940.20 | 3.620.20 |
| 160606292335135 | 16:06:06.29 | 23:35:13.5 | 260 | 2014-08-31 | 1.6 | 2.26 | under spike | — |
| 160645542121593 | 16:06:45.54 | 21:21:59.3 | 260 | 2014-08-31 | 1.6 | 2.12 | 20.450.20 | 4.310.20 |
| 160818422232252 | 16:08:18.42 | 22:32:25.2 | 260 | 2014-08-28 | 0.8 | 2.25 | 20.260.20 | 4.170.20 |
2 Optical photometry with GTC
2.1 SDSS photometry
The OSIRIS instrument (Cepa et al., 2000) is mounted on the 10.4-m GTC operating at the Observatory del Roque de Los Muchachos (La Palma, Canary Islands). The detector consists of two 20484096 Marconi CCD42-82 with a 8 arcsec gap between them and operates at optical wavelengths from 0.365 to 1.0 m. The unvignetted instrument field-of-view is about 7′ 7′ with an unbinned pixel scale of 0.125 arcsec. We employed a 22 binning because it is currently the standard mode of observations. We placed all targets in the CCD2 because it provides the largest unvignetted field of view.
The observations were conducted in service during the month of August 2014 over several days (programme GTC4-14A; PI Lodieu). We list the dates of observations, exposure times, mean seeing at the time of observations, and airmass in Table 1. The conditions at the time of the observations were grey and clear or photometric except on 28 August 2014. However, the exposure times, seeing conditions, and airmass at the time of observations span wide ranges, resulting in a globally inhomogeneous photometric dataset. Bias and skyflats were obtained during the afternoon or morning of the respective nights. A photometric standard star was also observed with the same instrumental configuration as the science targets as part of the GTC calibration plan, except for the nights of 1, 11, 17, 27, and 28 August 2014. Four different standards were taken over the full period of observations for our program (SA 110-232; G 158-100, PG 1528, SA 109-381).
We imaged 31 member candidates in the UpSco association published by L13. We used mainly individual on-source integrations of 60 sec repeated many times to detect (or attempt a detection) of all UpSco candidates. The 60 sec integration is set by the brightness of the sky in the Sloan filter, where exposures longer than 120 sec usually saturate completely the detector. Table 1 provides the coordinates of the UpSco targets along with the measured -band magnitudes and inferred colours. We plot the positions of the GTC OSIRIS pointings in Fig. 1.
2.2 Data reduction and photometry
We reduced the OSIRIS optical images in a standard manner under the IRAF environment11 1 IRAF is distributed by National Optical Astronomy Observatory, which is operated by the Association of Universities for Research in Astronomy, Inc., under contract with the National Science Foundation. (Tody, 1986; Tody, 1993). We considered only the CCD2 of the detector where the target was located. First, we subtracted the median-combined bias and divided by the median-combined flat-field every single raw frame. Then, we averaged all frames to produce a final combined image for each target. All OSIRIS pointings contain one single UpSco target keeping in mind that the VISTA survey covered 13.5 deg2 of UpSco (Fig. 1), except in one case where two nearby sources were placed in the same OSIRIS field-of-view to save telescope time.
First, we calibrated astrometrically the combined images with a sequence of IRAF tasks: ccxymatch, ccmap, and mscimage. We identified bright sources with their pixel coordinates using daofind with a 10 detection threshold and used the 2MASS point-source catalogue (Cutri et al., 2003; Skrutskie et al., 2006) as reference to convert pixels into the world coordinate system. We included non-linear distortion terms to the tangent plane projection due to the slight rotation of the detector on the focal plane creating distortions at the edges of the images. We found that the x axis is rotated by 180 degrees towards the East and the y axis by one-tenth of a degree. The precision of final astrometry solution is of the order of or better than 0.15 arcsec in both axis.
| R.A. (GTC) | Dec (GTC) | xc | yc | R.A. (VISTA) | dec (VISTA) | zClass | yClass | jClass | Sep | ||||
|---|---|---|---|---|---|---|---|---|---|---|---|---|---|
| hh:mm:ss.ss | ∘:′:′′ | pix | pix | mag | hh:mm:ss.ss | ∘:′:′′ | mag | mag | mag | arcsec | |||
| 15:59:22.34 | -22:14:26.9 | 975.417 | 936.077 | 20.1880.047 | 15:59:22.34 | -22:14:27.3 | 20.0070.020 | 19.7030.046 | 19.4820.081 | -1 | -1 | -1 | 0.382 |
| … | … | … | … | … | … | … | … | … | … | … | … | … | … |
| 16:16:24.47 | -23:51:50.9 | 21.189 | 1776.340 | 17.1890.002 | 16:16:24.48 | -23:51:51.0 | 16.9480.004 | 16.6990.004 | 16.3350.005 | -1 | -1 | -1 | 0.119 |
We performed aperture and point-spread function (PSF) photometry with the task phot in IRAF. The full catalogue of sources in all OSIRIS pointings contains 15,354 objects. The depths of the combined images vary from pointing to pointing because of the observing strategy, which was strongly dependent on the on-source integration times (see Table 1) and the distinct airmass and seeing conditions at the time of observations. We adapted the photometric aperture to the seeing conditions of each combined image, choosing apertures of the order of 4 times the full-width-half-maximum.
We divided our candidates into two groups to perform aperture photometry:
-
For candidates clearly detected on the OSIRIS images, we directly extracted the photometry from the full catalogue (red filled dots in Fig. 2).
-
For the two remaining candidates below the 3 limit of detection (VISTA J161148922105286 and VISTA J161621042355201), we estimated the limited magnitudes as three times the root-mean-square at the expected location of the candidates as their flux peak and compared with the peak fluxes of three nearby isolated and well-detected stars with measured photometry (red arrows in Fig. 2).
To calibrate photometrically the OSIRIS images, we proceeded as follows: we obtained PSF photometry for both the target data and the standard stars using a zero point of 25 mag as starting point. The derived photometric zero points from the standard stars agree within 0.05 mag with those published by the observatory. For the targets observed on the nights with no photometric standard star available, we calibrate photometrically using the following procedure. First, we cross-matched the catalogue of OSIRIS sources with the full VISTAUKIDSS GCS catalogue. We produced a histogram of the colours for all the sources in the non-calibrated fields using the instrumental magnitudes in the -band and compared them with the combination of the same histograms of the UpSco fields with already calibrated photometry using standard stars. We shifted instrumental magnitudes in the -band to match the distribution of both histograms and convert them into apparent magnitudes. The uncertainty of this procedure is limited to the dispersion of the histograms and can be as high as 0.15–0.20 mag. We added this calibration error in quadrature to the photometric uncertainties derived from phot in IRAF.


The final -band magnitudes and their uncertainties (in the case of detections) are listed in Table 1 along with the associated colours. The error bars are dominated by the photometric calibration in most cases. We display the (,) colour-magnitude diagram with all optical detections with infrared counterparts in Fig. 2. We highlighted our candidates with larger symbols and 3 non-detections with right-pointing arrows. We conclude that most of our photometric candidates remain as potential UpSco members based on optical-to-near-infrared indices. Only two sources, VISTA J161306552255327 and J161027632305543, have blue colours that might indicate that they are field contaminants. This suggests that the minimum level of contamination in our original photometric sample is of the order of 7%. For comparison, we overplotted the sequence of field M and L dwarfs from M5 to L8 from the Sloan team (West et al., 2008; Schmidt et al., 2010) shifted to the distance of 145 pc.
3 Spectroscopic datasets
| R.A. | Dec | SpT | References | |||||
|---|---|---|---|---|---|---|---|---|
| mag | mag | mag | mag | mag | ||||
| 16:00:43.17 | 22:29:14.5 | 17.1120.004 | 16.0510.003 | 15.1970.003 | 14.6460.006 | 14.1740.004 | M6.5 | LM12 |
| 16:06:03.75 | 22:19:30.2 | 18.2920.007 | 16.9110.004 | 15.8110.004 | 15.1120.008 | 14.4160.005 | M8.75,L2 | LM12,L08a |
| 16:06:06.29 | 23:35:13.5 | — | 17.2200.007 | 16.2310.006 | 15.6190.012 | 14.9990.010 | L0,M8.5 | L08a,LM12,XSH |
| 16:07:14.78 | 23:21:01.3 | 19.0900.015 | 17.6770.009 | 16.5610.007 | 15.8070.016 | 15.1030.009 | M9.25,L0 | LM12,L08a |
| 16:07:23.81 | 22:11:02.1 | 17.2700.004 | 16.0450.003 | 15.1450.003 | 14.5650.006 | 13.9950.004 | M7.5,M8.5,L1 | H09,L11a,L08a,XSH |
| 16:07:27.82 | 22:39:04.2 | 19.4780.015 | 18.0140.009 | 16.8560.008 | 16.1530.021 | 15.4710.013 | M9,L1 | LM12,L08a |
| 16:07:37.98 | 22:42:47.1 | 19.2910.013 | 17.8750.008 | 16.7810.007 | 16.0910.020 | 15.4030.012 | M8.75,L0 | LM12,L08a,XSH |
| 16:08:18.42 | 22:32:25.2 | 18.5550.008 | 17.1570.005 | 16.0860.004 | 15.3870.011 | 14.6990.007 | M9.25,L0 | LM12,L08a,XSH |
| 16:08:28.47 | 23:15:10.5 | 17.7240.006 | 16.4240.004 | 15.4230.003 | 14.7950.007 | 14.1370.004 | M9,L1 | LM12,L08a,XSH |
| 16:08:47.44 | 22:35:48.1 | 17.8700.006 | 16.6390.004 | 15.7220.003 | 15.0800.009 | 14.5260.006 | M8,M9 | LM12,L08a |
| 16:10:47.13 | 22:39:49.6 | 17.4830.005 | 16.2050.003 | 15.2360.003 | 14.6310.006 | 14.0270.004 | M8.5,M9 | L11a,L08a,XSH |
| 16:14:41.68 | 23:51:06.0 | 18.5890.012 | 17.1570.006 | 16.0780.004 | 15.3570.010 | 14.6430.006 | M9.25,L1 | LM12,L08a |
| 16:15:16.66 | 23:40:46.5 | 17.9890.008 | 16.6740.004 | 15.6310.003 | 14.9350.006 | 14.2880.004 | M9 | L08a |
3.1 VLT/X-shooter spectroscopy
We carried out spectroscopy from the UV- to the -band with the X-shooter spectrograph (D’Odorico et al., 2006; Vernet et al., 2011) mounted on the Cassegrain focus of the Very Large Telescope (VLT) Unit 2. X-shooter is a multi wavelength cross–dispersed echelle spectrograph made of three independent arms covering simultaneously the ultraviolet (UVB; 0.3–0.56 m), visible (VIS; 0.56–1.02 m), and near–infrared (NIR; 1.02–2.48 m) wavelength ranges thanks to the presence of two dichroics splitting the light. The spectrograph is equipped with three detectors: a 40962048 E2V CCD44-82, a 40962048 MIT/LL CCID 20, and a 20962096 Hawaii 2RG for the UVB, VIS, and NIR arms, respectively.
3.1.1 New X-shooter near-infrared spectroscopy
We performed our observations in visitor mode during the second half of four nights on 11–14 April 2015. We set the read-out mode to 400k and low gain without binning. We used the 1.3 arcsec slit in the UVB and 1.2 arcsec slits in the VIS and NIR, yielding nominal resolving powers of 4000 (8.1 pixels per full–width–half–maximum), 6700 (7.9 pixels per full–width–half–maximum), and 3900 (5.8 pixels per full–width–half–maximum) in the UVB, VIS, and NIR arms, respectively. Conditions during the first part of the second half on the night of 11 April were affected by thin cirrus but the seeing remained around 1.0 arcsec or better. The third target, VISTA J160200002057341 turns out to be the most affected by the cirrus that increased in size and numbers during the observing blocks. The sky was clear and the seeing sub-arcsec during the remaining half nights. In addition, we retrieved the X-shooter spectra of six previously-known UpSco members with optical spectral types as well as another seven M/L-type transition members confirmed spectroscopically (Table 3), all of them belonging to the sequence of VISTA candidates (L13). We report the list of targets and detailed logs of observations in Table 4.
We set the individual on-source integration times to 300 sec in the NIR arm and used multiple AB patterns to correct for the sky contribution (mainly) in the near-infrared. All observations were conducted with the slit oriented at parallactic angle. We acquired the faintest targets ( 17.5 mag) with blind offsets, i.e. we pointed to a bright star within 30 arcsec or less and applied an offset using the positions of the bright star and the target measured on the deep VISTA images. We provide the coordinates of the targets observed with X-shooter and their -band magnitudes in Table 4. We also give the date of the observations, the number of exposures and individual on-source integrations in each arm. We did not detect any of our targets in the UVB region and little flux in the VIS arm even for the brightest sources so we focus on the data reduction and analysis of the NIR spectra only in the rest of the paper.
3.1.2 Data reduction of X-shooter spectra
We reduced the X-shooter NIR spectra of 15 targets listed in Table 4 with the esoreflex pipeline version 2.8.1. It is a graphical interface using a sequence of command lines from the esorex package that produces fully calibrated 2D and 1D spectra. The pipeline includes the following steps: first a bad pixel map is created using a set of 40 linearity frames taken within 10 days of our run to identify non-linear pixels. Next, a master bias and master dark are created for the optical and near-infrared data, respectively. Afterwards, a first guess order and arc line tables created by illuminating the X-shooter pinhole mask with a continuum and arc lamp are produced. Later, a master flat and an order table tracing the flat edges before establishing the 2D map of the instrument are constructed. Subsequently, the efficiency of the whole system made of the telescope, instrument, and detector is determined. Finally, 2D spectra for the targets, telluric standards, and flux standards are generated. We used the final 2D spectra produced by esoreflex rather than the final 1D spectra because of the faintness of our targets. We should also emphasise that the pipeline does not correct for telluric bands. Moreover, the ESO staff has informed us about a problem with the sky illumination of the last order of X-shooter which leads to a jump in the spectra at 2.27 m where the last and the next to last order are joined. This issue affects solely the determination of the CO spectral index (Section 5.3) by making it larger; because of this artefact, we do not use the CO spectral index (Burgasser et al., 2002) in our analysis. We also note the presence of a possible artefact around 2.1 microns in some of our targets, which affects indices including the -band region of the spectra (CH4-K, KH, H2O-D2, H2O-2, sH2OK).
We carried out the next steps under the IRAF environment. First, we extracted a 1D spectrum for our targets and their associated telluric standard stars with the IRAF routine apsum. To correct for the telluric bands and lines, we fit the 1D spectrum of the telluric stars taken each night within splot and normalised the continuum to one. We removed the strongest Paschen and Bracket lines in the spectrum of the telluric late-B star in the resulting spectrum. Finally, we divided the spectrum of our targets by this spectrum of the telluric standard and multiplied by a blackbody with the effective temperature of the telluric standard. The final NIR spectra of the UpSco member candidates are displayed in Fig. 3. We compare the X-shooter spectra of our candidates with known low- and high-gravity dwarfs in Fig. 3. We present the internal UpSco comparison in Fig. 6, where the spectral change of some key features can be seen from earlier to later spectral types. We use this figure 6 to establish a relative spectral sequence of our data in Section 5.2.
3.1.3 Known UpSco members with X-shooter spectra
We cross-matched our list of VISTA candidates with the literature and found that several candidates have been previously confirmed as members of the UpSco association in the literature. A few of them (6) have also been observed with VLT/Xshooter by other groups. We list these objects with their infrared magnitudes and spectral types in Table 3.
We reduced the six X-shooter spectra downloaded from the ESO archive with the same version of the pipeline. We extracted the 1D spectra from the 2D images created by the pipeline. We corrected those spectra for telluric bands with the molecfit package distributed by ESO (Kausch et al., 2015; Smette et al., 2015)22 2 http://www.eso.org/sci/software/pipelines/skytools/molecfit mainly because no specific telluric standard was taken at the same time and airmass as these targets. The 0.55–2.4 m optical-to-infrared spectra of these six M8.5–M9.25 UpSco members are displayed in Fig. 7. They represent benchmark 5–10 Myr-old objects for future discoveries of young brown dwarfs in moving groups due to the high quality of their spectra and the intermediate spectral resolution.
| ID | Name | Date | ExpT | |
|---|---|---|---|---|
| VISTA J | mag | yyyy-mm-dd | sec | |
| 5 | 161144372215446 | 17.8610.016 | 2015-04-11 | 10300 |
| 10 | 161407562211522 | 18.2510.022 | 2015-04-11 | 12300 |
| 12 | 160200002057341 | 18.5000.032 | 2015-04-11 | 12300 |
| 11 | 160539092403328 | 18.5000.032 | 2015-04-11 | 12300 |
| 2 | 161302312124285 | 17.1750.011 | 2015-04-12 | 4300 |
| 14 | 160136922212027 | 19.2700.066 | 2015-04-12 | 12300 |
| 9 | 160413042241034 | 18.1670.025 | 2015-04-12 | 10300 |
| 13 | 160420422134530 | 18.4130.029 | 2015-04-12 | 12300 |
| 7 | 160918682229239 | 17.9400.017 | 2015-04-12 | 10300 |
| 1 | 155936382214159 | 16.9700.009 | 2015-04-12 | 4300 |
| 15 | 161512702229492 | 19.3390.057 | 2015-04-13 | 12300 |
| 8 | 160731612146544 | 18.0400.022 | 2015-04-13 | 10300 |
| 4 | 160517052130449 | 17.7880.017 | 2015-04-13 | 10300 |
| 6 | 160956362222457 | 17.8670.016 | 2015-04-13 | 10300 |
| 3 | 161422562331178 | 17.4560.012 | 2015-04-13 | 6300 |


3.2 GTC OSIRIS optical spectroscopy
We collected low-resolution optical spectra with GTC OSIRIS for all 15 UpSco targets with X-shooter near-infrared spectra (Table 5). We carried out the observations in two visitor mode run over six half nights between 7 and 13 June 2016 (programme GTC25-16A; PI Lodieu) and five half-nights on 25–29 May 2017 (programme GTC40-17A; PI Lodieu). In 2016, the nights were dark to grey with the moon increasing from 20% illumination up to 57% between 7 and 12 June 2016. The seeing was typically sub-arcsec during the first three nights except during the first 1h on the night of 9 June. The night of 10 June was lost due to technical problems and high humidity. The night of 11 June was affected by strong wind altering the seeing (measured between 1.5 and 2.0 arcsec). The last night was affected by bad seeing (2.5 arcsec). We collected a spectrum for VISTA J161407562211522 on 2 July 2016 in service mode under dark time, clear conditions, and seeing around 0.8 arcsec. In May 2017, the nights were also dark and the skies clear every night. The seeing was sub-arcsec during the first four nights and variable between 1.1 and 1.5 arcsec on the last night (29 May).
We obtained low-resolution optical spectra with the R300R grating covering the 4800–10000Å and a slit of 1 arcsec resulting in a spectral resolution below 300. We acquired our targets in the Sloan -band filter due to their faintness at optical wavelengths. We used on-source integrations between 20 min and 40 min for the brightest and faintest targets shifted along the slit several times by a few arcsec (between 5 and 12 arcsec) to avoid nearby stars in constant AB patterns (a similar technique used in the near-infrared). We provide the journal of observations in Table 5. We placed a bright ( 18 mag) nearby (50 arcsec) reference star in the slit to calculate the shifts along the slit with the highest precision possible, implying that our targets were not observed at parallactic angle. However, prior to three of our targets, we observed the reference star alone at parallactic angle to evaluate the loss of light. We concluded that the effect of the angle was negligible redwards of 6500Å. Hence, our targets remain unaffected because very little or no flux is seen at these blue wavelengths.
Because of the poor seeing on 12 June, we obtained optical spectra of a few bright late-M and L dwarf members of Upper Sco classified in the near-infrared based on Gemini spectra (Lodieu et al., 2008). The targets are listed in the bottom part of Table 5. We opted for this backup program because of the earlier spectral types reported by Herczeg et al. (2009) for two L dwarfs (VISTA J160723.82221102.0 and VISTA J160603.75221930.0) published in Lodieu et al. (2008). We plot these objects in Fig. 10 and discuss the discrepancy between optical and near-infrared classifications in Section 5.4.
We reduced the optical spectra under the IRAF environment (Tody, 1986; Tody, 1993) in a standard manner. First, we median-combined the bias and flat-fields taken during the afternoon which we used only for the spectrophotometric standard stars and the reference stars. We calibrated the 1D spectra with the response function derived from two spectrophotometric standard stars: Ross 640 classified as DZA5.5 (Greenstein & Trimble, 1967; Harrington & Dahn, 1980; Wesemael et al., 1993; Monet et al., 2003; Cutri et al., 2003; Lépine & Shara, 2005) and the sdB1 Feige 66 (Reed, 2003; Gontcharov, 2006; van Leeuwen, 2007). We also corrected for the second order contamination by observing the standard star with the R300R grating and the R300R+SDSS filter. We calibrated our spectra in wavelength with HgArXeNe lamps taken during the afternoon with a dispersion of 7.9 Å and a rms better than 0.5 Å. For the reference stars, we subtracted the mean bias from the raw spectrum of the target and divided by the normalised flat field. We extracted the one-dimensional spectrum by choosing optimally the aperture and the background level. For the targets, we produce images subtracting the “B” position from the “A” position to improve the sky subtraction in the red optical part where most of the flux of our targets is concentrated. Then, we extracted the 1D spectrum optimally and averaged them to produce the final spectra displayed in Fig. 8 separating the objects observed in June 2016 (left panel) and May 2017 (right panel). We display the two strong Hα emitters in Fig. 9. We normalised the final OSIRIS optical spectra at 8250Å and compare them to field late-M and early-L dwarfs.
| Name | Date | ExpT | Hα | |
| mag | yyyy-mm-dd | sec | ||
| 155936382214159 (L1.0) | 19.523 | 2016-06-07 | 21200 | |
| 161302312124285 (L1.5) | 19.955 | 2016-06-11 | 41500 | |
| 161407562211522 (L4.5) | 21.027 | 2016-07-02 | 41800 | |
| 160420422134530 (L6.0) | 21.138 | 2016-06-07 | 41200 | |
| 160136922212027 (L7.0) | 22.250 | 2016-06-08 | 52300 | |
| 161512702229492 (L7.0) | 22.402 | 2016-06-09 | 62300 | Yes |
| 161422562331178 (L2.0) | 20.236 | 2017-05-25 | 41200 | |
| 160517052130449 (L2.0) | 20.356 | 2017-05-25 | 41200 | |
| 160918682229239 (L3.0) | 20.777 | 2017-05-28 | 41800 | |
| 160731612146544 (L4.5) | 20.760 | 2017-05-26 | 41500 | Yes |
| 161144372215446 (L5.0) | 20.946 | 2017-05-27 | 41800 | Yes |
| 160539092403328 (L4.5) | 21.103 | 2017-05-27 | 41800 | |
| 160200002057341 (????) | 21.372 | 2017-05-28 | 41800 | Yes |
| 160413042241034 (L6.0) | 20.652 | 2017-05-26 | 41500 | |
| 160420422134530 (L6.0) | 21.138 | 2017-05-29 | 31200 | |
| 154722822139143 (L0) | 19.94 | 2016-06-12 | 11200 | Yes |
| 160606292335133 (L0) | 18.43 | 2016-06-12 | 11200 | |
| 160727822239040 (L1) | 19.36 | 2016-06-12 | 11200 | |
| 160737992242470 (L0) | 19.24 | 2016-06-12 | 11800 | |
| 160828472315104 (L1) | 17.64 | 2016-06-12 | 11200 | Yes |
| 160830492335110 (M9) | 16.95 | 2016-06-12 | 1900 | Yes |
| 161228952159361 (L1) | — | 2016-06-12 | 11800 | |
| 161441682351059 (L1) | 18.40 | 2016-06-12 | 11800 | |


3.3 GTC EMIR infrared spectroscopy
We also used the Multi-object Infrared Spectrograph (Garzón & EMIR Team, 2016, EMIR;) mounted on the Naysmith-A focus of the GTC to obtain the near-infrared spectrum of USco J155150.2213457. We collected these data as part of an EMIR science verification project. This object was first identified by Peña Ramírez et al. (2016) using photometric, astrometric, and spectroscopic techniques, and was classified as a low-gravity L6 1 dwarf based on the presence of strong VO absorption at 1.06 m, the triangular shape of the -band pseudo-continuum, and the red nature of its spectrum. EMIR is equipped with a 2048 2048 pixel Teledyne HAWAII-2 HgCdTe detector with a pixel scale of 0.2 arcsec on the sky. We acquired the EMIR data of USco J155150.2213457 with the spectroscopic filter, a 0.8 arcsec long slit, and the grism as the dispersive optical element. This instrumental configuration yields low-resolution spectra (R 740) covering the wavelength interval 0.92–1.33 m. We obtained a total of 32 individual spectra of 120 sec each (total on-source integration time was 3840 sec) following a nodding ABBA pattern with offsets of 10″. The observing conditions were photometric and the seeing was 1.2 arcsec on the night of 8 April 2017. We also observed the field L6 dwarf 2MASS J101014800406499 (Cruz et al., 2003; Jameson et al., 2008) with the same instrumental configuration and an exposure time of 4 360 s. We used this field L6 dwarf as a spectral standard indicative of high-gravity features. We reduced the EMIR raw spectra in the same manner as the X-shooter data. We performed wavelength calibration using observations of an HgAr lamp and we corrected the instrumental response with the observations of a hot B3V-type star. We removed the telluric contribution from the targets data using the same hot star, since it was observed at related airmasses.
Figure 11 shows the EMIR spectra. Although the optical-to-near-infrared rising slope of both USco J155150.2213457 and the L6 standard is very similar to each other at these wavelengths, some individual features are clearly different. The molecular absorptions at 1.06 m (VO), 1.18 m (VO), and 1.25 m (TiO) appear significantly stronger in the UpSco object, while the absorption at 0.99 m (FeH) is weaker in relative terms probably because of the low gravity atmosphere of the UpSco source (McGovern et al., 2004; Martin et al., 2017, see also discussion in).

4 AllWISE mid-infrared photometry
We cross-matched the list of 15 candidates with X-shooter spectra with the AllWISE catalogue (Wright et al., 2010) using a matching radius of five arcsec. Most targets were found within 0.3 arcsec of the position extracted from our VISTA catalogue. We found that 11 of them have reliable WISE and photometry (flags of A and B) with signal-to-noise ratios larger than six and a minimum of 19 flux measurements in each band (Table 6). The remaining four sources (abbreviated names are VISTA J16022057, VISTA J16052403, VISTA J16092222, and VISTA J16142331) are detected in the images at 3.6 and 4.5 m but have no entry in the AllWISE catalogue mainly because they are either very faint (2 cases) or close to another brighter star (3 cases, 1 common to the very faint case).
To define a clean infrared sequence of the lowest mass members in UpSco, we also cross-correlated the list of 67 VISTA candidates (Table 2 of L13) with AllWISE. This query retrieved 51 sources with no deblending and reliable and photometry. We show the resulting near-infrared vs mid-infrared colour-magnitude diagrams for these two samples in Fig. 12. We overplotted the sequence of field M/L/T dwarfs derived from the polynomial fits given in Table 14 of Dupuy & Liu (2012), shifted to the distance of UpSco. The field sequence lies well below the UpSco sequence because of the difference in age between the association (Preibisch et al., 2001; Pecaut et al., 2012; Song et al., 2012, 5–10 Myr;) and field dwarfs (typically 1 Gyr or older). We also added to this diagram the WISE photometry for the eight M9–L1 UpSco members with near-infrared photometry from Lodieu et al. (2008) listed in Table 6. In Fig. 13 we plot the (,) colour-colour diagram with the same symbology.
| Name | ||
|---|---|---|
| mag (SNR) | mag (SNR) | |
| 155936382214159 | 15.2140.045 (24) | 14.7840.071 (15) |
| 161302312124285 | 15.4950.055 (19) | 14.9930.083 (13) |
| 161422562331178 | — — (—) | — — (—) |
| 160517052130449 | 15.9580.060 (18) | 15.9250.172 ( 6) |
| 161144372215446 | 15.3030.045 (24) | 14.7260.070 (15) |
| 160956362222457 | — — (—) | — — (—) |
| 160918682229239 | 15.5390.051 (21) | 15.3170.114 ( 9) |
| 160731612146544 | 15.1470.040 (27) | 14.5960.062 (17) |
| 160413042241034 | 15.4620.049 (22) | 15.2540.105 (10) |
| 161407562211522 | 15.5700.051 (21) | 15.2900.105 (10) |
| 160539092403328 | — — (—) | — — (—) |
| 160200002057341 | — — (—) | — — (—) |
| 160420422134530 | 15.6950.051 (21) | 15.3320.110 ( 9) |
| 160136922212027 | 16.3000.076 (14) | 15.5200.139 ( 7) |
| 161512702229492 | 16.5290.100 (10) | 15.7290.156 ( 6) |
| 154722802139143 | 13.6900.072 (15.0) | 13.0290.033 (33.3) |
| 160606292335133 | 14.5340.030 (35.8) | 13.9870.042 (26.0) |
| 160727822239040 | 15.0150.038 (28.3) | 14.4550.066 (16.4) |
| 160737992242470 | 15.0980.039 (27.7) | 14.7430.075 (14.4) |
| 160828472315104 | 13.7650.027 (40.2) | 13.1790.030 (36.3) |
| 160830492335110 | 13.3600.026 (41.4) | 12.8410.029 (37.8) |
| 161228952159361 | 14.1970.029 (37.2) | 13.6390.039 (28.2) |
| 161441682351059 | 14.3000.029 (37.4) | 13.8810.041 (26.8) |


5 Characterisation of young L-type members of UpSco
As illustrated in Figures 2, 3, 6, and 7, we have optical and near-infrared photometry and spectroscopy of a significant number of high-probability member candidates of UpSco (5–10 Myr, d 145 pc, solar metallicity) that span almost 2.5 mag in the -band (from 17.0 to 19.3 mag). We discuss the morphological changes observed in the spectra in subsequent sections. Because our targets likely share the same age and metallicity and are located at the same distance (the intra-cluster distances have a negligible impact in the following discussion), we attribute these changes to a sequence of spectral types and different effective temperatures (), although additional effects, like the presence of dusty clouds or veiling due to strong accretion, may also imprint complex spectral signatures. Our goal is to establish a proper classification of these coeval objects, thus complementing the efforts made by other groups regarding the analysis of spectra of members of intermediate-age (10 Myr) stellar moving groups (Allers & Liu, 2013; Gagné et al., 2015; Filippazzo et al., 2015; Faherty et al., 2016; Liu et al., 2016, e.g.).
5.1 Photometric properties
We assessed further the membership of our VISTA candidates with the SDSS imaging obtained with the GTC. Using the (,) colour-magnitude diagram of Fig. 2, we already removed two likely contaminants from the sample of UpSco VISTA candidates (see Section 2). The remaining sources, including -band non-detections, follow a sequence redder than field stars along the line of sight of UpSco.
We also check the mid-infrared photometry of our candidates. We find that UpSco members define a sequence with a high level of dispersion in the near-infrared vs mid-infrared diagrams presented in Fig. 12, from = 14 mag down to = 19.5 mag (equivalent to 13–17.5 mag). Late-M dwarfs show a trend towards brighter magnitudes with younger ages. However, studies in young moving groups suggest that younger L dwarfs have similar magnitudes to older field L dwarfs in the near-infrared ( bands) with a tendancy to be brighter in the WISE passbands (Gagné et al., 2015; Faherty et al., 2016; Liu et al., 2016). We overplotted the sequence of field L dwarfs with its dispersion in the near-infrared to mid-infrared diagrams to gauge the redness of our UpSco member candidates. We observe that UpSco members lie above of the field sequence shifted to the distance of the association. The candidates presented in this paper overlap and extend the sequence of M9–L1 dwarfs confirmed spectroscopically in the near-infrared with Gemini/GNIRS (Lodieu et al., 2008; Herczeg et al., 2009, dots with open squares in Fig. 12). We note that VISTA J160830492335110 (Lodieu et al., 2008, M8.5opt, M9ir;) is clearly detected in the WISE band with a magnitude of 11.6210.266, advocating that this object most likely harbours a disk (Table 6). This source lies on top of the UpSco sequence in both near-infrared to mid-infrared colour-magnitude diagrams (Fig. 12), particularly in the (,) diagram (black dots with open red squares). Three other sources appear above the sequence in the colours (VISTA J160828472315104; VISTA J154722802139143, and VISTA J160606292335133), which might suggest either the presence of a disk or a close-in companion although additional effects cannot be discarded at these ages (e.g. photometric errors, extinction; Table 6). The other possible explanation lies in the role of the accretion history of low-mass stars and brown dwarfs during the early stages of their formation (Baraffe et al., 2016). On the contrary, one of the 15 candidates with X-shooter spectra, USco 160517052130449, lies below the sequence, even below the sequence of field stars shifted to the distance of UpSco, suggesting it might not be true member of UpSco but older. One of the 15 targets might exhibit considerable flux excesses in the passband: VISTA J16072146 (#8). This object is discussed further in Section 5.2.4, where we report the detection of H emission in its GTC/OSIRIS optical spectrum.
Overall, the positions of 14 out of 15 of our candidates in several colour-colour magnitude over a wide wavelength range add credit to their membership to the UpSco association.
5.2 Spectral classification
5.2.1 Word of caution
First, we note that several authors have reported discrepancies between the optical and near-infrared spectral classifications of young late-M and L dwarfs. This trend was mentioned first by Martín et al. (2001) and corroborated by the optical spectra of faint Ori members (Barrado y Navascués et al., 2001). Later, Luhman et al. (2003) found a systematic offset between optical and -band (2.0–2.4 m) spectral types of young late-M dwarf members of IC 348, the latter being consistently 1–2 subclass later. This effect was already pointed out for members of the Ophiuchus region (Luhman & Rieke, 1999) and confirmed in Taurus (Luhman et al., 2016) and in other moving groups and associations (Pecaut, 2016). Lucas et al. (2001) independently mentioned this effect comparing the observed optical and -band spectra with the physical parameters derived the synthetic models of Allard et al. (2001). Allers & Liu (2013) also emphasise the fact that their qualitative classification of young L dwarfs shows an offset of 1 subclass between infrared and optical spectral types.
In UpSco, Béjar et al. (2008) classified UScoCTIO 108B as a M9.5 dwarf from its low-resolution optical (0.55–0.95 m) spectrum by comparison with Ophiuchus members and old field stars. However, they quote a spectral type of L3 from their -band spectrum (1.15–1.3 m) by comparison with field L dwarfs. This discrepancy is comparable to the inconsistency between the infrared and optical spectral types of VISTA J160723.82221102.0 (L1 vs M8.5) and VISTA J160603.75221930.0 (L2 vs M8.75) reported by Lodieu et al. (2008) and Herczeg et al. (2009), respectively.
In this paper, we will classify our targets independently in the optical and in the near-infrared for those followed up in both wavelength regions. We would like to stress the importance of stellar clusters to define reliable photometric and spectroscopic sequences of members that have distinct masses (therefore varying luminosities and magnitudes) but same age, distance, and metallicity. The increasing numbers of bright, young L dwarf member candidates (typically L5) of stellar moving groups during the past years (Gagné et al., 2014; Malo et al., 2014; Gagné et al., 2015; Faherty et al., 2016; Liu et al., 2016, e.g.) contrasts with the limited numbers of late-M and early-L type members of young clusters and star-forming regions with good-quality optical and near-infrared spectra (Barrado y Navascués et al., 2001; Martín & Zapatero Osorio, 2003; Allers et al., 2007; Lodieu et al., 2008; Herczeg et al., 2009; Cruz et al., 2009; Bayo et al., 2011), some of them used as comparison in this work. With this paper, we will alleviate this lack of data and will provide a sequence of young L-type spectra for the age of 5–10 Myr and solar metallicity.
5.2.2 Relative near-infrared classification
First, we compare the set of X-shooter spectra of our targets (Sect. 3.1; Figs. 3 and 6) against each other to reveal similarities and differences and define a relative classification where later objects have steep pseudo-continuum slopes, the strongest water bands, and less intense VO. We use abbreviated names below.
-
VISTA J15592214 is the earliest target of all with = 16.9700.009 mag and = 1.330.02 mag.
-
VISTA J16132124 ( = 17.180.01, = 1.410.02) is similar to VISTA J15592214 in the -band while the blue part of the -band appears in between the fluxes of VISTA J15592214 and VISTA J16112215. The -band region is similar to VISTA J16052130 ( = 17.790.02, = 1.430.03). Overall, we classify this source as intermediate between the earliest source and VISTA J16052130.
-
VISTA J16052130 is relatively brighter than VISTA J15592214 in and . The blue part of the -band exhibits more flux while the red part of the -band is identical.
-
VISTA J16142331 ( = 17.460.01, = 1.440.02) is identical to VISTA J16052130 so we assign one subtype later than the earliest source to both objects.
-
VISTA J16112215 ( = 17.860.02, = 1.960.03) is similar to VISTA J16132124 in but relatively much brighter in and .
-
VISTA J16092222 ( = 17.870.02, = 1.680.03) shows almost no absorption in the VO band at 1.06 m, displays a stronger CO absorption band at 2.3 m, and has a flatter -band than any other source in our sample, suggesting that it is a field L4.5 dwarf rejected as a member as of the association.
-
VISTA J16092229 ( = 17.940.02, = 1.840.03) is similar to VISTA J16132124 in but twice brighter than VISTA J16132124 and fainter than VISTA J16112215 in and . Its overall SED is intermediate between VISTA J16132124 and VISTA J16092222 and exhibits features of youth such as VO absorption at 1.06 micron and the peaked -band.
-
VISTA J16022057 ( = 18.500.03, = 2.120.04) is difficult to classify: it shows much more straight -band spectrum with weak VO absorption than other objects in our sample. It also has a flat -band with weak water bands, and a more depressed red part of the -band. However, it is almost as bright as VISTA J16112215 in and . Nonetheless, we cast doubts on its membership.
-
VISTA J16072146 ( = 18.040.02, = 1.780.03) is identical to VISTA J16142211 ( = 18.250.02, = 1.840.04) and VISTA J16052403 ( = 18.320.03, = 1.940.04). They are similar to VISTA J16092229 in but appear slightly brighter in and have similar flux level in . We note that VISTA J16072146 shows an excess in the 1.27–1.32 m and is the reddest in our sample at these wavelengths. We also note that VISTA J16052403 displays extra flux in the 2.08–2.015 m region which might be due to a problem with the merging of the X-shooter orders.
-
VISTA J16042241 ( = 18.170.03, = 1.770.04) and VISTA J16042134 ( = 18.410.03, = 1.900.04) are identical. They are similar to VISTA J16072146 with shallower VO absorption band at 1.06 m, similar flux in and slightly more flux in . They are relatively brighter than VISTA J16112215 in and , hence later than both VISTA J16072146 and VISTA J16112215.
-
VISTA J16152229 ( = 19.340.06, = 2.170.08) and VISTA J16012212 ( = 19.270.07, = 2.220.08) are very similar. They are the reddest objects in our sample and shows the strongest water absorption bands. The VO absorption at 1.06m is weaker than earlier sources, but the disappearance of this feature might be the result of lower temperature because both of them show clear features characteristics of youth (peaked -band, weak gravity-sensitive doublets).


5.2.3 Tentative absolute near-infrared classification
In this section, we attempt to define a tentative spectral classification by comparison with the known sequence of field L dwarf using templates downloaded from the SpeX archive33 3 http://pono.ucsd.edu/adam/browndwarfs/spexprism/index_old.html.
We also compared our spectra to the two known mid-L dwarf reported as photometric and spectroscopic members in USco: 1RXS J1609291210524 (Lafrenière et al., 2008; Lafrenière et al., 2010, L4;) and USco J1551502213457 (Peña Ramírez et al., 2016, L61;) as well as a sample of young L dwarfs whose spectra are available from J. Gagné’s webpage (Gagné et al., 2015)44 4 https://docs.google.com/spreadsheets/d/1136rRdcjHZJoe00mt4kPeWU8ZNORcPe-w4cipkDKGRc/edit?pref=2&pli=1#gid=0 and in the Pleiades (Zapatero Osorio et al., 2014). We should point out that 1RXS J1609291210524 might harbour a disk (Wu et al., 2015) so we should be cautious using it as a spectral template. We detail our comparisons below going from the brightest to the faintest sources. The results are given in Table 7 and shown in Fig. 4.
-
VISTA J15592214 is the earliest member in our sample. Its overall shape is best reproduced by an early-L dwarf; the -band is best fit by a L1 while the resemble a L0. We assign a near-infrared spectral type of L1.00.5 to this source (Fig. 4), consistent with the overall SED of 2MASS J232556040259508 (Gagné et al., 2015, L1;).
-
The spectra of VISTA J16132124 and VISTA J16142331 look similar and are well reproduced by the SpeX spectrum of Kelu 1 (Ruiz et al., 1997; Kirkpatrick et al., 1999; Stumpf et al., 2008, L2opt; L3ir_pec). Therefore, we classify VISTA J16132124 as a L1.5 and VISTA J16142331 as L2 member of UpSco with an uncertainty of half a subclass.
-
The spectrum of VISTA J16052130 looks similar to the SpeX spectrum of Kelu 1. The absorption at 1.06 micron is almost absent and the -band spectrum is not as peaky as for the other candidates, casting doubt on its spectroscopic membership. We classify this object as a L2 dwarf.
-
VISTA J16112215 is best fit by the SpeX spectrum of a field L6 dwarf (Fig. 4) although the water bands in and suggest a slightly earlier spectral type. It is brighter in and than 1RXS J1609291210524 (Lafrenière et al., 2008; Lafrenière et al., 2010, L4;) and shows an excess in the colour-magnitude diagrams using WISE passbands (Section 4; Fig. 12) so we assign it a spectral type of L5 throughout the paper but keep in mind that its spectral type is most likely L2exc1 with an infrared excess.
-
VISTA J16092222 is well fit by a field L4.5 dwarf from the SpeX archive. as described earlier, its spectrum does not show features of youth, fact corroborated by the comparison with a young L3 (Gagné et al., 2015). Hence, we discard this source as a member of UpSco and assign it a spectral type of dL3.00.5.
-
The spectrum of VISTA J16092229 is perfectly fit by the spectrum of 2MASS J015314636744181 (Reid et al., 2008; Gagné et al., 2015, L3;). The object shows clear features of youth such as the VO absorption at 1.06 m and the peaked -band so we classify it as a L3.00.5 member of UpSco.
-
VISTA J16072146, VISTA J16142211, and VISTA J16052403 show a SED similar to the SpeX L4.5 template and are comparable to the near-infrared spectrum of 1RXS J1609291210524. Hence, we classify them as L4.50.5 members of UpSco. We note that VISTA J16072146 exhibits a possible excess in as discussed in Section 5.1.
-
VISTA J16022057 is difficult to classify and could not assign it a spectral type because none of the field or young L dwarf template display a good fit. We do not detect strong water bands in its infrared spectrum. We leave its classification open at this stage.
-
VISTA J16042134 and VISTA J16042241 are well fit by the spectrum of USco J1551502213457 (Peña Ramírez et al., 2016, L61;). They are redder than VISTA J16112215 that we classify as L5 and earlier than the two coolest sources (see next bullet). Their infrared spectra compare well with the SpeX L7 template, except for a stronger VO absorption and peaked -band feature. Therefore, we classify them as L61 member of UpSco.
-
VISTA J16012212 and VISTA J16152229 are the coolest members and appear later than any other of our target. In the classification of field L dwarfs, the reddest sources in and have spectral types of L7 and L7.5. Moreover, the 1.5–2.4 m region is very similar to the SED of Calar 21 (Zapatero Osorio et al., 2014, L71;). Both of them are fairly well fit by a field L7 spectrum, except for a stronger VO absorption, a peaked -band feature, and more flux in . Therefore, we assign to them the latest spectral type, L71.
| ID | Name | SpTNIR | EWNaI | EWKI | EWKI | RV_index | RV_CC | |
|---|---|---|---|---|---|---|---|---|
| VISTA J | mag | Å | (Å,Å) (Å,Å) | (Å,Å) (Å,Å) | km/s | km/s | ||
| 1 | 155936382214159 | 16.970 | L1.00.5 | 0.37 | (1243.11,1252.10) (0.18,0.23) | (1168.90,1177.05) (0.25,0.35) | 9.114.83 | Reference |
| 2 | 161302312124285 | 17.175 | L1.50.5 | 0.33 | (1243.05,1252.03) (0.21,0.23) | (1168.93,1177.12) (0.27,0.48) | 8.914.5 | 3.71.3 |
| 3 | 161422562331178 | 17.456 | L2.00.5 | 0.41 | (1243.12,1252.12) (0.16,0.22) | (1169.02,1177.13) (0.44,0.43) | 10.438.8 | 14.51.3 |
| 4 | 160517052130449 | 17.788 | dL2.00.5 | 0.36 | (1243.17,1252.09) (0.27,0.26) | (1168.90,1177.17) (0.67,0.79) | 0.217.7 | 17.22.6 |
| 5 | 161144372215446 | 17.861 | L5.01.0 | 0.43 | (1243.03,1252.06) (0.14,0.16) | (1168.76,1177.05) (0.19,0.32) | 23.915.9 | 0.611.6 |
| 6 | 160956362222457 | 17.867 | dL30.5 | 0.35 | (1243.15,1252.10) (0.67,0.66) | (1169.02,1177.16) (0.68,0.66) | 9.419.1 | 13.76.7 |
| 7 | 160918682229239 | 17.940 | L3.00.5 | 0.25 | (1243.11,1252.08) (0.25,0.27) | (1168.94,1177.13) (0.30,0.36) | 1.29.2 | 6.87.0 |
| 8 | 160731612146544 | 18.040 | L4.50.5 | 0.24 | (1243.11,1252.02) (0.16,0.21) | (1168.88,1176.92) (0.30,0.37) | 8.19.4 | 2.46.1 |
| 9 | 160413042241034 | 18.167 | L6.01.0 | 0.31 | (1243.10,1252.17) (0.21,0.26) | (1168.89,1177.06) (0.14,0.40) | 4.124.1 | 9.07.8 |
| 10 | 161407562211522 | 18.251 | L4.50.5 | 0.38 | (1243.05,1252.05) (0.14,0.20) | (1168.95,1177.00) (0.21,0.37) | 4.515.1 | 1.45.8 |
| 11 | 160539092403328 | 18.320 | L4.50.5 | 0.43 | (1243.14,1252.08) (0.13,0.28) | (1169.03,1177.23) (0.27,0.41) | 6.624.5 | 3.87.9 |
| 12 | 160200002057341 | 18.500 | ???? | 0.50 | (1242.97,1252.24) (0.32,0.37) | (1169.02,1176.88) (0.26,0.48) | 10.963.1 | 1.57.5 |
| 13 | 160420422134530 | 18.413 | L6.01.0 | 0.26 | (1243.06,1252.12) (0.19,0.21) | (1168.88,1177.19) (0.22,0.34) | 1.99.6 | 5.56.9 |
| 14 | 160136922212027 | 19.270 | L7.01.0 | 0.15 | (1243.12,1252.13) (0.13,0.20) | (1168.89,1177.00) (0.33,0.35) | 2.37.2 | 13.410.4 |
| 15 | 161512702229492 | 19.339 | L7.01.0 | — | (1243.07,1252.10) (0.15,0.30) | (1168.75,1177.13) (0.40,0.40) | 5.97.5 | 18.313.1 |
| ID | Name | SpTNIR | SpTOPT | phot | SpT | VO | -peak | EW | RV |
|---|---|---|---|---|---|---|---|---|---|
| VISTA J | |||||||||
| 1 | 15592214 | L1.00.5 | M8.50.5 | Y | Y | Y | Y | Y | Y |
| 2 | 16132124 | L2.00.5 | M9.00.5 | Y | Y | Y | Y | Y | Y |
| 3 | 16142331 | L1.50.5 | M9.50.5 | Y | Y | Y | Y | Y | Y |
| 4 | 16052130 | dL2.00.5 | L1–L2 | ? | Y | ? | N | ? | ? |
| 5 | 16112215 | L5.01.0 | L2–L3 | Y | Y | Y | Y | Y | Y |
| 6 | 16092222 | dL4.50.5 | L3 | Y | N | N | N | N | Y |
| 7 | 16092229 | L3.00.5 | L2–L3 | Y | Y | Y | Y | Y | Y |
| 8 | 16072146 | L4.50.5 | L2–L3 | Y | Y | Y | Y | Y | Y |
| 9 | 16042241 | L6.01.0 | L1–L2 | Y | Y | Y | Y | Y | Y |
| 10 | 16142211 | L4.50.5 | L1–L2 | Y | Y | Y | Y | Y | Y |
| 11 | 16052403 | L4.50.5 | L2.00.5 | Y | Y | Y | Y | Y | Y |
| 12 | 16022057 | ???? | ???? | ? | ? | N | N | ? | Y |
| 13 | 16042134 | L6.01.0 | L1–L2 | Y | Y | Y | Y | Y | Y |
| 14 | 16012212 | L7.01.0 | L4.01.0 | Y | Y | N | Y | Y | Y |
| 15 | 16152229 | L7.01.0 | L4.01.0 | Y | Y | N | Y | Y | Y |
Overall, this absolute spectral classification agrees well with the relative classification described in the previous section. The spectral sequence progresses from L1–L2 for the brightest VISTA candidates, to mid-L for the group of sources around 18 mag, to late-L for the two faintest objects with 19.3 mag. We define the first sequence for young L dwarf members of the UpSco association with an age of 5–10 Myr that should serve as “benchmark” for comparison with other young systems discussed in the literature or to be discovered in the near future.
5.2.4 Optical spectral classification
We proceed in a similar manner as for the near-infrared classification to assign optical spectral types to the targets with GTC/OSIRIS low-resolution spectra (Sect. 3.2). In Fig. 8 we plot the optical spectra of all sources classified as L dwarfs in the near-infrared and observed in June 2016 (left panel) and May 2017 (right panel).
From Figs. 8 and 9, we see H in emission in four L-type objects: VISTA J16152229, VISTA J16072146, VISTA J16022057, and VISTA J16112215 (Table 5). The line strength is moderate in VISTA J16152229, and this object does not show evidence of mid-infrared flux excesses up to 4.5 m. Therefore, the origin of the H emission could be chromospheric. Chromospheric emission is expected in young M and L dwarfs (Luhman, 2012, see review by). VISTA J16072146 also has a moderate H emission and significant mid-infrared flux excess at 4.5 m (see object #8 in Figs. 12 and 13), which implies the presence of a warm disk and possible accretion. VISTA J16022057 and VISTA J16112215 show, however, considerably strong H emission although it is not resolved at the resolution of our data. Both objects could be accreting material and their optical spectra may be affected by some veiling (Fig. 9), thus contributing to unreliable determinations of spectral types at optical wavelengths. This scenario is reinforced by the presence of possible mid-infrared flux excesses in VISTA J16112215 (object #5 in Fig. 14), which suggests the existence of a disk from which the central source is still accreting even at the age of UpSco (5–10 Myr). As discussed in the review by Luhman (2012), it seems that disks manage to survive at ages of 10 Myr around very low mass sources, see also Luhman & Mamajek (2012). VISTA J16072146 and VISTA J16112215, whose masses are likely below 15 MJup, prove that both disks and accretion phenomena can persist up to 10 Myr, unless these sources are much younger than the cluster (which is possible only for VISTA J16112215 given the fact that it is brighter than all other related objects at all magnitudes). VISTA J16072146 and VISTA J16112215 should be added to the limited number of planetary-mass objects hoarbouring disks, e.g. SOri 60 (Zapatero Osorio et al., 2007; Luhman et al., 2008) or 2MASS J044144892301513 (Adame et al., 2011).
In Fig. 8 we overplotted in green Sloan optical spectra of old field L dwarfs that best match the spectra of targets to assign tentative spectral types. We classify our targets into several groups, best fit by L1–L2, L2–L3, and L4 in the optical by direct comparison with Sloan spectra. We classify the two faintest targets in our sample as L4opt1 (compared L7ir). Consequently, we find a trend towards earlier spectral types in the optical than in the near-infrared marked by the presence of TiO and VO at optical wavelengths for sources classified as early-L dwarfs in the near-infrared. We find an optical sequence going from late-M dwarfs to early-L, and mid-L dwarfs that matches the photometric sequence and near-infrared spectral sequence in UpSco where brightest sources exhibit earlier spectral types. We overplotted in red two known young members of Taurus: KPNO6 (M8.5) and KPNO 4 (M9.5) (Briceño et al., 1998; Luhman et al., 2003) which reproduce well the optical spectra of the late-M UpSco members, thus, reinforcing our classification scheme and the young nature of these UpSco candidates.
Puzzled by this systematic trend, we increased the sample of optical spectra of UpSco members classified as M9–L1 in the near-infrared (Lodieu et al., 2008, Gemini/GNIRS spectra in Table 1 and Fig. 1 of). We plot these optical spectra in Fig. 10, where the earliest is at the bottom and quote both optical and near-infrared spectral types next to their names. We compare them to the two young sources discussed above and UScoCTIO 108B to assign optical spectral types between M8.5 and M9.5. We observe a small spectral type interval at optical than infrared wavelengths (M8.5–M9.5 vs M9–L1), which most likely reflects the fact that oxides remain stronger at low gravities due to the low pressures although VO and TiO have been severely depleted in field early-L dwarfs. We clearly detect Hα in emission in three of these UpSco members (Table 5).
5.2.5 Adopted spectral classification
We have decided to assign both optical and near-infrared spectral types to our targets. Nonetheless, we have adopted the near-infrared spectral types based on three arguments:
- •
A significant fraction of the flux of late-M and L dwarfs is emitted at near-infrared wavelengths. The optical flux up to 1.0 m barely represents 10 % of the total flux. Both optical and near-infrared wavelengths have spectral features that depend on temperature, gravity, and metallicity. Figure 4 shows the comparison of the combined optical and near-infrared spectral energy distributions (SEDs) of UpSco dwarfs against SEDs of spectral types based on the optical and near-infrared classifications. The overall SED of UpSco dwarfs is better matched by the SEDs corresponding to the near-infrared classification.
- •
The TiO and VO bands, which are the basis of optical spectral scheme, depend strongly on gravity, as we can see from the presence of VO at 1.06 microns (Fig. 17). Nonetheless, the optical-to-infrared slope of the spectra is best reproduced by the slope of the near-infrared spectral types.
- •
The UpSco spectral sequence spans 2.4 mag in (17.0–19.3 mag), which would correspond to field L dwarfs with spectral types in the L0–L6 range, in agreement with our near-infrared spectral range but larger than our optical spectral range.
We do not share the opinion of constructing a spectral classification for young L dwarfs based on optical spectral types ignoring the differences between visible and infrared spectra as described in Luhman et al. (2016). This is a valid proposal for field L dwarfs but we argue that the low gravity affecting the sodium and potassium doublets in the infrared should have an even stronger effect on the optical spectral energy distribution of young L dwarfs than on the infrared since the optical region is mainly shaped by alkalis. The redness of some L dwarf members of young moving groups with intermediate ages might originate from the presence of dust and/or clouds in their atmospheres or debris disk (Zakhozhay et al., 2017).
5.2.6 Photometric vs spectroscopic sequence
We have shown that our targets define a photometric sequence in colour-magnitude and colour-colour diagrams and span a 2.5 magnitude range, from 17.0 mag down to = 19.3 mag. They also define a spectroscopic sequence, from L1 to L7 in the near-infrared and from M8.5 to L4 in the optical. We naturally expect such an agreement if our candidates are members of the same region although additional parameters can enter into the game such as binarity and presence of disks at the age of UpSco (5–10 Myr).
In Table 8 we summarise the various criteria used in this work to assign membership to the 15 UpSco candidates with near-infrared spectral types. In Fig. 14 we plot observed magnitudes (, , , ) as a function of near-infrared spectral types to put together the photometric and spectroscopic sequences. We see that the two objects (VISTA J16092222, #6; VISTA J16022057, #12) classified as non-members do not stand out in these diagrams. However, VISTA J16052130 (#4) lies well below the sequences in all diagrams and its near-infrared spectrum did not show clear presence of VO absorption and presence of a peaked -band (Section 5.2.3) suggesting that it is a contaminant. Object number 5 (VISTA J16112215) tends to lie above the sequence due to its late type compared to the photometric sequence but we cannot discard it as earlier type member with an infrared excess (L2exc vs normal L5) at this stage because all other features typical of young objects are present.
5.3 Spectral indices
We have compiled a large number of spectral indices defined in the literature to classify M, L, and
T dwarfs in the field and at young ages by independent teams
(Tokunaga &
Kobayashi, 1999; Reid et al., 2001; Testi et al., 2001; Burgasser et al., 2002; Geballe
et al., 2002; McLean et al., 2003; Slesnick et al., 2004; Burgasser et al., 2006; Allers
et al., 2007; Allers &
Liu, 2013).
We refer the reader to these papers for the definitions of the indices.
We computed these spectral indices for a variety of L dwarfs, including the SDSS sequence spanning
optical spectral types between L0 and L8 (Schmidt et al., 2010), L dwarfs downloaded from Sandy Leggett’s
webpage55
5
http://staff.gemini.edu/ sleggett/LTdata.html, those in Reid et al. (2001),
and young L0–L5 dwarfs classified as and following Cruz
et al. (2009), Bonnefoy
et al. (2014),
Allers &
Liu (2013), and
Gagné et al. (2015)66
6
https://docs.google.com/spreadsheets/d/
1136rRdcjHZJoe00mt4kPeWU8ZNORcPe-w4cipkDKGRc/
plus the recent additions of PSO J318.533822.8603 (Liu et al., 2013, L7pec;) and
VHS J125601.92125723.9 (Gauza
et al., 2015, L7pec;).
We report the values of the spectral indices for all sources in Table 11
and plot them as a function of spectral type in
Figs 25–28
in Appendix A.
In those figures, we plot the infrared spectral types of our UpSco sources and the spectral types
published in the literature for the comparison samples of old field, beta, and gamma L dwarfs.
We note that the spectral types come from various sources in the literature, which does not
necesarily represent a one-to-one correlation with effective temperature.
We distinguish field L dwarfs from their younger counterparts by the colours of the symbols: green for
old fied dwarfs, blue triangles for L dwarfs, red pentagons for L dwarfs, and black dots
for our UpSco sample.
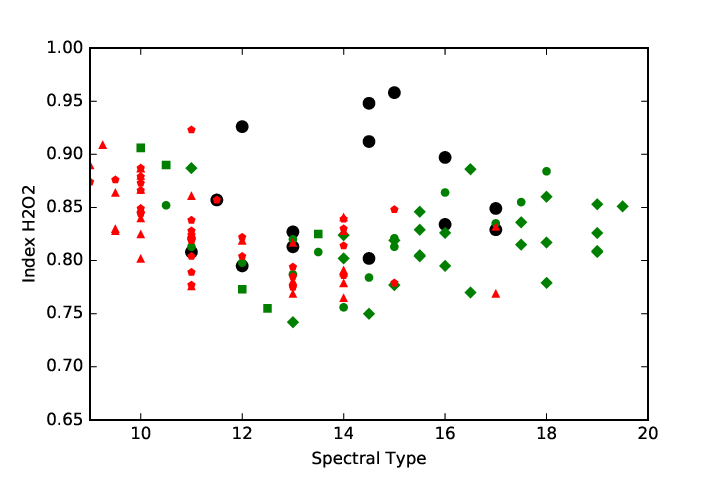
We plot all the spectral indices along with the 2nd-order polynomial fits in the figures in
Appendix A. We plot a sub-sample of three indices discussed
below in Fig. 16.
We carried out a Kolmogorov-Smirnov statistical test to identify the spectral indices most sensitive to gravity. We compared the distributions of our UpSco objects with old field L dwarfs for each index individually. After ordering them, we identified the following indices as most sensitive to age (in this order): H-cont, CH4-H, FeHH, VOz, and H20-K. We repeated this procedure comparing the L dwarfs and the old field L dwarfs (both samples from the literature) and identified four of the indices aforementionned among the five best ones (H-cont, CH4-H, VOz, and H20-K). We inspected visually these indices and observed indeed strong dependency on gravity for those indices. We conclude that the H-cont, VOz, CH4-H, H2O-K, and FeH-H can be primarily used to the youth of members of moving groups (Gagné et al., 2014; Malo et al., 2014; Gagné et al., 2015; Faherty et al., 2016, e.g.). On the contrary, we identified some spectral indices that appear to be nearly independent of the gravity (age) of L dwarfs despite the scatter observed in the measurements. The K1 index, which measures the rise of the spectra between 2.0 and 2.14 m (Tokunaga & Kobayashi, 1999), is convenient for spectral classification independently of gravity.
We observe that most of the water vapour indices defined in the literature are fairly insensitive to gravity, with a few exceptions like H2O-K and tend to either increase or decrease with later spectral types, demonstrating that the community has used water bands as the main features for L dwarf classification. Moreover, we observe significant differences between our sample and objects in the literature which we attribute to the lower signal-to-noise ratios in the NIR spectra of our UpSco targets (especially close to the main telluric bands) compared to other studies using high quality spectra to derive those indices. Summarizing, the H-cont, VOz, CH4-H, and FeH-H spectral indices can be used to discriminate surface gravity for late-M and L spectral types, while water-based indices are proxies for spectral typing, with the only exception of H2O-K.


From top to bottom: VISTA J16072146 (L2–L3opt, L4.5ir); VISTA J16142211 (L1–L2opt, L4.5ir); VISTA J16052403 (L2opt, L4.5ir); VISTA J16042241 (L1–L2opt, L6ir); and VISTA J16042134 (L1–L2opt, L6ir)

From top to bottom, the two latest member candidates: VISTA J6012212 (L4opt, L7ir) and VISTA J6152229 (L4opt, L7ir).
5.4 Gravity sensitive features
Brown dwarf members of open clusters, star-forming regions, and young moving groups are known to exhibit features characteristics of youth, including pseudo-equivalent widths of potassium and sodium doublets weaker than for older field dwarfs as well as the presence of a peaked -band (Martín et al., 1996; Luhman et al., 1998; Béjar et al., 1999; Lucas & Roche, 2000; Zapatero Osorio et al., 2000; Cushing et al., 2000; Gorlova et al., 2003; McGovern et al., 2004; Slesnick et al., 2004; Lodieu et al., 2008; Slesnick et al., 2008; Scholz et al., 2012; Alves de Oliveira et al., 2012; Alves de Oliveira et al., 2013; Bonnefoy et al., 2014; Manjavacas et al., 2014; Mužić et al., 2014; Mužić et al., 2015). In Fig. 15, we plot the pseudo-equivalent widths of the potassium (KI) doublets at 1.169/1.177 m and 1.243/1.252 m as a function of spectral type. We can clearly see that most of our measurements lie below the sequence of field M and L dwarfs (blue symbols) and are consistent with very low gravity dwarfs (green symbols) defined by Allers & Liu (2013). These objects would correspond to L dwarfs in the scale of Cruz et al. (2009). Our sample of UpSco members is comparable in size to the sample of very low gravity sources in Allers & Liu (2013) with the main difference that ours belong to the same region. Only two objects have stronger gravity-sensitive features: VISTA J16092222 (#6; dL4.5) shows stronger potassium features consistent with young L dwarfs or field dwarfs. USco 16052130 (#4) exhibits stronger absorptions at 1.169/1.177 m but not at 1.243/1.252 m, suggesting that the doublet with the bluest wavelength might be more gravity-dependent than the other which more often used in the literature.
We find that all X-shooter spectra exhibit weaker potassium (1.169/1.177 m, 1.243/1.252 m) doublets, except two objects (VISTA J16052130, #4; VISTA J16092222, #6). We also find that all but three (VISTA J16052130, #4; VISTA J16092222, #6; VISTA J16022057, #12) show a peaked -band, adding strong credit to the membership of 12 of our VISTA candidates to the UpSco association (Fig. 3; Table 7). We also observe a weak sodium doublet at around 0.82 m in the GTC OSIRIS optical spectra of the two brightest sources, conclusion further confirmed by the direct comparison with spectral template of similar spectral types from the Taurus and Chamaeleon star-forming regions kindly provided by Kevin Luhman (Fig. 8). Despite the low resolution and poor signal-to-noise of the optical spectra of the other targets, the sodium doublets of the L2–L3opt dwarfs appear weaker than those of the SDSS template spectra whereas we cannot draw any definite conclusion for the two faintest sources. We find the same features in the X-shooter spectra of known UpSco members (Luhman & Mamajek, 2012) (Fig. 7) and M9–L1 dwarfs from Lodieu et al. (2008) observed with GTC/OSIRIS (Fig. 10). These findings are corroborated by the spectral indices displayed in the bottom panels of Fig. 16.
The other striking feature present in the near-infrared spectrum of young dwarfs is the VO absorption at 1.05–1.08 m (Cushing et al., 2005). Allers & Liu (2013) defined a specific index centered on that absorption to assign gravity classes of L0–L4 dwarfs (see Appendix A for the comparison with our sources). Indeed, at these spectral types, the lower the gravity, the stronger is the depression around 1.06 m due to condensation effects and hydride opacities. This feature is visible in the spectrum of USco J1551502213457 (Peña Ramírez et al., 2016, L61;). Two of the 15 spectra (VISTA J16092222 (#6); VISTA J16022057 (#12)) lack this feature (Fig. 3) while a tiny absorption is seen in the spectrum of USco 16052130 (#4), which together with other criteria, cast doubt on their youth, hence, membership to the UpSco association. The two faintest sources with the latest spectral types show a weaker absorption at 1.06 microns but the comparison with field L7 dwarfs shown in Fig. 17 demonstrate that VO is still present in 5–10 Myr-old late-L dwarfs.
In Fig. 17 we show the full spectral energy distribution combining GTC/OSIRIS optical and VLT/X-shooter infrared spectra of our L dwarf members of UpSco. This figure shows the impact of gravity on the full 600–2500 nm region for L dwarfs, in particular the remnants of alkali lines and oxyde bands. For this reason we have decided to assign both optical and near-infrared spectral types to our targets.
5.5 Radial velocities
We computed the radial velocities of our 15 VISTA candidates in two ways. On the one hand, we used cross-correlation function using the spectrum of highest signal-to-noise as reference, and, on the other hand, the positions of the individual lines of the gravity-sensitive doublets.
We used the fxcor task under IRAF to measure the offsets between each candidate and the reference chosen as VISTA J15592214, the brightest candidate ( = 16.97 mag) with the highest signal-to-noise X-shooter spectrum. We cleaned the spectra for the strongest telluric bands and smoothed them by a factor of seven. We included the keywords necessary to correct the relative Doppler shifts for the Earth barycentric motion. We considered four regions free of telluric bands for the correlation, located between 1.02–1.10 m, 1.17–1.33 m, 1.49–1.77 m, and 2.05–2.36 m. The relative radial velocities and their associated error bars (between 1.3 and 13.1 km/s typically increasing with lower signal-to-noise spectra) are quoted in Table 7. The final radial velocities (Fig. 20) are obtained by subtracting the value of 9.054.83 km/s obtained for VISTA J15592214 from the spectral lines (see next paragraph). The true uncertainty on these measurements is set by the slit of 1.2 arcsec used in the NIR arm of X-shooter, giving a resolution of 4000 (i.e. a spectral point every 0.06 nm) corresponding to an uncertainty in radial velocity of 15 km/s.
We also measured the observed positions of the potassium (KI) doublets at 1.169/1.177 m and 1.243/1.252 m. We compared these values to the nominal values taken from the NIST atomic spectra database77 7 http://physics.nist.gov/PhysRefData/ASD/lines_form.html. We multiplied the difference by the speed of light to derive a Doppler shift in km/s after correcting for the barycentric velocities. We calculated the error bars for each object based on the dispersion in the four different measurements (or three only when one was clearly discrepant). The final error bars represent the quadratic sum of the individual measurements and the uncertainty on the reference object (4.83 km/s). These uncertainties are much larger than the ones from the cross-correlation technique but more in line with the spectral resolution of the X-shooter spectra and the faintness of our objects. We list the final radial velocities in Table 7.
We find that both methods give compatible values within 1 of the error bars. We plot the Doppler shifts from the cross-correlation technique corrected for the radial velocity of our reference (VISTA J15592214; 9.054.83 km/s) in Fig. 20. We compare the distribution of our candidates with the distribution of radial velocities of higher mass member (values in Table 12 of Pecaut et al., 2012, and references therein (Duflot et al., 1995; Barbier-Brossat & Figon, 2000; Gontcharov, 2006; Chen et al., 2011; Dahm et al., 2012)) whose values range from 10 to 0 km/s. The two faintest members exhibit large radial velocities but with larger uncertainties also consistent with the mean velocities of UpSco members. The only source that lies 2 away from the higher mass members with the largest Doppler shifts is VISTA J16052130 (dL2) so we set its radial velocity membership to “?”. It is worth noting that this source was also a doubtful member because it displays blue infrared colour, its near-infrared spectrum did not show obvious youth features, and its discrepant radial velocity. All the other candidates with X-shooter spectra can not be discarded as members based on the low accuracy of our radial velocity measurements (Table 8). Overall, we have identified two clear non members based on their -band photometry, two non member from their near-infrared spectroscopy and/or radial velocity, and one doubtful currently unclassified. We infer a minimum contamination level of 4/28–5/28 = 14–18% among photometric candidates and 2/15–3/15 = 13.3–20% among candidates with spectroscopic follow-up.


5.6 Effective temperatures and gravities
We have used the spectral energy distribution (SED) analyser tool implemented in the Spanish virtual observatory (Bayo et al., 2008, VOSA;) to infer the effective temperatures (Teff), surface gravities, and metallicities of our UpSco candidates by comparison with a set of theoretical models. We investigated the validity of the VOSA fitting tool on known field late-M, L, and T dwarfs before applying it to our sample. We input in VOSA the samples of ultracool dwarfs with effective temperature derived by Dahn et al. (2002) and Vrba et al. (2004). We used the VOSA photometry tool to extract optical and infrared photometry from various large-scale surveys, including Sloan, 2MASS, UKIDSS, VISTA, and WISE to construct their spectral energy distributions. We kept in the final sample only sources with at least five photometric points in the near- and mid-infrared. We fit their distribution with three different types of models incorporated in VOSA: BT-Settl (Allard et al., 2012a), BT-DUSTY (Allard et al., 2012b), and BT-CIFIST (Baraffe et al., 2015) for the L dwarfs and only BT-Settl for the T dwarfs because of the validity range of the other two models. We plot the Teff from VOSA with black dots in Fig. 23 and compare them with those of Dahn et al. (2002) and Vrba et al. (2004) shown in green and red, respectively. We observe that the models reproduce well the overall trend in temperature for the full high-gravity late-M, L, and T dwarf sequence (Dahn et al., 2002; Vrba et al., 2004), but with a very large dispersion of about 500 K. We find that model fits tend to under-estimate the Teff for L dwarfs by a few hundreds of Kelvins but this trend is only valid for old field dwarfs (the effect is unknown at young ages).
For our purposes, we compared the photometric SEDs including the GTC OSIRIS -band photometry, the VISTA magnitude (L13), the UKIDSS photometry (Hewett et al., 2006, 0.88–2.5 m;), and the WISE passbands (3.4 and 4.6 m) to three sets of models with a limited range of parameters: BT-Settl (Allard et al., 2012a), BT-DUSTY (Allard et al., 2012b), and BT-CIFIST (Baraffe et al., 2015) for Teff = 1200–3500 K, surface gravities between 2.5 and 5.5 dex, and metallicities ranging from 0.5 to 0.5 dex. In other words, we assumed solar metallicity for members of UpSco, which is expected for such a young nearby OB association. We also assumed a mean distance of 145 pc for UpSco (de Bruijne et al., 1997).
We list the physical parameters derived from the photometric fits in Table 9 and show the SEDs in Figs. 21–22. We note that the best fit is obtained for different models depending on the targets. All our targets have solar metallicity with a typical error of 0.2 dex. All objects exhibit gravity in the (g) = 3.5–5.0 range with uncertainties of 0.5 dex (the steps of the models). We expect (g) = 4.0 dex for brown dwarfs still contracting at the age of UpSco, while (g) = 2.5 derived for VISTA J16142211 whose gravity is too low according to model predictions. The effective temperatures lie between 1500 K and 1900 K with uncertainties less than 60 K. One source, VISTA J16042241, is best fit with a (g) of 5.5 dex, which is quite high for young brown dwarfs, highlighting current uncertainties in fitting schemes and atmospheric models. Keeping in mind current flaws in theoretical models reproducing spectra of brown dwarfs, the large dispersion of temperatures observed for L dwarfs, and the fact that young L dwarfs might be 100–300 K cooler than their old counterparts (Filippazzo et al., 2015), our Teff represent first-guess estimates. More accurate temperatures could be inferred if we knew the range of radii for UpSco L-type brown dwarfs but such a measurement is currently available only for one (isolated) eclipsing brown dwarf binary in Orion (Stassun et al., 2006; Stassun et al., 2007, 0.48–0.68 R⊙;).
We have also taken advantage of the template fitting procedure in VOSA, which uses a sequence of spectral libraries: the NIRSPEC Brown Dwarf spectroscopic survey (McLean et al., 2003; McLean et al., 2007), L and T dwarf data archive (Knapp et al., 2004; Golimowski et al., 2004; Chiu et al., 2006), the SpeX prism library88 8 http://pono.ucsd.edu/adam/browndwarfs/spexprism/index_old.html, the Keck LRIS spectra of late-M, L and T dwarfs (Kirkpatrick et al., 1991; Kirkpatrick et al., 1999), and the database of Collinder 69 (Bayo et al., 2011). We observe that the best fits were returned from the first three archives, which use mainly near-infrared spectra instead of the full optical/near-infrared/mid-infrared range. We see that a few targets are well fit by known templates although the majority tend to return earlier spectral types consistent within 2–3 sub-classes with those assigned in this paper (Sect. 5.2.3; Table 8), except for VISTA J16132124 classified as a T0 dwarf from direct comparison with a 1.0–2.5 micron spectrum. On the light of the discrepancies observed between photometric and spectroscopic spectral types, we caution the use of the template fitting procedure to assign temperatures especially at young ages. We list the assigned spectral types from template fitting in the last column of Table 9.
5.7 Bolometric corrections
We computed bolometric corrections (BCs) for our UpSco candidates, assuming that the observed spectroscopic and photometric fluxes come from a single source (i.e. the target). First, we computed the BCs including the optical and near-infrared spectra from the GTC and VLT, respectively. We integrated the spectra from 563 nm to 2480 nm and added the flux from the WISE passbands (up to 5.34 m). We did not include the objects lacking WISE photometry (Table 6). We integrated the solar metallicity BT-Settl models for a (g) or 4.5 dex, and temperatures of 2000,K, 1800 K, and 1600 K for L1–L2, L41, and L6–L7 dwarfs, respectively. We integrated the BT-Settl models for wavelenths shortwards of 563 nm and longer than 5.56 m (upper limit of the WISE filter) The contribution from the 2000 K and 1600 K models represents only 2.6% and 5.4%, respectively. We assumed an absolute solar bolometric magnitude of 4.74 for the Sun, following the IAU recommendation. We report their bolometric magnitudes and corrections in the top panel of Table 10 and plot their - and -band BCs as red dots in Fig. 24 compared to the BCs of field L dwarfs (black dots) taken from Dahn et al. (2002) and Golimowski et al. (2004). In Fig. 24, we added the polynomial fits and their associated dispersions reported for young and old field L dwarfs in blue and grey, respectively (Filippazzo et al., 2015).
In a second step, we calculate the BCs for our candidates integrating their near-infrared spectra only and adding the WISE photometry to gauge the contribution of the optical spectrum. The flux concentrated in the aforementioned models shortwards of 1000 nm and longwards of the WISE passband represent 10% at most in all cases. We obtained similar BCs within 0.04 mag for all sources with both opticalinfrared and infrared-only contributions, suggesting that the contribution from the optical regions is very small in our targets. We list the BCs for the candidates with WISE photometry and infrared spectra in the bottom panel of Table 10 and plot their BCs as green dots in Fig. 24. We note that our -band BC for our L1 member of UpSco is comparable to the value obtained by Todorov et al. (2010) for M9.5–L0 members of Taurus (BCK 3.40 mag).
In the top panel of Fig. 24 depicting the BCJ as a function of spectral types we observe a decreasing trend of the BC with later spectral type for young UpSco members and for field L dwarfs. Our BCJ lie within the dispersion of field L dwarfs derived by Filippazzo et al. (2015). In the case of BCK (bottom panel in Fig. 24), we see a slight increase towards later spectral types, a different trend to the one observed for the samples of field and young L dwarfs presented in Filippazzo et al. (2015). This has a clear impact on the luminosity and, more importantly, on the mass of young L dwarfs because higher values of BCK indicate that objects become less luminous, therefore, less massive. Fig. 24 provides an additional illustration of what is seen in Fig. 17, where the spectra of UpSco objects appear systematically redder in the -band than the corresponding high-gravity sources of related near-infrared spectral type.
| ID | Name | SpTNIR | Model | Teff | (g) | [M/H] | Template |
|---|---|---|---|---|---|---|---|
| VISTA J | K | cgs | |||||
| 1 | 1559-2214 | L1.0 | bt-settl | 1800 | 5.0 | 0.0 | L0 (1) |
| 2 | 1613-2124 | L1.5 | bt-dusty | 1800 | 4.5 | 0.0 | T0 (2) |
| 3 | 1614-2331 | L2.0 | bt-dusty | 1900 | 4.5 | 0.0 | L0 (1) |
| 4 | 1605-2130 | dL2.0 | bt-settl | 1800 | 5.0 | 0.0 | L3 (3) |
| 5 | 1611-2215 | L5.0 | bt-settl-cifist | 1700 | 4.0 | 0.0 | L6 (2) |
| 6 | 1609-2222 | dL4.5 | bt-dusty | 1600 | 5.0 | 0.0 | L2 (1) |
| 7 | 1609-2229 | L3.0 | bt-settl-cifist | 1800 | 5.0 | 0.0 | L2 (1) |
| 8 | 1607-2146 | L4.5 | bt-settl-cifist | 1800 | 5.0 | 0.0 | L2 (1) |
| 9 | 1604-2241 | L6.0 | bt-dusty | 1600 | 5.5 | 0.0 | L4 (2) |
| 10 | 1614-2211 | L4.5 | bt-settl-cifist | 1500 | 2.5 | 0.0 | L4.5 (2) |
| 11 | 1605-2403 | L4.5 | bt-settl | 1600 | 3.5 | 0.0 | L2 (1) |
| 12 | 1602-2057 | ???? | bt-dusty | 1600 | 4.5 | 0.0 | L3 (2) |
| 13 | 1604-2134 | L6.0 | bt-settl-cifist | 1750 | 5.0 | 0.0 | L5 (2) |
| 14 | 1601-2212 | L7.0 | bt-settl-cifist | 1700 | 4.0 | 0.0 | L6 (2) |
| 15 | 1615-2229 | L7.0 | bt-settl-cifist | 1700 | 4.0 | 0.0 | L6 (2) |
| ID | Name | SpTNIR | mbol | BCJ | BCK | BCw1 | BCw2 | ||
| mag | mag | mag | mag | mag | mag | mag | |||
| 1 | 15592214 | L1.0 | 19.34 | 2.01 | 3.37 | 4.13 | 4.56 | 0.09 | 0.16 |
| 2 | 16132124 | L1.5 | 19.57 | 2.04 | 3.46 | 4.08 | 4.58 | 0.14 | 0.22 |
| 7 | 16092229 | L3.0 | 19.92 | 1.80 | 3.62 | 4.40 | 4.57 | 0.12 | 0.32 |
| 8 | 16072146 | L4.5 | 19.75 | 1.63 | 3.39 | 4.65 | 5.20 | 0.01 | 0.07 |
| 10 | 16142211 | L4.5 | 20.18 | 1.72 | 3.51 | 4.61 | 4.89 | 0.08 | 0.19 |
| 5 | 16112215 | L5.0 | 19.75 | 1.50 | 3.69 | 4.55 | 4.98 | 0.09 | 0.37 |
| 9 | 16042241 | L6.0 | 20.18 | 1.64 | 3.49 | 4.71 | 4.92 | 0.14 | 0.19 |
| 13 | 16042134 | L6.0 | 20.30 | 1.60 | 3.56 | 4.61 | 4.98 | 0.10 | 0.26 |
| 14 | 16012212 | L7.0 | 20.97 | 1.40 | 3.68 | 4.67 | 5.45 | 0.04 | 0.42 |
| 15 | 16152229 | L7.0 | 20.94 | 1.42 | 3.67 | 4.41 | 5.21 | 0.01 | 0.40 |
| 1 | 15592214 | L1.0 | 19.41 | 2.02 | 3.38 | 4.20 | 4.63 | 0.09 | 0.16 |
| 2 | 16132124 | L1.5 | 19.60 | 2.06 | 3.49 | 4.10 | 4.61 | 0.16 | 0.25 |
| 7 | 16092229 | L3.0 | 19.92 | 1.79 | 3.59 | 4.38 | 4.55 | 0.00 | 0.30 |
| 8 | 16072146 | L4.5 | 19.75 | 1.60 | 3.35 | 4.61 | 5.16 | 0.04 | 0.03 |
| 10 | 16142211 | L4.5 | 20.17 | 1.73 | 3.50 | 4.60 | 4.88 | 0.09 | 0.18 |
| 5 | 16112215 | L5.0 | 19.75 | 1.51 | 3.68 | 4.54 | 4.97 | 0.09 | 0.36 |
| 9 | 16042241 | L6.0 | 20.18 | 1.66 | 3.50 | 4.72 | 4.93 | 0.16 | 0.20 |
| 13 | 16042134 | L6.0 | 20.30 | 1.61 | 3.56 | 4.61 | 4.97 | 0.11 | 0.26 |
| 14 | 16012212 | L7.0 | 20.95 | 1.37 | 3.66 | 4.65 | 5.43 | 0.06 | 0.39 |
| 15 | 16152229 | L7.0 | 20.90 | 1.39 | 3.64 | 4.37 | 5.17 | 0.04 | 0.37 |


5.8 Wide companions
We looked for wide companions cross-matching our list of 15 VISTA candidates with known UpSco members (Luhman & Mamajek, 2012) within a matching radius of 30 arcsec (corresponding to an upper projected physical separation of 4350 au at the distance of USco) but none was found. The catalogue of UpSco members from Luhman & Mamajek (2012) included the most massive members (e.g. Sco; = 3.4 mag) all the way down to coolest members known at that time with spectral types around M9/L0 ( 16.6–17.2 mag). We repeated the same process with the list of 16 L0–L2 dwarfs in Table 1 of Lodieu et al. (2008) without success. In total, we searched for wide companions around 29 L dwarfs (2 in common between the aforementioned samples), suggesting a frequency of wide companions to early-L dwarfs below 3.4% at separations larger than 1.5 arcsec and spectral types between B0 and M9/L0, corresponding to 220 au at the distance of UpSco. Our conclusions also supplement the low frequency of close companions (7%) from an adaptive optic survey of 14 L0–L1 from Lodieu et al. (2008) by Biller et al. (2011). We conclude that wide pairs with components separated by more than 200 au are rare. Only a few systems have indeed been discovered in USco: USco CTIO 108B (Ardila et al., 2000; Béjar et al., 2008, 670 au;), 1RXS J160929.1210524 (Lafrenière et al., 2008; Lafrenière et al., 2010, 330 au;), and HIP 78530B (Lafrenière et al., 2011, 700 au;). Our upper limit is consistent with the frequency of 4% of wide (250–1000 au) brown dwarf (0.005–0.040 M⊙) companions around higher mass members of UpSco (Lafrenière et al., 2014, 0.2–10 M⊙;) and the 0.60.3% occurrence of wide (400–4000 au) down to 0.005 M⊙ around M7.5–M9 members (Aller et al., 2013).
The closest potential system we found cross-matching the above catalogues is located at 69.3 arcsec or 10,000 au. It would be composed of the X-ray emitter M1 dwarf 2MASS J160637412108404 (called “primary” here) and VISTA J160606292335133 classified as a L0 in the infrared (Lodieu et al., 2008) and M9 in the optical (this work). The proper motion in right ascension and declination extracted from the UKIDSS GCS catalogue for the primary and secondary are 10.254.11, 15.244.11) and (6.602.46, 19.212.46) mas/yr, respectively. The primary has a mass of 0.6 M⊙ and has a previously known companion located at 1.2790.003 arcsec (position angle of 33.90.3 degrees) equivalent to 185 au at the distance of UpSco (Köhler et al., 2000). The brightness ratio is 0.9170.001 in the -band. The catalogue of Luhman & Mamajek (2012) contains 863 B–M members over a (conservative) area of 72 square degrees, implying 0.0033 sources per square arcmin. The probability of finding one member of UpSco in 4.3 square arcmin is of the order of 41.5%. At this stage we can not draw any firm conclusion: the probability indicates that companionship might be either true or not. If true, this system composed of a low-mass star and planetary-mass companion would be of great interest and support early theoretical suggestions that primary stars of multiple systems with wide brown dwarf companions tend to be binary themselves (Delgado-Donate et al., 2003, e.g.).
Conclusions and future work
We presented a dedicated photometric and spectroscopic follow-up of photometric and astrometric candidates identified in a deep and wide near-infrared survey of 13.5 square degrees in the central region of UpSco. Throughout this work, we argue in favour of a high success rate of our photometric and astrometric selection, higher than 80%. Indeed, two sources are rejected with additional optical photometry among 28 candidates with -band photometric follow-up. Moreover, two candidates are classified as field dwarfs and another one remains doubtful, suggesting at most three contaminants in our near-infrared spectroscopic sample of 15 candidates. As a consequence, the conclusion drawn earlier in L13 remains valid: the UpSco mass function in the planetary regime is flat or most likely decreasing.
The main results of our study can be summarised as follows:
-
We derived Sloan -band magnitudes for 25 sources and placed lower limits for another three substellar candidates in UpSco.
-
We present VLT/X-shooter near-infrared (1.0–2.5 m) spectra for 15 candidates fainter than 17 mag, equivalent to 10 Jupiter masses at the age (5–10 Myr) and distance of UpSco.
-
We present VLT/X-shooter optical near-infrared spectra of six late-M dwarf candidates previously recognised as members and classified in the optical.
-
We present GTC/OSIRIS low-resolution optical spectra for all L-type members with near-infrared spectra taken with the X-shooter instrument.
-
We exploit the WISE mid-infrared survey to extend the current UpSco sequence of members to fainter magnitudes and lower masses and look for excesses.
-
We classify our targets based on their SED in the near-infrared, rejecting only two of the 15 targets with spectroscopy and cast doubt on another one. This fact demonstrates the strength of our photometric and astrometric selections to pick up substellar and planetary-mass members in UpSco.
-
We observe a trend towards earlier spectral types in the optical compared to the infrared for several members classified as M9–L1 in Lodieu et al. (2008) and five of our targets with both optical and infrared spectra. This trend seems to affect sources later than M9 all the way to late-L dwarfs.
-
We detect H in emission in four L-type sources. Two objects, VISTA J16112215 and VISTA J16072146, also have likely mid-infrared flux excesses, thus supporting the disk accretion scenario and providing evidence of the persistence of accretion at very low masses and at the age of the UpSco association (5–10 Myr).
-
We measure the pseudo-equivalent widths of gravity-sensitive doublets present in the near-infrared, whose strength confirms the youth of our candidates.
-
We present a wide variety of spectral indices comparing our sample with a sample of young L dwarfs and several field L0–L9 dwarfs. We show that a few indices (H-cont, CO, CH4-H, FeH-H) are highly sensitive to gravity (or age) while most of the water-based indices are good proxies for spectral typing. The VO absorption features at 1.06 m and 1.18 m are still present in late-L dwarfs at the age of UpSco.
-
We measure the radial velocities of confirmed members from the X-shooter infrared spectra. the distribution of velocities is consistent with the mean value reported for higher mass members.
-
We infer effective temperatures and gravities fitting the full photometric spectral energy distribution from 0.8 to 4.5 m with different sets of theoretical models. We find that these physical parameters tend to be underestimated with respect to the parameters derived from the spectral energy distribution model atmosphere fits to the spectra.
-
We derived bolometric corrections for our L dwarf members and found similar values and trends for the BCJ over the L1–L7 range but a slight different tendency for BCK for young L dwarfs compared to field L dwarfs.
-
We searched for higher mass wide companions to our planetary-mass members and place an upper limit of 3.4% on the frequency of systems with projected physical separations greater than 100 au.
Our deep survey is currently limited by the depth of the -band because the final stack is only 0.7 mag deeper in than in (21.2 mag vs 20.5 mag completeness limits) while the colours of the coolest sources confirmed spectroscopically are in the 1.4–1.8 mag range (see Fig. 3 in L13). Hence, our deep -band might contain some yet-to-be-found T-type dwarfs with an age of 5–10 Myr. Assuming that our survey reaches members with masses as low as 5 MJup, we might still be far from being able to test opacity limit for the fragmentation, i.e. the mass at which one object is unable to contract further because it can not radiate its heat to collapse further (Low & Lynden-Bell, 1976; Rees, 1976; Boss, 2001). Indeed, according to the COND03 models (Baraffe et al., 2002), a 1 MJup is 4.0 and 5.4 mag fainter in than a 5 MJup brown dwarf at 5 and 10 Myr, respectively. In the future, we might get some hints on the theory of the fragmentation with upcoming space missions like the James Webb Space Telescope (Clampin, 2008, JWST;)99 9 www.jwst.nasa.gov/, the Wide Field Infrared Survey telescope (WFIRST)1010 10 http://wfirst.gsfc.nasa.gov/, and Euclid (Mellier, 2016)1111 11 http://sci.esa.int/euclid/ as well as the Large Synoptic Survey Telescope from the ground (Ivezic et al. 2008)1212 12 www.lsst.org.
Acknowledgments
NL was partly funded by the Ramón y Cajal fellowship number 08-303-01-0. NL and VJSB are supported by programme AYA2015-69350-C3-2-P and MRZO by programme AYA2016-79425-C3-2-P from Spanish Ministry of Economy and Competitiveness (MINECO).
KPR acknowledges CONICYT PAI Concurso Nacional de Inserción en la Academia, Convocatoria 2016 Folio PAI79160052. NL thanks Kevin Luhman for providing his own spectra of young brown dwarfs. We thank the referee for his/her comments that improved the clarity of the paper.
This work is based on observations (programmes GTC4-14A and GTC25-16A; PI Lodieu) made with the Gran Telescopio Canarias (GTC), operated on the island of La Palma in the Spanish Observatorio del Roque de los Muchachos of the Instituto de Astrofísica de Canarias. We are thankful to F. Garzón and the EMIR consortium for the development of this instrument on the GTC.
Based on observations collected at the European Organisation for Astronomical Research in the Southern Hemisphere under ESO programme(s) 095.C-0812(A) and 089-C.0102(ABC).
Based on data from the UKIRT Infrared Deep Sky Survey (UKIDSS). The UKIDSS project is defined in Lawrence et al. (2007) and uses the UKIRT Wide Field Camera (Casali et al., 2007, WFCAM;). The photometric system is described in Hewett et al. (2006) and the calibration is described Hodgkin et al. (2009). The pipeline processing and science archive are described in Irwin et al. (2009, in prep) and Hambly et al. (2008).
This publication makes use of VOSA, developed under the Spanish Virtual Observatory project supported from the Spanish MICINN through grant AyA2011-24052.
This research has made use of the Simbad and Vizier (Ochsenbein et al., 2000) databases, operated at the Centre de Données Astronomiques de Strasbourg (CDS), and of NASA’s Astrophysics Data System Bibliographic Services (ADS). This research has also made use of the IRTF spectral library at http://irtfweb.ifa.hawaii.edu/spex/IRTF_Spectral_Library/index.html.
References
- Adame et al. (2011) Adame L., Calvet N., Luhman K. L., D’Alessio P., Furlan E., McClure M. K., Hartmann L., Forrest W. J., Watson D. M., 2011, ApJL, 726, L3
- Allard et al. (2001) Allard F., Hauschildt P. H., Alexander D. R., Tamanai A., Schweitzer A., 2001, ApJ, 556, 357
- Allard et al. (2012a) Allard F., Homeier D., Freytag B., 2012a, Royal Society of London Philosophical Transactions Series A, 370, 2765
- Allard et al. (2012b) Allard F., Homeier D., Freytag B., 2012b, Philosophical Transactions of the Royal Society of London Series A, 370, 2765
- Aller et al. (2013) Aller K. M., Kraus A. L., Liu M. C., Burgett W. S., Chambers K. C., Hodapp K. W., Kaiser N., Magnier E. A., Price P. A., 2013, ApJ, 773, 63
- Allers et al. (2007) Allers K. N., Jaffe D. T., Luhman K. L., Liu M. C., Wilson J. C., Skrutskie M. F., Nelson M., Peterson D. E., Smith J. D., Cushing M. C., 2007, ApJ, 657, 511
- Allers & Liu (2013) Allers K. N., Liu M. C., 2013, ApJ, 772, 79
- Alonso et al. (2015) Alonso R., Deeg H. J., Hoyer S., Lodieu N., Palle E., Sanchis-Ojeda R., 2015, A&A, 584, L8
- Alves de Oliveira et al. (2012) Alves de Oliveira C., Moraux E., Bouvier J., Bouy H., 2012, A&A, 539, A151
- Alves de Oliveira et al. (2010) Alves de Oliveira C., Moraux E., Bouvier J., Bouy H., Marmo C., Albert L., 2010, A&A, 515, A75
- Alves de Oliveira et al. (2013) Alves de Oliveira C., Moraux E., Bouvier J., Duchêne G., Bouy H., Maschberger T., Hudelot P., 2013, A&A, 549, A123
- Ardila et al. (2000) Ardila D., Martín E., Basri G., 2000, AJ, 120, 479
- Baraffe et al. (2002) Baraffe I., Chabrier G., Allard F., Hauschildt P. H., 2002, A&A, 382, 563
- Baraffe et al. (2016) Baraffe I., Elbakyan V. G., Vorobyov E. I., Chabrier G., 2016, aap
- Baraffe et al. (2015) Baraffe I., Homeier D., Allard F., Chabrier G., 2015, A&A, 577, A42
- Barbier-Brossat & Figon (2000) Barbier-Brossat M., Figon P., 2000, A&AS, 142, 217
- Barrado y Navascués et al. (2007) Barrado y Navascués D., Stauffer J. R., Morales-Calderón M., Bayo A., Fazzio G., Megeath T., Allen L., Hartmann L. W., Calvet N., 2007, ApJ, 664, 481
- Barrado y Navascués et al. (2001) Barrado y Navascués D., Zapatero Osorio M. R., Béjar V. J. S., Rebolo R., Martín E. L., Mundt R., Bailer-Jones C. A. L., 2001, A&A, 377, L9
- Batalha (2014) Batalha N. M., 2014, Proceedings of the National Academy of Science, 111, 12647
- Bayo et al. (2012) Bayo A., Barrado D., Huélamo N., Morales-Calderón M., Melo C., Stauffer J., Stelzer B., 2012, A&A, 547, A80
- Bayo et al. (2011) Bayo A., Barrado D., Stauffer J., Morales-Calderón M., Melo C., Huélamo N., Bouy H., Stelzer B., Tamura M., Jayawardhana R., 2011, A&A, 536, A63
- Bayo et al. (2008) Bayo A., Rodrigo C., Barrado Y Navascués D., Solano E., Gutiérrez R., Morales-Calderón M., Allard F., 2008, A&A, 492, 277
- Béjar et al. (2001) Béjar V. J. S., Martín E. L., Zapatero Osorio M. R., Rebolo R., Barrado y Navascués D., Bailer-Jones C. A. L., Mundt R., Baraffe I., Chabrier C., Allard F., 2001, ApJ, 556, 830
- Béjar et al. (2008) Béjar V. J. S., Zapatero Osorio M. R., Pérez-Garrido A., Álvarez C., Martín E. L., Rebolo R., Villó-Pérez I., Díaz-Sánchez A., 2008, ApJL, 673, L185
- Béjar et al. (1999) Béjar V. J. S., Zapatero Osorio M. R., Rebolo R., 1999, ApJ, 521, 671
- Béjar et al. (2011) Béjar V. J. S., Zapatero Osorio M. R., Rebolo R., Caballero J. A., Barrado D., Martín E. L., Mundt R., Bailer-Jones C. A. L., 2011, ApJ, 743, 64
- Best et al. (2017) Best W. M. J., Liu M. C., Magnier E. A., Bowler B. P., Aller K. M., Zhang Z., Kotson M. C., Burgett W. S., Chambers K. C., Draper P. W., Flewelling H., Hodapp K. W., Kaiser N., Metcalfe N., Wainscoat R. J., Waters C., 2017, ApJ, 837, 95
- Bihain et al. (2009) Bihain G., Rebolo R., Zapatero Osorio M. R., Béjar V. J. S., Villó-Pérez I., Díaz-Sánchez A., Pérez-Garrido A., 9 co-authors 2009, A&A, 506, 1169
- Biller et al. (2011) Biller B., Allers K., Liu M., Close L. M., Dupuy T., 2011, ApJ, 730, 39
- Bonnefoy et al. (2014) Bonnefoy M., Chauvin G., Lagrange A.-M., Rojo P., Allard F., Pinte C., Dumas C., Homeier D., 2014, A&A, 562, A127
- Borucki et al. (2010) Borucki W. J., Koch D., Basri G., Batalha N., Brown T., Caldwell D., Caldwell J., Christensen-Dalsgaard J., 53 co-authors 2010, 327, 977
- Boss (2001) Boss A. P., 2001, ApJL, 551, L167
- Bouvier et al. (2008) Bouvier J., Kendall T., Meeus G., Testi L., Moraux E., Stauffer J. R., James D., Cuillandre J.-C., Irwin J., McCaughrean M. J., Baraffe I., Bertin E., 2008, A&A, 481, 661
- Briceño et al. (1998) Briceño C., Hartmann L., Stauffer J., Martín E., 1998, AJ, 115, 2074
- Burgasser et al. (2006) Burgasser A. J., Geballe T. R., Leggett S. K., Kirkpatrick J. D., Golimowski D. A., 2006, ApJ, 637, 1067
- Burgasser et al. (2002) Burgasser A. J., Kirkpatrick J. D., Brown M. E., Reid I. N., Burrows A., Liebert J., Matthews K., Gizis J. E., Dahn C. C., Monet D. G., Cutri R. M., Skrutskie M. F., 2002, ApJ, 564, 421
- Burgasser et al. (2004) Burgasser A. J., Kirkpatrick J. D., McGovern M. R., McLean I. S., Prato L., Reid I. N., 2004, ApJ, 604, 827
- Burgess et al. (2009) Burgess A. S. M., Moraux E., Bouvier J., Marmo C., Albert L., Bouy H., 2009, A&A, 508, 823
- Caballero et al. (2007) Caballero J. A., Béjar V. J. S., Rebolo R., Eislöffel J., Zapatero Osorio M. R., Mundt R., Barrado Y Navascués D., Bihain G., Bailer-Jones C. A. L., Forveille T., Martín E. L., 2007, A&A, 470, 903
- Casali et al. (2007) Casali M., Adamson A., Alves de Oliveira C., Almaini O., Burch K., Chuter T., Elliot J., 23 co-authors 2007, A&A, 467, 777
- Cepa et al. (2000) Cepa J., Aguiar M., Escalera V. G., Gonzalez-Serrano I., Joven-Alvarez E., Peraza L., Rasilla J. L., Rodriguez-Ramos L. F., Gonzalez J. J., Cobos Duenas F. J., Sanchez B., Tejada C., Bland-Hawthorn J., Militello C., Rosa F., 2000, in M. Iye & A. F. Moorwood ed., Society of Photo-Optical Instrumentation Engineers (SPIE) Conference Series Vol. 4008 of Society of Photo-Optical Instrumentation Engineers (SPIE) Conference Series, OSIRIS tunable imager and spectrograph. pp 623–631
- Chabrier (2005) Chabrier G., 2005, in E. Corbelli, F. Palla, & H. Zinnecker ed., The Initial Mass Function 50 Years Later Vol. 327 of Astrophysics and Space Science Library, The Initial Mass Function: from Salpeter 1955 to 2005. p. 41
- Chen et al. (2011) Chen C. H., Mamajek E. E., Bitner M. A., Pecaut M., Su K. Y. L., Weinberger A. J., 2011, ApJ, 738, 122
- Chiang & Chen (2015) Chiang P., Chen W. P., 2015, ApJL, 811, L16
- Chiang et al. (2015) Chiang P., Chen W.-P., Albert L., Liu M., Magnier E. A., 2015, MNRAS, 448, 522
- Chiu et al. (2006) Chiu K., Fan X., Leggett S. K., Golimowski D. A., Zheng W., Geballe T. R., Schneider D. P., Brinkmann J., 2006, AJ, 131, 2722
- Clampin (2008) Clampin M., 2008, Advances in Space Research, 41, 1983
- Cruz et al. (2009) Cruz K. L., Kirkpatrick J. D., Burgasser A. J., 2009, AJ, 137, 3345
- Cruz et al. (2003) Cruz K. L., Reid I. N., Liebert J., Kirkpatrick J. D., Lowrance P. J., 2003, AJ, 126, 2421
- Cushing et al. (2005) Cushing M. C., Rayner J. T., Vacca W. D., 2005, ApJ, 623, 1115
- Cushing et al. (2000) Cushing M. C., Tokunaga A. T., Kobayashi N., 2000, AJ, 119, 3019
- Cutri et al. (2003) Cutri R. M., Skrutskie M. F., van Dyk S., Beichman C. A., Carpenter J. M., Chester T., Cambresy L., Evans T., Fowler J., Gizis J., 15 coauthors 2003, 2MASS All Sky Catalog of point sources, 2246
- Dahm et al. (2012) Dahm S. E., Slesnick C. L., White R. J., 2012, ApJ, 745, 56
- Dahn et al. (2002) Dahn C. C., Harris H. C., Vrba F. J., Guetter H. H., Canzian B., Henden A. A., Levine S. E., Luginbuhl C. B., Monet A. K. B., Monet D. G., Pier J. R., Stone R. C., Walker R. L., Burgasser A. J., Gizis J. E., Kirkpatrick J. D., Liebert J., Reid I. N., 2002, AJ, 124, 1170
- David et al. (2016) David T. J., Hillenbrand L. A., Cody A. M., Carpenter J. M., Howard A. W., 2016, ApJ, 816, 21
- David et al. (2016) David T. J., Hillenbrand L. A., Petigura E. A., Carpenter J. M., Crossfield I. J. M., Hinkley S., Ciardi D. R., Howard A. W., Isaacson H. T., Cody A. M., Schlieder J. E., Beichman C. A., Barenfeld S. A., 2016, Nat, 534, 658
- Dawson et al. (2011) Dawson P., Scholz A., Ray T. P., 2011, MNRAS, 418, 1231
- Dawson et al. (2013) Dawson P., Scholz A., Ray T. P., Marsh K. A., Wood K., Natta A., Padgett D., Ressler M. E., 2013, MNRAS, 429, 903
- Dawson et al. (2014) Dawson P., Scholz A., Ray T. P., Peterson D. E., Rodgers-Lee D., Geers V., 2014, MNRAS, 442, 1586
- de Bruijne et al. (1997) de Bruijne J. H. J., Hoogerwerf R., Brown A. G. A., Aguilar L. A., de Zeeuw P. T., 1997, in ESA SP-402: Hipparcos - Venice ’97 Improved Methods for Identifying Moving Groups. pp 575–578
- de Zeeuw et al. (1999) de Zeeuw P. T., Hoogerwerf R., de Bruijne J. H. J., Brown A. G. A., Blaauw A., 1999, AJ, 117, 354
- Delgado-Donate et al. (2003) Delgado-Donate E. J., Clarke C. J., Bate M. R., 2003, MNRAS, 342, 926
- D’Odorico et al. (2006) D’Odorico S., Dekker H., Mazzoleni R., Vernet J., Guinouard I., Groot P., Hammer F., Rasmussen P. K., Kaper L., Navarro R., Pallavicini R., Peroux C., Zerbi F. M., 2006, in Society of Photo-Optical Instrumentation Engineers (SPIE) Conference Series Vol. 6269 of Society of Photo-Optical Instrumentation Engineers (SPIE) Conference Series, X-shooter UV- to K-band intermediate-resolution high-efficiency spectrograph for the VLT: status report at the final design review
- Duflot et al. (1995) Duflot M., Figon P., Meyssonnier N., 1995, A&AS, 114, 269
- Dupuy & Liu (2012) Dupuy T. J., Liu M. C., 2012, ApJS, 201, 19
- Faherty et al. (2016) Faherty J. K., Riedel A. R., Cruz K. L., Gagne J., Filippazzo J. C., Lambrides E., Fica H., Weinberger A., Thorstensen J. R., Tinney C. G., Baldassare V., Lemonier E., Rice E. L., 2016, ApJS, 225, 10
- Fang et al. (2017) Fang Q., Herczeg G. J., Rizzuto A., 2017, ApJ, 842, 123
- Filippazzo et al. (2015) Filippazzo J. C., Rice E. L., Faherty J., Cruz K. L., Van Gordon M. M., Looper D. L., 2015, ApJ, 810, 158
- Gagné et al. (2015) Gagné J., Faherty J. K., Cruz K. L., Lafreniére D., Doyon R., Malo L., Burgasser A. J., Naud M.-E., Artigau É., Bouchard S., Gizis J. E., Albert L., 2015, ApJS, 219, 33
- Gagné et al. (2014) Gagné J., Lafrenière D., Doyon R., Malo L., Artigau É., 2014, ApJ, 783, 121
- Gagné et al. (2015) Gagné J., Lafrenière D., Doyon R., Malo L., Artigau É., 2015, ApJ, 798, 73
- Garzón & EMIR Team (2016) Garzón F., EMIR Team 2016, in Skillen I., Barcells M., Trager S., eds, Multi-Object Spectroscopy in the Next Decade: Big Questions, Large Surveys, and Wide Fields Vol. 507 of Astronomical Society of the Pacific Conference Series, EMIR, the NIR MOS and Imager for the GTC. p. 297
- Gauza et al. (2015) Gauza B., Béjar V. J. S., Pérez-Garrido A., Rosa Zapatero Osorio M., Lodieu N., Rebolo R., Pallé E., Nowak G., 2015, ApJ, 804, 96
- Geballe et al. (2002) Geballe T. R., Knapp G. R., Leggett S. K., Fan X., Golimowski D. A., Anderson S., Brinkmann J., Csabai I., 21 coauthors 2002, ApJ, 564, 466
- Geers et al. (2011) Geers V., Scholz A., Jayawardhana R., Lee E., Lafrenière D., Tamura M., 2011, ApJ, 726, 23
- Golimowski et al. (2004) Golimowski D. A., Leggett S. K., Marley M. S., Fan X., Geballe T. R., Knapp G. R., Vrba F. J., Henden A. A., 11 authors 2004, AJ, 127, 3516
- Gontcharov (2006) Gontcharov G. A., 2006, Astronomy Letters, 32, 759
- Gorlova et al. (2003) Gorlova N. I., Meyer M. R., Rieke G. H., Liebert J., 2003, ApJ, 593, 1074
- Greenstein & Trimble (1967) Greenstein J. L., Trimble V. L., 1967, ApJ, 149, 283
- Hambly et al. (2008) Hambly N. C., Collins R. S., Cross N. J. G., Mann R. G., Read M. A., Sutorius E. T. W., Bond I., Bryant J., Emerson J. P., Lawrence A., Rimoldini L., Stewart J. M., Williams P. M., Adamson A., Hirst P., Dye S., Warren S. J., 2008, MNRAS, 384, 637
- Harrington & Dahn (1980) Harrington R. S., Dahn C. C., 1980, AJ, 85, 454
- Herczeg et al. (2009) Herczeg G. J., Cruz K. L., Hillenbrand L. A., 2009, ApJ, 696, 1589
- Hewett et al. (2006) Hewett P. C., Warren S. J., Leggett S. K., Hodgkin S. T., 2006, MNRAS, 367, 454
- Hillenbrand et al. (2013) Hillenbrand L. A., Hoffer A. S., Herczeg G. J., 2013, AJ, 146, 85
- Hodgkin et al. (2009) Hodgkin S. T., Irwin M. J., Hewett P. C., Warren S. J., 2009, MNRAS, 394, 675
- Ingraham et al. (2014) Ingraham P., Albert L., Doyon R., Artigau E., 2014, ApJ, 782, 8
- Jameson et al. (2008) Jameson R. F., Casewell S. L., Bannister N. P., Lodieu N., Keresztes K., Dobbie P. D., Hodgkin S. T., 2008, MNRAS, 384, 1399
- Kausch et al. (2015) Kausch W., Noll S., Smette A., Kimeswenger S., Barden M., Szyszka C., Jones A. M., Sana H., Horst H., Kerber F., 2015, A&A, 576, A78
- Kirkpatrick et al. (2006) Kirkpatrick J. D., Barman T. S., Burgasser A. J., McGovern M. R., McLean I. S., Tinney C. G., Lowrance P. J., 2006, ApJ, 639, 1120
- Kirkpatrick et al. (1991) Kirkpatrick J. D., Henry T. J., McCarthy D. W., 1991, ApJS, 77, 417
- Kirkpatrick et al. (1999) Kirkpatrick J. D., Reid I. N., Liebert J., Cutri R. M., Nelson B., Beichman C. A., Dahn C. C., Monet D. G., Gizis J. E., Skrutskie M. F., 1999, ApJ, 519, 802
- Knapp et al. (2004) Knapp G. R., Leggett S. K., Fan X., Marley M. S., Geballe T. R., Golimowski D. A., Finkbeiner D., Gunn J. E., 21 co-authors 2004, AJ, 127, 3553
- Köhler et al. (2000) Köhler R., Kunkel M., Leinert C., Zinnecker H., 2000, A&A, 356, 541
- Kraus et al. (2015) Kraus A. L., Cody A. M., Covey K. R., Rizzuto A. C., Mann A. W., Ireland M. J., 2015, ApJ, 807, 3
- Kraus et al. (2008) Kraus A. L., Ireland M. J., Martinache F., Lloyd J. P., 2008, ApJ, 679, 762
- Kroupa et al. (2013) Kroupa P., Weidner C., Pflamm-Altenburg J., Thies I., Dabringhausen J., Marks M., Maschberger T., 2013, The Stellar and Sub-Stellar Initial Mass Function of Simple and Composite Populations. p. 115
- Kunkel (1999) Kunkel M., 1999, Ph.D. Thesis, Julius-Maximilians-Universität Würzburg
- Lafrenière et al. (2011) Lafrenière D., Jayawardhana R., Janson M., Helling C., Witte S., Hauschildt P., 2011, ApJ, 730, 42
- Lafrenière et al. (2008) Lafrenière D., Jayawardhana R., van Kerkwijk M. H., 2008, ApJL, 689, L153
- Lafrenière et al. (2010) Lafrenière D., Jayawardhana R., van Kerkwijk M. H., 2010, ApJ, 719, 497
- Lafrenière et al. (2014) Lafrenière D., Jayawardhana R., van Kerkwijk M. H., Brandeker A., Janson M., 2014, ApJ, 785, 47
- Lawrence et al. (2007) Lawrence A., Warren S. J., Almaini O., Edge A. C., Hambly N. C., 17 co-authors 2007, MNRAS, 379, 1599
- Lépine & Shara (2005) Lépine S., Shara M. M., 2005, AJ, 129, 1483
- Lissauer et al. (2014) Lissauer J. J., Dawson R. I., Tremaine S., 2014, Nature, 513, 336
- Liu et al. (2016) Liu M. C., Dupuy T. J., Allers K. N., 2016, ApJ, 833, 96
- Liu et al. (2013) Liu M. C., Magnier E. A., Deacon N. R., Allers K. N., Dupuy T. J., Kotson M. C., Aller K. M., Burgett W. S., Chambers K. C., Draper P. W., Hodapp K. W., Jedicke R., Kaiser N., Kudritzki R.-P., Metcalfe N., Morgan J. S., Price P. A., Tonry J. L., Wainscoat R. J., 2013, ApJL, 777, L20
- Lodieu (2013) Lodieu N., 2013, MNRAS, 431, 3222
- Lodieu et al. (2015) Lodieu N., Alonso R., González Hernández J. I. Sanchis-Ojeda R., Narita N., Kawashima Y., Kawauchi K., Suárez Mascareño A., Deeg H., et al. 2015, A&A, 584, A128
- Lodieu et al. (2013) Lodieu N., Dobbie P. D., Cross N. J. G., Hambly N. C., Read M. A., Blake R. P., Floyd D. J. E., 2013, MNRAS, 435, 2474
- Lodieu et al. (2011) Lodieu N., Dobbie P. D., Hambly N. C., 2011, A&A, 527, A24
- Lodieu et al. (2011) Lodieu N., Hambly N. C., Dobbie P. D., Cross N. J. G., Christensen L., Martin E. L., Valdivielso L., 2011, MNRAS, 418, 2604
- Lodieu et al. (2006) Lodieu N., Hambly N. C., Jameson R. F., 2006, MNRAS, 373, 95
- Lodieu et al. (2008) Lodieu N., Hambly N. C., Jameson R. F., Hodgkin S. T., 2008, MNRAS, 383, 1385
- Lodieu et al. (2007) Lodieu N., Hambly N. C., Jameson R. F., Hodgkin S. T., Carraro G., Kendall T. R., 2007, MNRAS, 374, 372
- Lodieu et al. (2009) Lodieu N., Zapatero Osorio M. R., Rebolo R., Martín E. L., Hambly N. C., 2009, A&A, 505, 1115
- Low & Lynden-Bell (1976) Low C., Lynden-Bell D., 1976, MNRAS, 176, 367
- Lucas & Roche (2000) Lucas P. W., Roche P. F., 2000, MNRAS, 314, 858
- Lucas et al. (2001) Lucas P. W., Roche P. F., Allard F., Hauschildt P. H., 2001, MNRAS, 326, 695
- Luhman (2004) Luhman K. L., 2004, ApJ, 602, 816
- Luhman (2012) Luhman K. L., 2012, ARA&A, 50, 65
- Luhman et al. (2007) Luhman K. L., Allers K. N., Jaffe D. T., Cushing M. C., Williams K. A., Slesnick C. L., Vacca W. D., 2007, ApJ, 659, 1629
- Luhman et al. (2003) Luhman K. L., Briceño C., Stauffer J. R., Hartmann L., Barrado y Navascués D., Caldwell N., 2003, ApJ, 590, 348
- Luhman et al. (2016) Luhman K. L., Esplin T. L., Loutrel N. P., 2016, ApJ
- Luhman et al. (2008) Luhman K. L., Hernández J., Downes J. J., Hartmann L., Briceño C., 2008, ApJ, 688, 362
- Luhman & Mamajek (2012) Luhman K. L., Mamajek E. E., 2012, ApJ, 758, 31
- Luhman et al. (2016) Luhman K. L., Mamajek E. E., Shukla S. J., Loutrel N. P., 2016, AJ
- Luhman & Rieke (1999) Luhman K. L., Rieke G. H., 1999, ApJ, 525, 440
- Luhman et al. (1998) Luhman K. L., Rieke G. H., Lada C. J., Lada E. A., 1998, ApJ, 508, 347
- Luhman et al. (2003) Luhman K. L., Stauffer J. R., Muench A. A., Rieke G. H., Lada E. A., Bouvier J., Lada C. J., 2003, ApJ, 593, 1093
- Malo et al. (2014) Malo L., Artigau É., Doyon R., Lafrenière D., Albert L., Gagné J., 2014, ApJ, 788, 81
- Manjavacas et al. (2014) Manjavacas E., Bonnefoy M., Schlieder J. E., Allard F., Rojo P., Goldman B., Chauvin G., Homeier D., Lodieu N., Henning T., 2014, A&A, 564, A55
- Mann et al. (2016) Mann A. W., Newton E. R., Rizzuto A. C., Irwin J., Feiden G. A., Gaidos E., Mace G. N., Kraus A. L., James D. J., Ansdell M., Charbonneau D., Covey K. R., Ireland M. J., Jaffe D. T., Johnson M. C., Kidder B., Vanderburg A., 2016, AJ, 152, 61
- Marsh et al. (2010) Marsh K. A., Kirkpatrick J. D., Plavchan P., 2010, ApJL, 709, L158
- Marsh et al. (2010) Marsh K. A., Plavchan P., Kirkpatrick J. D., Lowrance P. J., Cutri R. M., Velusamy T., 2010, ApJ, 719, 550
- Martin et al. (2017) Martin E. C., Mace G. N., McLean I. S., Logsdon S. E., Rice E. L., Kirkpatrick J. D., Burgasser A. J., McGovern M. R., Prato L., 2017, ApJ
- Martín et al. (2004) Martín E. L., Delfosse X., Guieu S., 2004, AJ, 127, 449
- Martín et al. (2001) Martín E. L., Dougados C., Magnier E., Ménard F., Magazzù A., Cuillandre J.-C., Delfosse X., 2001, ApJL, 561, L195
- Martín et al. (1996) Martín E. L., Rebolo R., Zapatero Osorio M. R., 1996, ApJ, 469, 706
- Martín & Zapatero Osorio (2003) Martín E. L., Zapatero Osorio M. R., 2003, ApJL, 593, L113
- Martín et al. (2001) Martín E. L., Zapatero Osorio M. R., Barrado y Navascués D., Béjar V. J. S., Rebolo R., 2001, ApJL, 558, L117
- McGovern et al. (2004) McGovern M. R., Kirkpatrick J. D., McLean I. S., Burgasser A. J., Prato L., Lowrance P. J., 2004, ApJ, 600, 1020
- McLean et al. (2003) McLean I. S., McGovern M. R., Burgasser A. J., Kirkpatrick J. D., Prato L., Kim S. S., 2003, ApJ, 596, 561
- McLean et al. (2007) McLean I. S., Prato L., McGovern M. R., Burgasser A. J., Kirkpatrick J. D., Rice E. L., Kim S. S., 2007, ApJ, 658, 1217
- McLean et al. (2000) McLean I. S., Wilcox M. K., Becklin E. E., Figer D. F., Gilbert A. M., Graham J. R., Larkin J. E., Levenson N. A., Teplitz H. I., Kirkpatrick J. D., 2000, ApJL, 533, L45
- Mellier (2016) Mellier Y., 2016, in 41st COSPAR Scientific Assembly, abstracts from the meeting that was to be held 30 July - 7 August at the Istanbul Congress Center (ICC), Turkey, but was cancelled. See http://cospar2016.tubitak.gov.tr/en/, Abstract H0.2-1-16. Vol. 41 of COSPAR Meeting, Euclid and the Dark Universe
- Miller & Scalo (1979) Miller G. E., Scalo J. M., 1979, ApJS, 41, 513
- Monet et al. (2003) Monet D. G., Levine S. E., Canzian B., Ables H. D., Bird A. R., Dahn C. C., Guetter H. H., Harris H. C., Henden A. A., Leggett S. K., Levison H. F., 18 authors 2003, AJ, 125, 984
- Mužić et al. (2012) Mužić K., Scholz A., Geers V., Jayawardhana R., Tamura M., 2012, ApJ, 744, 134
- Mužić et al. (2015) Mužić K., Scholz A., Geers V. C., Jayawardhana R., 2015, ApJ, 810, 159
- Mužić et al. (2014) Mužić K., Scholz A., Geers V. C., Jayawardhana R., López Martí B., 2014, ApJ, 785, 159
- Ochsenbein et al. (2000) Ochsenbein F., Bauer P., Marcout J., 2000, A&AS, 143, 23
- Peña Ramírez et al. (2016) Peña Ramírez K., Béjar V. J. S., Zapatero Osorio M. R., 2016, A&A, 586, A157
- Peña Ramírez et al. (2012) Peña Ramírez K., Béjar V. J. S., Zapatero Osorio M. R., Petr-Gotzens M. G., Martín E. L., 2012, ApJ, 754, 30
- Peña Ramírez et al. (2015) Peña Ramírez K., Zapatero Osorio M. R., Béjar V. J. S., 2015, A&A, 574, A118
- Peña Ramírez et al. (2011) Peña Ramírez K., Zapatero Osorio M. R., Béjar V. J. S., Rebolo R., Bihain G., 2011, A&A, 532, A42
- Pecaut (2016) Pecaut M. J., 2016, in Kastner J. H., Stelzer B., Metchev S. A., eds, IAU Symposium Vol. 314 of IAU Symposium, Anomalous Spectral Types and Intrinsic Colors of Young Stars. pp 85–90
- Pecaut et al. (2012) Pecaut M. J., Mamajek E. E., Bubar E. J., 2012, ApJ, 746, 154
- Preibisch et al. (2001) Preibisch T., Guenther E., Zinnecker H., 2001, AJ, 121, 1040
- Preibisch et al. (1998) Preibisch T., Guenther E., Zinnecker H., Sterzik M., Frink S., Roeser S., 1998, A&A, 333, 619
- Preibisch & Zinnecker (1999) Preibisch T., Zinnecker H., 1999, AJ, 117, 2381
- Preibisch & Zinnecker (2002) Preibisch T., Zinnecker H., 2002, AJ, 123, 1613
- Reed (2003) Reed B. C., 2003, AJ, 125, 2531
- Rees (1976) Rees M. J., 1976, MNRAS, 176, 483
- Reid et al. (2001) Reid I. N., Burgasser A. J., Cruz K. L., Kirkpatrick J. D., Gizis J. E., 2001, AJ, 121, 1710
- Reid et al. (2008) Reid I. N., Cruz K. L., Kirkpatrick J. D., Allen P. R., Mungall F., Liebert J., Lowrance P., Sweet A., 2008, AJ, 136, 1290
- Rizzuto et al. (2016) Rizzuto A. C., Ireland M. J., Dupuy T. J., Kraus A. L., 2016, ApJ, 817, 164
- Ruiz et al. (1997) Ruiz M. T., Leggett S. K., Allard F., 1997, ApJL, 491, L107
- Salpeter (1955) Salpeter E. E., 1955, ApJ, 121, 161
- Scalo (1986) Scalo J. M., 1986, Fundamentals of Cosmic Physics, 11, 1
- Schmidt et al. (2010) Schmidt S. J., West A. A., Hawley S. L., Pineda J. S., 2010, AJ, 139, 1808
- Scholz et al. (2009) Scholz A., Geers V., Jayawardhana R., Fissel L., Lee E., Lafreniere D., Tamura M., 2009, ApJ, 702, 805
- Scholz et al. (2012) Scholz A., Jayawardhana R., Muzic K., Geers V., Tamura M., Tanaka I., 2012, ApJ, 756, 24
- Scholz et al. (2012) Scholz A., Muzic K., Geers V., Bonavita M., Jayawardhana R., Tamura M., 2012, ApJ, 744, 6
- Skrutskie et al. (2006) Skrutskie M. F., Cutri R. M., Stiening R., Weinberg M. D., Schneider S., Carpenter J. M., 25 co-authors 2006, AJ, 131, 1163
- Slesnick et al. (2006) Slesnick C. L., Carpenter J. M., Hillenbrand L. A., 2006, AJ, 131, 3016
- Slesnick et al. (2004) Slesnick C. L., Hillenbrand L. A., Carpenter J. M., 2004, ApJ, 610, 1045
- Slesnick et al. (2008) Slesnick C. L., Hillenbrand L. A., Carpenter J. M., 2008, ApJ, 688, 377
- Smette et al. (2015) Smette A., Sana H., Noll S., Horst H., Kausch W., Kimeswenger S., Barden M., Szyszka C., Jones A. M., Gallenne A., Vinther J., Ballester P., Taylor J., 2015, A&A, 576, A77
- Song et al. (2012) Song I., Zuckerman B., Bessell M. S., 2012, AJ, 144, 8
- Spezzi et al. (2012) Spezzi L., Alves de Oliveira C., Moraux E., Bouvier J., Winston E., Hudelot P., Bouy H., Cuillandre J.-C., 2012, A&A, 545, A105
- Stassun et al. (2006) Stassun K. G., Mathieu R. D., Valenti J. A., 2006, Nature, 440, 311
- Stassun et al. (2007) Stassun K. G., Mathieu R. D., Valenti J. A., 2007, ApJ, 664, 1154
- Stumpf et al. (2008) Stumpf M. B., Brandner W., Henning T., Bouy H., Koehler R., Hormuth F., Joergens V., Kasper M., 2008, A&A
- Suenaga et al. (2014) Suenaga T., Tamura M., Kuzuhara M., Yanagisawa K., Ishii M., Lucas P. W., 2014, PASJ, 66, 33
- Testi et al. (2001) Testi L., D’Antona F., Ghinassi F., Licandro J., Magazzù A., Maiolino R., Mannucci F., Marconi A., Nagar N., Natta A., Oliva E., 2001, ApJL, 552, L147
- Todorov et al. (2010) Todorov K., Luhman K. L., McLeod K. K., 2010, ApJL, 714, L84
- Tody (1986) Tody D., 1986, in Crawford D. L., ed., Society of Photo-Optical Instrumentation Engineers (SPIE) Conference Series Vol. 627 of Society of Photo-Optical Instrumentation Engineers (SPIE) Conference Series, The IRAF Data Reduction and Analysis System. p. 733
- Tody (1993) Tody D., 1993, in Hanisch R. J., Brissenden R. J. V., Barnes J., eds, Astronomical Data Analysis Software and Systems II Vol. 52 of Astronomical Society of the Pacific Conference Series, IRAF in the Nineties. p. 173
- Tokunaga & Kobayashi (1999) Tokunaga A. T., Kobayashi N., 1999, AJ, 117, 1010
- van Leeuwen (2007) van Leeuwen F., 2007, A&A, 474, 653
- Vernet et al. (2011) Vernet J., Dekker H., D’Odorico S., Kaper L., Kjaergaard P., Hammer F., Randich S., Zerbi F., 82 co-authors 2011, A&A, 536, A105
- Vrba et al. (2004) Vrba F. J., Henden A. A., Luginbuhl C. B., Guetter H. H., Munn J. A., Canzian B., Burgasser A. J., Kirkpatrick J. D., Fan X., Geballe T. R., Golimowski D. A., Knapp G. R., Leggett S. K., Schneider D. P., Brinkmann J., 2004, AJ, 127, 2948
- Walter et al. (1994) Walter F. M., Vrba F. J., Mathieu R. D., Brown A., Myers P. C., 1994, AJ, 107, 692
- Weights et al. (2009) Weights D. J., Lucas P. W., Roche P. F., Pinfield D. J., Riddick F., 2009, MNRAS, 392, 817
- Wesemael et al. (1993) Wesemael F., Greenstein J. L., Liebert J., Lamontagne R., Fontaine G., Bergeron P., Glaspey J. W., 1993, PASP, 105, 761
- West et al. (2008) West A. A., Hawley S. L., Bochanski J. J., Covey K. R., Reid I. N., Dhital S., Hilton E. J., Masuda M., 2008, AJ, 135, 785
- Wright et al. (2010) Wright E. L., Eisenhardt P. R. M., Mainzer A. K., Ressler M. E., Cutri R. M., Jarrett T., Kirkpatrick J. D., 31 co-authors 2010, AJ, 140, 1868
- Wu et al. (2015) Wu Y.-L., Close L. M., Males J. R., Barman T. S., Morzinski K. M., Follette K. B., Bailey V. P., Rodigas T. J., Hinz P., Puglisi A., Xompero M., Briguglio R., 2015, ApJL, 807, L13
- Zakhozhay et al. (2017) Zakhozhay O. V., Zapatero Osorio M. R., Béjar V. J. S., Boehler Y., 2017, MNRAS, 464, 1108
- Zapatero Osorio et al. (2000) Zapatero Osorio M. R., Béjar V. J. S., Martín E. L., Rebolo R., Barrado y Navascués D., Bailer-Jones C. A. L., Mundt R., 2000, Science, 290, 103
- Zapatero Osorio et al. (2002) Zapatero Osorio M. R., Béjar V. J. S., Martín E. L., Rebolo R., Barrado y Navascués D., Mundt R., Eislöffel J., Caballero J. A., 2002, ApJ, 578, 536
- Zapatero Osorio et al. (2008) Zapatero Osorio M. R., Béjar V. J. S., Bihain G., 10 co-authors 2008, A&A, 477, 895
- Zapatero Osorio et al. (2014) Zapatero Osorio M. R., Béjar V. J. S., Miles-Páez P. A., Peña Ramírez K., Rebolo R., Pallé E., 2014, A&A, 568, A6
- Zapatero Osorio et al. (2007) Zapatero Osorio M. R., Caballero J. A., Béjar V. J. S., Rebolo R., Barrado Y Navascués D., Bihain G., Eislöffel J., Martín E. L., Bailer-Jones C. A. L., Mundt R., Forveille T., Bouy H., 2007, A&A, 472, L9
- Zapatero Osorio et al. (2014) Zapatero Osorio M. R., Gálvez Ortiz M. C., Bihain G., Bailer-Jones C. A. L., Rebolo R., Henning T., Boudreault S., Béjar V. J. S., Goldman B., Mundt R., Caballero J. A., 2014, A&A, 568, A77
Appendix A Near-infrared spectral indices
| SpT | H2OA | H2OB | K1 | K2 | H2OJ | CH4J | H2OH | CH4H | H2OK | CH4K | H2O15 | KJ | KH | YJ | HJ | H2Oc | Jcont | Hcont | FeHJ | FeHH | CO | H2OD2 | H2O | H2OD | H2O1 | H2O2 | sHJ | sKJ | sH2OJ | sH2OH1 | sH2OH2 | sH2OK | VOz | Target |
|---|---|---|---|---|---|---|---|---|---|---|---|---|---|---|---|---|---|---|---|---|---|---|---|---|---|---|---|---|---|---|---|---|---|---|
| 10.0 | 0.705 | 0.827 | 0.885 | 0.043 | 0.961 | 0.909 | 0.855 | 1.110 | 0.969 | 1.103 | 1.194 | 0.366 | 0.590 | 0.768 | 0.670 | 1.544 | 1.068 | 1.007 | 0.942 | 0.908 | 0.775 | 0.883 | 1.122 | 1.073 | 0.684 | 0.887 | 0.368 | 0.894 | 0.060 | 0.257 | 0.376 | 0.033 | 2MASSJ00274197p0503417_L0b | |