Loss of community identity in opinion dynamics models as a function of inter-group interaction strength
Abstract
Recent technological changes have increased connectivity between individuals around the world leading to higher frequency interactions between members of communities that would be otherwise distant and disconnected. This paper examines a model of opinion dynamics in interacting communities and studies how increasing interaction frequency affects the ability for communities to retain distinct identities versus falling into consensus or polarized states in which community identity is lost. We also study the effect (if any) of opinion noise related to a tendency for individuals to assert their individuality in homogenous populations. Our work builds on a model we developed previously [11] where the dynamics of opinion change is based on individual interactions that seek to minimize some energy potential based on the differences between opinions across the population.
Keywords:— Opinion Game, Opinion dynamics, Community Identity, Social Interaction
1 Introduction
During the past several years, scientists have built up different models to explain dynamics of opinion evolution in a society [13, 12]. They are called opinion models and have been used to study the dynamics of a set of individuals who communicate their opinion on one or more topics and adjust them based on these interactions.
Early models typically reach a steady state within a small number of interactions (e.g. [2, 3]) such that the population reaches consensus, polarization, or a state in which a set of distinct opinions are held indefinitely by subpopulations. Subpopulations with similar opinions are referred to as clusters.
In the case in which a set of subpopulations exist where each subpopulation reaches a distinct equilibrium opinion state, it is useful to study the effect of parameters on the system that affect communities’ ability to maintain these distinct opinion states such that they do not collapse together. Collapse implies that these subpopulations are no longer distinguishable by having distinct opinion sets. In this work, we consider the consensus equilibrium opinion states to be the identity of each population. These identities reflect shared opinions on any topic, be it volatile topics (such as politics or religion), or benign topics (such as locally popular makes and models of cars).
The stability of identity of such subpopulations is of relevance in social systems where subpopulations correspond to meaningful groups, such as families, townships, political groups, religious groups, and so on. Under what conditions can such subpopulations coexist and maintain their distinct identities with some degree of cross-group interaction? What factors cause them to either merge to a consensus state or diverge to a state in which they adopt polar opposite opinions on a given topic? This is particularly relevant to study in the current world in which subpopulations of people that traditionally have coexisted and maintained different, but non-polarizing opinions, may find it difficult to maintain these distinct identities with respect to specific topics. In particular, the emergence of high-frequency, high-reach communication mechanisms that did not exist prior to the 21st century (e.g., social media) fundamentally change the interaction dynamics between individuals and communities compared to lower frequency, lower reach mechanisms in the past.
The variety of factors which play different roles in real social life where the invention of Internet and technology has brought people together and closer than ever, make the dynamics complex. Therefore, to keep it simple we study two such factors. We would like to investigate:
- •
Stability of communities as a function of inter-community interaction rate.
- •
Effect of symmetric and asymmetric noise on stability of communities in presence of inter-community interactions.
1.1 Opinion models
For the purpose of formal modeling and analysis, we adopt an idealized numerical model of opinions. An opinion is considered to be a numerical value within a range (e.g., ) called opinion space. Individuals are simple agents that hold opinion values on one or more distinct topics. Agents interact in a pairwise fashion to exchange and update their opinion state over time. In the model that we adopt for this work (detailed in [11]), individuals update their opinions after interactions in a manner that reduces the energy of some potential function. A brief summary of the relevant components of the model for this paper are described in Section 2.
1.2 Stability and robustness of subpopulations
In this work we will consider a single large population of individuals in which a set of subpopulations exist, each of which contains a subset of the population whose collective opinion state is in equilibrium. An equilibrium opinion state is reached when interactions between members of the subpopulation do not reduce the overall interaction energy (e.g., the individuals are in a consensus state, (Figs. 1(a) and 1(b)11 1 Agents in Fig. 1(b) follow the bounded confidence model rule.). We consider a stable subpopulation to be one in which the introduction of a new opinion by one individual that is sufficiently small and different from the equilibrium state of the subpopulation will not cause the overall opinion of the population to change by more than some . After introduction, the individual holding the new opinion will eventually be driven towards the equilibrium state of the subpopulation such that the resulting new equilibrium state will be within of the state before the new opinion arrived. We would say that this deviation from the stable point will be damped out within a finite number of interactions (Fig. 1(c)). If this deviant opinion retains its difference from the stable state of the subpopulation from which it emerged, such as by additional deviation before it can be damped out, we could see a difficulty in the subpopulation to damp the opinion out (Fig. 1(d)) leading to an overall effect on the equilibrium state of the subpopulation.


A reinforcement effect emerges when more than one member of the subpopulation makes opinion changes at a frequency above the time scale by which the population can damp out the deviations and return to their previous stable state. When such events occur, we expect that previously stable subpopulations may destabilize and fracture, driving them to new equilibrium states. Under an interaction potential function that supports multiple stable minima (such as a potential supporting both consensus and polarization states), we may observe a rapid disintegration of the subpopulation at equilibrium into a set of polarized subpopulations due to a frequency of introduction of divergent opinions that exceeds the timescale necessary to damp out deviations from equilibrium. When this threshold is passed we would see a loss of identity for subpopulations. They may be driven to a polarized state in which individuals adopt opinions at the extrema of the opinion space (Fig. 1(e)), or a homogenous consensus state in which no distinct subpopulations exist anymore (Fig. 1(b)).
Our hypothesis is that this frequency of deviation is the cause of fracturing of otherwise stable communities into those in which homogenous consensus or polarized opinion states dominate. The interesting result is that populations that would otherwise agree may rapidly split due to high-frequency introduction of opinions outside their consensus state, which is precisely what emerges in social networks where interaction frequency with large populations outside one’s own community is commonplace.
1.3 Individualization tendency
In real life people would like to be unique and different from others, as such our model includes opinion noise representing this natural desire.
It is shown that opinion noise is an important contributing factor to the existence of opinion clusters [9]. In this paper we also study its effect on the stability of interacting subcommunities and whether there exists a relationship between the frequency of interactions and properties such as bias or magnitude of noise. Noise can have different effects in terms of the response of a subcommunity to the introduction of new opinions away from equilibrium. Noise may cause an individual to counterbalance the effect of the new opinion, providing an opposing force that cancels out the deviation. Similarly, noise may reinforce the deviation if it is in the same direction, compounding its effect. In Fig. 2 we see two agents decide to be different from the rest of the group. In Fig. 2(a) they go their way too frequently and cause the group to have a wider range of opinion about previous equilibrium state that in a long run could divide the group into two smaller groups. But as can be seen in Fig. 2(b) if the abrupt change is not too frequent, the community could save its identity.
We study two types of noise: noise in which the change in opinion is symmetric about the equilibrium state, and noise where an individual is more likely to move their opinion in the opposite direction of their subpopulation peers.


1.4 Concepts in the paper
1.4.1 Damping perturbations from equilibrium
Communities do not lose their identity when a single member makes a single (sufficiently small) abrupt change () in their opinion on a given topic. This is due to a damping process that occurs where subsequent repeated interactions within the community with the individual who made the change gradually pulls that individual back to the consensus opinion held by that community. This process is not instantaneous, as each interaction changes the opinions of individuals by a small amount . If , and we expect one interaction with the individual who made the large jump every time units, then we would say that the deviation of size has a damping period of over which time the subpopulation absorbs the deviation and recovers its collective identity with respect to the given topic.
The frequency of deviations is critical. If another deviation occurs before the damping period has elapsed, the deviations may reinforce each other (if they went in the same direction relative to the consensus state) and make it take longer for the entire subpopulation to return to its collective consensus state. When opinion change of nodes are due to interactions across subpopulations, then we must consider the relationship of the damping time necessary to recover from an individual deviation and the frequency of interaction between subpopulations that cause deviations to occur.
1.4.2 Frequency of inter-group interaction
Probability of interaction between two nodes is used as a surrogate for frequency of interaction between them. (See Section 2.1). These probabilities are stored in adjacency matrix as edge weights between nodes. Higher probability of interactions causes more frequent interactions.
1.4.3 Noise via individualization tendency
A somewhat different type of opinion change, an abrupt change, is introduced to the system by adding the individualization tendency to the model. The individualization tendency we use here is an “adaptive” one, i.e. agents desire to leave their community increases according to the two following factors: (a) the difference between a given agent’s opinion and other agents’ opinion decreases and, (b) number of agents whose opinions are close to a given agent increases. In other words, let opinion of agent be given by , and let be a neighborhood of , then individualization tendency of agent becomes more intense as the number of other agents in this neighborhood increases or as decreases. This is given by Eq. (2). This noise is drawn from a normal distribution with a zero mean and adaptive variance.
1.5 Contributions
The model we present in this paper makes some noteworthy contributions to the study of opinion dynamic. We conduct computer experiments to show that:
- •
Increased frequency of interaction between subcommunities causes identity loss.
- •
Individualization tendency makes the identity loss of communities to take place more often and faster.
2 Model
First let us start with some definitions and notation that will be used later in the paper.
Definition 2.1.
Let represent the fully connected network under consideration where is the set of nodes and is the set of edges in which all distinct nodes are connected via an edge with a probability of interaction weight assigned to each edge. The set of all spatial neighbors of node is denoted by contains all nodes in that are connected to via an edge with an interaction probability weight of more than zero.
Definition 2.2.
The set of all possible (numerical) opinions, denoted by , is called opinion space, and in this paper it will be the interval [0,1].
Definition 2.3.
A social group is the set of all nodes in with high probability of interactions. These nodes are located on diagonal blocks of the adjacency matrix of .
Definition 2.4.
A opinion cluster or a (opinion) community is the set of all nodes which agree about a topic. In other words, set of all nodes whose opinion belong to for some . Opinion is called the identity of such community.
In the experiments, members of a given social group hold the same opinion at time .
Definition 2.5.
Define the -opinion-neighbor of node at time , denoted by , to be the set of all nodes whose opinion are in , for some at time .
Definition 2.6.
Individualization tendency, , is a noise randomly chosen from a normal distribution with zero mean and some variance .
2.1 Network connectivity
In this paper, we work with a fully connected graph in which all individuals are connected via an edge with a weight assigned to it. The weight corresponds to the probability that agent will talk to in a single step. The network adjacency matrix A is a block symmetric doubly-stochastic matrix whose entries, , determine the probability of agent choosing agent for an interaction, i.e. weights assigned to edges in are stored in A. Lets denote the number of social groups by where each of them have equal population of size . Then the matrix A would be of the size where is the population of the network.
The entries in diagonal blocks , are interaction probabilities of agents within a social group while the entries in , are probabilities of inter-group interactions.
The adjacency matrix will be generated in two different ways, deterministically and randomly. Consequently two different sets of experiments and analysis will be represented.
2.1.1 Deterministic adjacency matrix
In the first case scenario, the adjacency matrix is generated deterministically by Algorithm 1 in which the probability of interaction between members of a social group are identical, and the interaction probability between any two agents of different groups are the same.
2.1.2 Random adjacency matrix
In this method entries of off-diagonal blocks are randomly chosen from an interval bounded above by some upper bound . So, when then there would not be any interaction between two different communities. We use the iterative method defined by Sinkhorn [14] to generate the doubly-stochastic matrices with a little modification to make them symmetric (Algorithm 2).
At the end of this process, the entries of diagonal blocks will not be equal, which means that, each pair of nodes in the same social group will not have the same frequency, i.e. probability, of interaction.
Note that is a submatrix and is a single entry of A and we use to denote a single entry of the block .
Figure 3 is an (heat map) example of adjacency matrix with groups, each group is consist of nodes. As increases the frequency of inter-group interaction goes up in expense of local group interactions to the point that inter-group connections are tighter than group connections (). When is larger than , it is possible that some entries in the off-diagonal blocks to be larger than the entries within the diagonal blocks.


In (3(c)) the upper bound is set to be , and we see there are places where frequency of inter-group interactions are higher than that of internal ones. The internal group interactions are diluted. The reason that we can still see subpopulations are relatively knitted tightly is that the entries of off-diagonal blocks are chosen randomly from to begin with. So, lots of them start with values smaller than 1/8. We generated 1000 of such matrices for , , and . Therefore, 3000 blocks of size 9 of subgroups. The mean and standard deviation of entries of diagonal blocks, mostly belong to the intervals and , respectively.
2.2 Micro dynamics
Pairwise interaction rule of the model is borrowed from [11]. Let opinion of agent at time be given by . Then the update rule is given by:
| (1) |
where is called learning rate, is called potential function which governs the update rule, and . If boundary condition of opinion space is violated, then opinions will be clamped. adapted from [9], is individualization tendency of agent at time . It incorporates the natural instinct of people wanting to be different [15, 5, 4]. is randomly sampled from a normal distribution where is given by: (The opinion space in [9] is . So, we had to scale the variance to fit our opinion space which is [0,1].)
| (2) |
where is set of (spatial) neighbors of node , the parameter is used to manipulate the strength of individualization tendency. Individualization tendency increases when there is high uniformity. The individualization tendency mentioned above does not take into account direction of movement of a given opinion cluster. It is equally probable that an individual makes an abrupt change in any direction. Therefore, we also consider a system in which agents have a memory in the sense that they will consider direction of movement of the opinion-cluster they belong to, so that it is more probable for them to move in the opposite direction of cluster’s movement.
In order to increase probability of individual tendencies to be in the opposite direction of cluster movements, we sample from a skew normal distribution ( ), defined by [1], where is skewness parameter and variance is defined as before. The skew parameter of such a distribution is given by , where is a constant called skewness strength, and , defined below determines the direction of movement of the cluster to which agent belongs to.
Definition 2.7.
Let , be the set of -opinion-neighbor of agent at time for some . Then define to be the direction that majority of moves towards ( is the sign function):
2.3 Equilibrium response to abrupt individual changes
Let be the deviation from consensus made by individual on the given topic at time . During subsequent interactions between and members , we expect that will move closer to .
Proposition 2.1.
Let and suppose there is no inter-community interaction and let the opinion of group to be at . Let the potential function for all agents to be the same and suppose agent makes an abrupt change: (WLOG assume ), so that it is in attraction domain of the subgroup, then the equilibrium state of the members of subgroup will drift by .
Proof.
since is small enough so that other agents in the group will attract agent , for all agents in define the energy to be the height from . Then total energy of the given community is at . Since all agents are using the same potential function, the step size that a pair of node makes in a single interaction is the same. Therefore, for example, in the first interaction between and we have and . There will not be loss of energy. Hence, after steps, where is large enough, we must have . Therefore, all agents will come to consensus at and the drift size is . ∎
Remark 2.1.
Note that in the Prop. 2.1 it is assumed that is sufficiently small so that agent will be attracted to the subgroup it belongs to. But, for example if a tent potential given by Eq. (3) is used and , then agent will repel the rest of the group , agent and the subgroup will end up in opposite extreme points of opinion space. Or, if a bounded confidence potential is used, where agents will not interact if they are far enough, then after the abrupt change agent and the rest of the group might ignore each other and everyone would stay where they are.
Remark 2.2.
In any interaction, both nodes involved would take steps of the same size. Hence, average of opinions of all nodes has to be the same all the time.
However, for example in Fig. 1(e) we see that the average of all opinions at is 0.75 which is different from average of opinions at which is 0.5. The reason is that the boundaries of opinion space, does not let the nodes to take steps of the right size and therefore, system loses energy and average of opinion of all nodes would not be the same.
3 Experiments
Experiments are done to fairly small populations. They can be extrapolated to larger populations. However, there would be some differences. For example, by 2.1 for a large population, the drift would be smaller, therefore, longer time is needed for communities to collapse. Or, for a fixed , as population increases, the probability of interaction inside a group gets smaller and smaller relative to inter-group interaction probabilities. Therefore, more time is needed to reach a steady state.
3.1 Methods
In the experiments22 2 The codes for this experiments and that of [11] can be found here: https://github.com/HNoorazar/ pairwise interactions follow the update rule given by Eq. (1) with learning rate , and a tent potential function defined by Eq. (3) with . Initial opinion of communities are , and respectively so that they are in an equilibrium state.
| (3) |
Individualization tendency will be sampled from a normal and skewed normal distribution with the same mean and variance. Note that a time step is equal to pairwise interactions.
3.2 Deterministic adjacency experiments
3.2.1 Population size and inter-group interaction rate
Suppose there are subgroups in the network where each group is consist of nodes. Then each column of the matrix has entries, of which of them lie on a diagonal block submatrix and of them lie on the off-diagonal blocks.
In the first step of generating the adjacency matrix, is assigned to diagonal blocks, and is assigned to off-diagonal blocks (Algorithm 1), denote such a matrix by . For example, in the case of and the adjacency matrix (at the beginning of the process) looks like:
| (4) |
In such a setting we are interested in knowing what is the relationship between the population size and the smallest for which the social groups lose their identity and collapse. Hence, in order to find a relation between the two parameters we do the following. For a given column of the matrix , we look at the ratio of sum of entries that lie on off-diagonal blocks to the sum of entries lying on diagonal blocks which is given by . For example, in the matrix given by Eq. (4) the ratio is .
Let us denote the smallest that causes community collapse by and the corresponding ratio by .
Experiments with , different ’s and ’s are run and its results are shown by Fig. 4 and Table 1. For most experiments, the ratio is about .

| 9 | 18 | 27 | 36 | 45 | 54 | 63 | 72 | |
|---|---|---|---|---|---|---|---|---|
| # of games | 160 | 200 | 240 | 280 | 320 | 360 | 420 | 440 |
| # of iterations | 3,750 | 7,500 | 11,250 | 15,000 | 18,750 | 22,500 | 26,250 | 20,000 |
| 0.2790 | 0.3072 | 0.3420 | 0.3264 | 0.3420 | 0.3420 | 0.3570 | 0.3446 |
3.2.2 Individuality tendency causes identity loss
In order to see effect of individuality tendency on identity loss, we pick up an small inter-group probability of interaction, and vary . We can see in Fig. 5 that average of number of opinion clusters goes down as individuality tendency goes up, and causes the communities to lose their identities. However, after some point when grows, individuality tendency causes the social groups to earn a new identity and hence, we see after where average number of clusters reaches its minimum at , the average number of clusters start to grow again. For example, in Fig. 11(c) the parameters are and (This figure has used random adjacency matrix). The plot shows how the individuality tendency causes communities lose their identities and then try to be different. The same result holds for the random adjacency matrix as well.

| 3 | |
| 4 | |
| # of games per | 500 |
| # of iterations per a game | 8000 |
[table]A table beside a figure
Figure 6 also shows, the more people want to be different, the sooner the communities will lose their identity. Please note that these are averages of the times for which the communities lose their identity first over time.

3.3 Random adjacency experiments
3.3.1 No individualization tendency
First lets look at the case in which there is no individualization tendency, i.e. , and is varied (Fig. 7(a)). Having two clusters means communities have merged, since there was not an experiment in which all three communities come to consensus, due to the choice of initialization of opinions and the fact that the tent potential function has two minima. We can see as frequency of interaction goes up, frequency of vanishing the community in the middle goes up as well and the middle community loses its identity and is combined with the other two.
Furthermore, the average time needed for community collapse has an inverse relation with inter-community interaction rate. The more inter-community interaction frequency, the less the time needed for communities to merge into one (Fig. 7(b)).
In some of the experiments, the community whose opinions are in at collapses and merges with the other two communities. Average of collapsing time is taken just over the collapsed cases.


3.3.2 Symmetric tendency of individualization
In this section we sample individualization tendency from a (symmetric) normal distribution. In this case the noise can be in any direction and cluster’s movement direction is not taken into account. An individual can either make an abrupt change in the direction that its neighbors are moving towards, or in the opposite direction. In the experiment whose result is represented by Fig. 7(a) we see that for we get approximately of identity loss (i.e. of the experiments the community in the middle is merged with the other two and in of experiments it maintained its own identity). We set and vary the individualization tendency strength. The result is shown in Fig. 8(a). Individualization tendency will cause the identity loss to take place more frequently.


().
Figure 8(a) and 8(b) have an interesting message. The more one wants to be unique, the less s/he can be. Figure 8(c) is illuminating. At time people in middle community have the urge to be different from other members of their own. They deviate themselves and get close to the other two communities at the extreme points, and then interaction forces, bind them to the other communities. Afterwards, any interaction they make is either from the members of their opinion-neighbors or they interact with agents in the other side of the boundary, which in both cases, they are forced to sit where they are! Lets look at different combinations of and . Average number of clusters for each pairs are computed. We see as both and increase, the community in the middle is effected by the other two and will merge into them. And change of has more effective consequences.
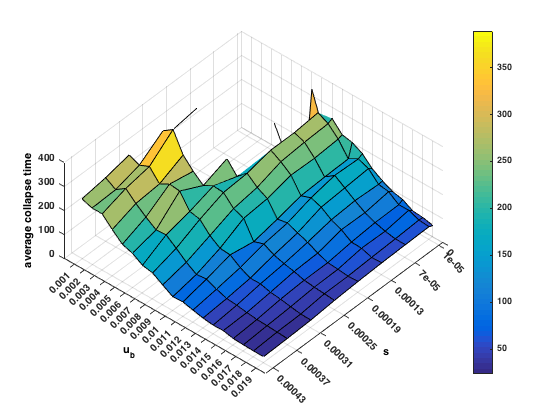
The missing pieces in Fig. 9(b) correspond to the experiments in which all communities kept their identity. In Fig. 8(b), which is one slice of Fig. 9(b) we see that as individualization tendency and collapse time have an inverse relation.

3.3.3 Asymmetric individualization tendency
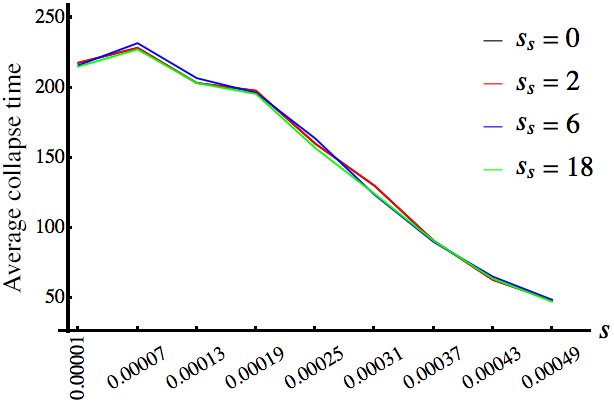
In Fig. 10, where game is replicated 1000 times per , the average time needed for community collapse for both deterministic and random adjacency matrices are compared with four different skewness strength. Individualization tendency distributions have the same mean and variance in all cases, however, the skewness parameters are different. In one case there is no skewness, i.e. distribution is symmetric, and three asymmetric distributions of individualization samples with different skewness strengths are experimented so that the individualization tendency is more probable to be in the direction opposite to direction of movement of cluster to which each agent belongs to. It is interesting that the collapse times are almost identical in almost all cases.

4 Community matters
In Fig. 11(a), there are 3 communities where each community consists of 4 people (N = 12) and the probability of interaction can be at most . In the process of making the adjacency matrix, communities start with an interaction probability of 1/3. Hence, is fairly small. However, we can see when the time is about 130, the middle community is merged with the community at the bottom, and consequently, the individuality tendency is very high. The community that began in the middle separates itself from the bottom community and its members stick together. The integrating force, i.e. interaction rule, overcomes the individuality tendency and glues the agents of middle community together.


| 0.0092 | |
| 0.0199 | |
| 0.0143 | |
[table]A table beside a figure
5 Identity loss is inevitable
With no external force countering pressure from other communities, the slightest probability of interaction between social groups causes loss of identity. Figure 13 shows social groups where each of which is consist of nodes where probability of interaction between them is very small, and there is no noise in the system. The game is run for pairwise interactions. One experiment, Fig. 13(a), uses the deterministic adjacency matrix with and the other, Fig. 13(b), uses randomly generated matrix with . However, in order to reduce the stochastic error, 100 adjacency matrices were generated and average of those is used in this experiment.


6 Discussion and future work
Results presented here shows that as individualization tendency (in the symmetric case) is increased the communities collapse more often and faster. However, results in [9] indicates that individualization tendency can cause emergence of new clusters. Please note that the result presented here does not contradict results of [9] for the following reasons: (a) we did not increase the individualization tendency parameter very much, since its effect is not the primary subject of our study, (b) we did not give the system a very long time so that individuals have the chance of forming a new subcommunity even for such small individualization tendency parameters. It can be seen in Fig. (2) of [9] that over time, communities collapse and break again and again and also it depends on individualization tendency parameter . Moreover, their interacting update rule, which they refer to as integrating forces, is different from that of ours.
Topology of the network, also, plays an important role in time evolution of opinions. Humans naturally tend to talk more frequently to those whom are more similar to, i.e. Homophily, and so, finding friends is an alive creature that has dynamics. Hence, coevolution of network for both discrete and continuous opinions are studied [7, 8, 10, 6]. It would be interesting to apply dynamic topologies to our model.
References
- [1] Adelchi, A. and Antonella, C. (1999). Statistical applications of the multivariate skew-normal distribution. arXiv:0911.2093.
- [2] DeGroot, M. (1974). Reaching a consensus. Journal of the American Statistical Association, 69(345):118–121.
- [3] French, J. R. (1956). A formal theory of social power. Psychological review, 63(3):181–194.
- [4] Hornsey, M. J. and Jetten, J. (2004). The individual within the group: Balancing the need to belong with the need to be different. Personality and Social Psychology Review, 8(3):220–247.
- [5] Imhoff, R. and Erb, H.-P. (2008). What motivates nonconformity? uniqueness seeking blocks majority influence. Personality and Social Psychology Bulletin, 35(3):309–320.
- [6] Iñiguez, G., Kertész, J., Kaski, K. K., and Barrio, R. A. (2009). Opinion and community formation in coevolving networks. Physical Review E - Statistical, Nonlinear, and Soft Matter Physics, 80(6):1–9.
- [7] Kozma, B. and Barrat, A. (2008a). Consensus formation on adaptive networks. Physical Review E - Statistical, Nonlinear, and Soft Matter Physics, 77(1):1–8.
- [8] Kozma, B. and Barrat, A. (2008b). Consensus formation on coevolving networks: groups’ formation and structure. Journal of Physics A: Mathematical and Theoretical, 41.
- [9] Mäs, M., Flache, A., and Helbing, D. (2010). Individualization as driving force of clustering phenomena in humans. PLoS Computational Biology, 6(10).
- [10] Nardini, C., Kozma, B., and Barrat, A. (2008). Who’s talking first? consensus or lack thereof in coevolving opinion formation models. Physical Review Letters, 100(15):1–4.
- [11] Noorazar, H., Sottile, M. J., and Vixie, K. R. (2018). An energy-based interaction model for population opinion dynamics with topic couplin. International Journal of Modern Physics C, 29(11):1850115.
- [12] Proskurnikov, A. V., Ravazzi, C., and Dabbene, F. (2018). Dynamics and structure of social networks from a systems and control viewpoint: A survey of Roberto Tempo’s contributions. Online Social Networks and Media, 7:45–59.
- [13] Proskurnikov, A. V. and Tempo, R. (2018). A tutorial on modeling and analysis of dynamic social networks. Part II. Annual Reviews in Control, 45:166–190.
- [14] Sinkhorn, R. (1964). A relationship between arbitrary positive matrices and doubly stochastic matrices. The Annals of Mathematical Statistics, 35(2):876–879.
- [15] Snyder, C.R., F. H. L. (1980). Uniqueness, The Human Pursuit if Difference. Springer.