printacmref=false
On Quantifying Knowledge Segregation in Society
Abstract.
With rapid increase in online information consumption, especially via social media sites, there have been concerns on whether people are getting selective exposure to a biased subset of the information space, where a user is receiving more of what she already knows, and thereby potentially getting trapped in echo chambers or filter bubbles. Even though such concerns are being debated for some time, it is not clear how to quantify such echo chamber effect. In this position paper, we introduce Information Segregation (or Informational Segregation) measures, which follow the long lines of work on residential segregation. We believe that information segregation nicely captures the notion of exposure to different information by different population in a society, and would help in quantifying the extent of social media sites offering selective (or diverse) information to their users.
1. Introduction
As increasing number of users are consuming information online, often via social media sites like Facebook and Twitter, there have been concerns regarding the content quality Agichtein et al. (2008); Chakraborty et al. (2016), and the possibility of biases in the information people are getting exposed to Colleoni et al. (2014); Chakraborty et al. (2015); Chakraborty et al. (2016); Chakraborty et al. (2017). In such sites, people tend to be connected with other like-minded users out of homophily McPherson et al. (2001); Aiello et al. (2012), and create their own interest groups Bhattacharya et al. (2014); Chakraborty and Ghosh (2013). Thus, there have been concerns that individual users can have selective exposure to information which closely matches their own views, and may not have enough exposure to differing views Colleoni et al. (2014), and such echo chambers or filter bubbles Pariser (2011) may lead to the polarization of society Dandekar et al. (2013); Maes and Flache (2013).
However, two competing theories of opinion polarization have been proposed in earlier works Maes and Bischofberger (2015). One school of thought assumes that opinions are reinforced when likeminded individuals interact with each other Dandekar et al. (2013); Maes and Flache (2013); Friedkin and Johnsen (2011). Whereas, other researchers have argued that exposure to differing views and their subsequent rejections lead to polarization Baldassarri and Gelman (2008); Mason et al. (2007). Polarization can be thought as a measure of the ideological state of the population in a society, which is difficult to quantify in general. Also, it is not explicitly clear what constitutes the ideal notion of the depolarized state of a society.

In this position paper, we argue that an alternative option would be to consider the access to different types of information by members of a society. For example, within a population with multiple parties operating, it is but natural that political opinion would be fragmented. However, it is highly desirable that the entire population have access to the same information / knowledge and they take informed decision to follow different paths. In other words, the bigger issue here is whether different groups of people are having access to similar kind of information or not, where groups may be formed based on predefined demographics (e.g., gender, race, age, income level) or derived features (e.g., political leaning) of people.

To investigate this issue, we borrow ideas from the past literature on residential segregation.
A large number of research works have considered the bipartite matching between different groups of people
and the urban units where they reside (as shown in Figure 1),
and proposed different measures to quantify geographical segregation of different groups Dorfman (1979); Duncan and Duncan (1955).
In a seminal work,
Massey and Denton Massey and Denton (1993) identified five distinct dimensions of residential segregation:
(i) Evenness is the degree to which groups are distributed proportionately across areal units in an urban area.
(ii) Exposure is the extent to which members of different groups share common residential areas.
(iii) Concentration refers to the degree of a group’s agglomeration in urban space.
(iv) Centralization is the extent to which group members reside towards the center of an urban area, and
(v) Clustering measures the degree to which different groups are located adjacent to one another.
Then, they grouped different segregation measures along these five dimensions. Note that some segregation measures are relative between two groups, whereas others are absolute measures of the segregation of one particular group.
Following this line of work, in this paper, we present the notion of Information Segregation (or Informational Segregation). Similar to Figure 1, we consider another bipartite matching between different groups of people and the information units they have access to (shown in Figure 2). Then utilizing this mapping, we can compute information segregation to measure whether different groups in a society are having access to similar kind of information or not.
However, there are two primary aspects where the mapping between people and information units differs from the mapping between people and residential units: (i) residential segregation is computed over a two-dimensional geographical space, whereas information segregation needs to be computed over a -dimensional topic space ( in Figure 2, but in general, ), and (ii) one person may have access to multiple information units, which needs to be accounted for while computing information segregation; whereas, one person is considered to be permanently staying in only one residential unit. To account for people accessing different information units, we use the notion of fractional personhood Perring (1997). For an information unit , we consider the personhood of for everyone who have access to only , personhood of for them who have access to and another information unit, and so on.
In this paper, we propose five measures of information segregation analogous to the residential segregation measures discussed earlier, by considering the fractional personhoods of people from different groups. Then, as a proof of concept, we measure the information segregation of US-based Facebook users as evident from how they follow different news media pages on Facebook. Our investigation reveals that Hispanic users are accessing information more evenly across political spectrum; whereas Asian Americans have highest information segregation among all racial groups. Similarly, we also looked at how users having different political leanings are accessing contrary views. We found that moderately conservative leaning users tend to get information more evenly across the spectrum; whereas, extremely conservative leaning users are most segregated among others.
The information segregation measures proposed in this paper can also be used to evaluate the role of search / recommender systems for exposing different types of information to a large population. We believe that in future, greater emphasis should be put on designing more responsible search / recommender systems which limit information segregation to acceptable limits.
2. Measures of Information Segregation
In this section, we introduce different measures of information segregation, considering the five distinct dimensions as identified by Messey and Denton Massey and Denton (1993) for residential segregation.

I. Evenness
The evenness measure of information segregation captures how uniformly members of a particular group have access to
different units in the -dimensional information space. Figure 3 shows an example scenario where members of Yellow group have access to all four information units; whereas, members of Purple group have access to only two units. Therefore, Yellow group in Figure 3 have more even information access than Purple group.
Massey and Denton Massey and Denton (1993) discussed five different measures of residential evenness (including both relative and absolute measures).
For brevity, we are defining only one measure of absolute evenness of a group, which is the complement of Gini Coefficient Dorfman (1979).
Gini coefficient measures the unevenness of a particular group , by capturing the mean absolute difference between the personhoods of having access to different information units. Then, Information Evenness can be computed as
where is the sum of personhoods belonging to group who get information , is the size of group in the overall population, is the number of information units, and is the number of people in the overall population who do not belong to group . varies between to , higher the value, the group has more even information access.

II. Joint Exposure
Joint exposure quantifies the extent to which members of two groups get jointly exposed to the same information.
In Figure 4, members of Purple and Yellow groups are jointly exposed to three out of four information units; whereas, members of Purple and Pink groups are jointly exposed to only one unit. Therefore, in Figure 4, Purple and Yellow groups have higher joint exposure compared to Purple and Pink groups.
Again using the notion of personhoods, joint information exposure between groups and is computed as
where , , and are as defined earlier, is sum of personhoods belonging to who get information , and is sum of all personhoods having access to information . varies between to , higher the value, and have more common exposure.

III. Concentration
Concentration of a group refers to the relative amount of topical space that have access to.
Every information unit may not have similar topical density (or number of information sources, etc),
with some units having more topics mapping into it, compared to other information units. For example, in Figure 5,
red and blue units consist of higher number of topics than blueish and reddish grey units.
Therefore, even though Yellow and Purple groups have access to same number of units (hence have same evenness), Yellow group
would be considered more concentrated (i.e., more segregated) as it has access to fewer topics.
Information concentration is captured by the metric Delta Hoover (1941):
where , , and are already defined, is number of topics in information unit , and is number of topics overall.
IV. Centralization
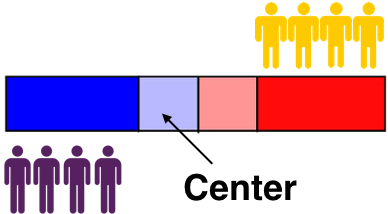
Compared to the geographical context, identifying the center of an information space is tricky, and may not be always possible.
Centrality may be computed by considering centroids in a dimension-reduced topical space,
or by measuring it over networks induced by information units and their topical or preference similarity.
In scenarios where the notion of information center is defined, centralization between two groups and refers to how the information units that and have access to are distributed around the center. For example, in Figure 6, if we assume the blueish grey unit to be the center, then although Yellow and Purple groups have same evenness and concentration measures, Purple group is more centralized than Yellow group.
Formally, Centralization Index Duncan and Duncan (1955) can be measured as
where information units are sorted based on their distance from the center, and , , and are as defined earlier. varies between to , positive value indicating is more centralized than .

V. Clustering
The final dimension of information segregation is the degree to which members of a group have access to information clusters, i.e., whether the different types of information received by are close to each other in the information space.
In Figure 7, both Purple and Yellow groups have access to two information units, and have the same evenness and concentration scores. However, as the information units Purple group have access to are close to each other, according to clustering measure, it is more segregated than Yellow group .
We can formally define information clustering as
where , , , and are as defined earlier, and is the distance between information units and . varies from to .
3. Information Segregation among US-Based Facebook Users
Next, we attempt to quantify information segregation of Facebook users in the US. Towards that end, we specifically focus on news media pages in Facebook, and measure information segregation with respect to how different groups of users follow these pages.
Dataset Gathered
We queried Facebook search with the term ‘US news media’ to collect US related news media pages in Facebook, and found more than Facebook pages for that query.
Then using Facebook’s ad submission web page (facebook.com/ads/manager/creation), we collected the composition of gender, race and political leanings of the followers of these media pages. We acknowledge the limitation that the retrieved pages may not be representative of all US media pages, and we would expand the corpus in future work.
Mapping Facebook Pages to Information Units
To quantify information segregation, we focus on -dimensional political information space, and divide it into five information units: Very Conservative (VC), Conservative (C), Moderate (M), Liberal (L), and Very Liberal (VL). Then, we map different news pages on Facebook to one of these five information units by considering the political leanings of the followers of these pages.
For a page , if the fraction of followers leaning towards respective political ideologies are denoted as , and respectively, then we measure the political leaning of P ()
as a weighted sum of the political leaning of its audience. More specifically,
If is between to , we map to information unit ; for between to , is mapped to and for , we map to . Similarly, we map to or if and respectively.
Computing the Personhood Scores
After mapping every page to one of the information units, we try to gather the cumulative number of followers for a particular unit. However, Facebook doesn’t allow us to get the follower size for a combination of more than Facebook pages. Therefore, we randomly select pages from the set of news media pages, map them to their corresponding units, and gather the demographics of the followers of pages belonging to every information unit.
As some users may follow Facebook pages belonging to multiple units (for example, follow both conservative and liberal leaning pages), we need to accurately account for these overlaps in information access. As mentioned earlier, we use the notion of fractional personhood in this regard. Therefore, instead of considering the number of followers of pages in a particular unit, we consider the sum of personhoods for pages in every information unit.
For every unit , the sum of personhoods is computed as
where is the set of all information units and gives the number of followers of pages in unit(s) .
Information Segregation among Racial Groups
Facebook ad interface returns four racial categories for the users: Caucasian, African American, Asian American, and Hispanic. For every information unit, we compute the personhoods belonging to each race, and then measure information segregation among them.
Figure 8(a) shows the evenness of different racial groups. We can see in Figure 8(a) that Hispanics have most even access to different political information units; whereas, Asian Americans have most uneven access to political information units.
Information Segregation between Political Groups
Similar to the racial categories, we also computed the personhoods w.r.t. different political leanings for every information unit,
and then measure the information segregation among these groups. Figure 8(b) shows that conservative leaning users tend to get information evenly from information units; whereas, very conservative leaning users have most uneven access to different units.
Then to measure how very conservative leaning users have common access to information units with others, we plot their joint exposure with other groups in Figure 8(c). We observe that very conservative leaning users have highest joint exposure with conservatives, denoting that they are exposed to multiple information units together. Whereas, they have least joint exposure with very liberal leaning users, implying that these two groups have access to very different information units.
4. Conclusion
In this position paper, we proposed five measures of information segregation motivated by the residential segregation measures proposed in literature. Then, using these measures, we computed information segregation among US-based Facebook users. Our future work lies in evaluating how search / recommender systems are exposing information to different groups of users, and proposing mechanisms to keep information segregation to acceptable limits.
Acknowledgments: The authors thank the anonymous reviewers whose suggestions helped to improve the paper. A. Chakraborty is a recipient of Google India PhD Fellowship and Prime Minister’s Fellowship Scheme for Doctoral Research, a public-private partnership between Science & Engineering Research Board (SERB), Department of Science & Technology, Government of India and Confederation of Indian Industry (CII).
References
- Agichtein et al. (2008) Eugene Agichtein, Carlos Castillo, Debora Donato, Aristides Gionis, and Gilad Mishne. 2008. Finding high-quality content in social media. In ACM WSDM.
- Aiello et al. (2012) Luca Maria Aiello, Alain Barrat, Rossano Schifanella, Ciro Cattuto, Benjamin Markines, and Filippo Menczer. 2012. Friendship prediction and homophily in social media. ACM TWEB 6, 2 (2012).
- Baldassarri and Gelman (2008) Delia Baldassarri and Andrew Gelman. 2008. Partisans without Constraint: Political Polarization and Trends in American Public Opinion. Sociology (2008).
- Bhattacharya et al. (2014) Parantapa Bhattacharya, Saptarshi Ghosh, Juhi Kulshrestha, Mainack Mondal, Muhammad Bilal Zafar, Niloy Ganguly, and Krishna P Gummadi. 2014. Deep twitter diving: Exploring topical groups in microblogs at scale. In ACM CSCW.
- Chakraborty and Ghosh (2013) Abhijnan Chakraborty and Saptarshi Ghosh. 2013. Clustering hypergraphs for discovery of overlapping communities in folksonomies. In Dynamics On and Of Complex Networks, Vol 2. Springer.
- Chakraborty et al. (2015) Abhijnan Chakraborty, Saptarshi Ghosh, Niloy Ganguly, and Krishna P Gummadi. 2015. Can trending news stories create coverage bias? on the impact of high content churn in online news media. In Computation and Journalism Symposium.
- Chakraborty et al. (2016) Abhijnan Chakraborty, Saptarshi Ghosh, Niloy Ganguly, and Krishna P Gummadi. 2016. Dissemination Biases of Social Media Channels: On the Topical Coverage of Socially Shared News. In AAAI ICWSM.
- Chakraborty et al. (2017) Abhijnan Chakraborty, Johnnatan Messias, Fabricio Benevenuto, Saptarshi Ghosh, Niloy Ganguly, and Krishna P Gummadi. 2017. Who Makes Trends? Understanding Demographic Biases in Crowdsourced Recommendations. In AAAI ICWSM.
- Chakraborty et al. (2016) Abhijnan Chakraborty, Bhargavi Paranjape, Sourya Kakarla, and Niloy Ganguly. 2016. Stop clickbait: Detecting and preventing clickbaits in online news media. In IEEE/ACM ASONAM.
- Colleoni et al. (2014) Elanor Colleoni, Alessandro Rozza, and Adam Arvidsson. 2014. Echo chamber or public sphere? Predicting political orientation and measuring political homophily in Twitter using big data. Journal of Communication (2014).
- Dandekar et al. (2013) Pranav Dandekar, Ashish Goel, and David T Lee. 2013. Biased assimilation, homophily, and the dynamics of polarization. PNAS (2013).
- Dorfman (1979) Robert Dorfman. 1979. A formula for the Gini coefficient. Review of Economics and Statistics (1979).
- Duncan and Duncan (1955) Otis Dudley Duncan and Beverly Duncan. 1955. Residential distribution and occupational stratification. Am. journal of sociology (1955).
- Friedkin and Johnsen (2011) Noah E Friedkin and Eugene C Johnsen. 2011. Social influence network theory: A sociological examination of small group dynamics.
- Hoover (1941) Edgar M Hoover. 1941. Interstate redistribution of population, 1850–1940. Journal of Economic History (1941).
- Maes and Bischofberger (2015) Michael Maes and Lukas Bischofberger. 2015. Will the Personalization of Online Social Networks Foster Opinion Polarization? (2015).
- Maes and Flache (2013) Michael Maes and Andreas Flache. 2013. Differentiation without distancing. Explaining opinion bi-polarization without assuming negative influence. Plos One (2013).
- Mason et al. (2007) Winter A Mason, Frederica R Conrey, and Eliot R Smith. 2007. Situating social influence processes: Dynamic, multidirectional flows of influence within social networks. Personality and social psychology review (2007).
- Massey and Denton (1993) Douglas S Massey and Nancy A Denton. 1993. American apartheid: Segregation and the making of the underclass.
- McPherson et al. (2001) Miller McPherson, Lynn Smith-Lovin, and James M Cook. 2001. Birds of a feather: Homophily in social networks. Annual review of sociology 27, 1 (2001).
- Pariser (2011) Eli Pariser. 2011. The filter bubble: What the Internet is hiding from you.
- Perring (1997) Christian Perring. 1997. Degrees of personhood. Medicine and Philosophy (1997).