Structural Phase Transition, Antiferromagnetism and Two Superconducting Domes in LaFeAsO1-xFx (0 0.75)
Abstract
We report 75As nuclear magnetic resonance (NMR) / nuclear quadrupole resonance (NQR) and transmission electron microscopy (TEM) studies on LaFeAsO1-xFx. There are two superconducting domes in this material. The first one appears at 0.03 0.2 with max = 27 K, and the second one at 0.25 0.75 with max = 30 K. By NMR and TEM, we demonstrate that a -to- structural phase transition (SPT) takes place above both domes, with the transition temperature varying strongly with . In the first dome, the SPT is followed by an antiferromagnetic (AF) transition, but neither AF order nor low-energy spin fluctuations are found in the second dome. In LaFeAsO0.97F0.03, we find that AF order and superconductivity coexist microscopically via 75As nuclear spin-lattice relaxation rate (1/) measurements. In the coexisting region, 1/ decreases at but becomes to be proportional to below 0.6, indicating gapless excitations. Therefore, in contrast to the early reports, the obtained phase diagram for 0.2 is quite similar to the doped BaFe2As2 system. The electrical resistivity in the second dome can be fitted by with = 1 and a maximal coefficient at around = 0.50.55 where extrapolates to zero and is the maximal, which suggest the importance of quantum critical fluctuations associated with the SPT. We have constructed a complete phase diagram of LaFeAsO1-xFx, which provides insight into the relationship between SPT, antiferromagnetism and superconductivity.
I INTRODUCTION
Iron-based superconductors (FeSCs) are a new class of high transition-temperature () family[1], which have attracted great interests in recent years. Vast efforts have been devoted to explore materials with higher [2, 3], and to understand the unconventional superconducting state[4, 5, 6]. Soon after the first breakthrough of the discovery of the so-called ”1111” structure LaFeAsO1-xFx[7], a wide variety of iron pnictides and chalcogenides, such as Fe2As2 (”122”)[8], FeAs (”111”)[9], FeSe (”11”)[10] were discovered successively. Most FeSCs show a tetragonal-orthorhombic structural phase transition (SPT) at followed by an antiferromagnetic (AF) order at . Element substitution or external pressure suppress both and then lead to superconductivity[1]. Since unconventional superconductivity emerges in close proximity to antiferromagnetism, the AF spin fluctuations are naturally proposed to be responsible for the electron pairing[11], as is the situation in heavy fermions[12] and high- cuprates[13]. More recently, the electronic nematicity, a phenomenon of spontaneous rotation-symmetry breaking in the Fe-plane below , has emerged as another hot research topic in FeSCs [14]. Electrical resistivity[15], spin excitation[16, 17] and magnetic torque[18] show large in-plane anisotropy. Such electronic nematicity may stem from the band splittings of the Fe-3 and 3 orbitals[19]. Many intriguing properties arising from nematic fluctuations associated with a quantum critical point (QCP) has been reported[20, 21]. However, the origin of nematic order is still controversial; both spin-[22] and orbital-[23, 24, 25, 26] scenario have been proposed. Thus, antiferromagnetism and electronic nematicity below are two noteworthy characteristics of FeSCs, which hold clues to the underlying of the physics in this new class of materials.
After the AF order is suppressed, spin fluctuations have been reported for different 122 systems[27, 28, 29, 20], and also in LaFeAsO1-xFx with [30]. However, so far the phase diagram for the prototypical FeSC LaFeAsO1-xFx in the underdoped region is still unclear. Early works suggested that and stay constant with increasing doping and vanish abruptly at some doping level, before superconductivity emerges [31, 32]. Also, spatial phase separation of AF and paramagnetic-superconducting domains were reported near the phase boundary [33, 34]. Such phase diagram is quite different from that of other FeSCs, for example, CeFeAsO1-xFx[35], SmFeAsO1-xFx[36] and 122 systems[37, 20, 28, 29], where and decrease with increasing doping. Furthermore, superconductivity coexists microscopically with AF state in 122 systems[20, 38]. It is unclear whether the early-reported properties are due to the poor polycrystalline sample quality or arise from the intrinsic property of LaFeAsO1-xFx.
As for the carrier doping, early studies suggested that the F-content can not exceed 0.2[7, 31, 30]. However, by high-pressure synthesis technique, we recently found that the F-content can go as high as 0.75[39]. In the heavily doped region, we discovered another superconductivity dome centered at = 0.55 with an even higher = 30 K[39]. Surprisingly, we found that a structural phase transition takes place above the new dome[39]. This discovery raised interest on the connection to the SPT in the low doping region, and on the role of the electronic state change below in FeSCs in a broader context.
In this paper, we address the issues of the SPT in the two doping regimes. We also attempt to construct a complete phase diagram of the low doping region, and explore the interplay between antiferromagnetism and superconductivity. By 75As NMR and TEM, we demonstrate that the structural phase transitions taking place in the low-doped and high-doped regimes share similarities. In the low doping region, the suppression of and shows a second-order-like variation towards the first superconducting dome. For = 0.03, a long range AF order at = 58 K with a magnetic moment of 0.011 is found and bulk superconductivity sets in at = 9.5K. The measurement of the spin-lattice relaxation rate (1/) indicates a microscopic coexistence of AF order and superconductivity. Our results show that the phase diagram of LaFeAsO1-xFx in the low-doped regime () is similar to that of the 122 systems. In the second dome, however, neither AF order nor spin fluctuation can be found, but increases with increasing for 0.5. extrapolates to zero at around = 0.50.55, where the electrical resistivity shows a -linear behavior and the coefficient from the fitting shows a maximum. These interesting properties may originate from the quantum fluctuation associated with a nematic order.
This paper is organized as following. The experimental methods are described in Sec. II. In section III.1, the 75As NQR spectra that evidence an AF order are presented. Evidence for a coexistence of AF order and superconductivity are shown in Sec. III.2. Section III.3 discusses the structural phase transitions in the two doping regimes, on the basis of TEM and NMR data. Finally, a possible new type of quantum criticality in the second dome is discussed in section III.4.
II EXPERIMENTAL METHODS
The polycrystalline LaFeAsO1-xFx samples were prepared by the two-step solid state reaction method. Here, indicates the nominal composition of the starting material. In the first step, the precursor LaAs powder was obtained by reacting La pieces (99.5%) and As powders (99.999%) at 500∘C for 12 hours then at 850∘C for 2 hours. In the second step, samples with different fluorine concentrations were sintered under ambient pressure (AP) and high pressure (HP), respectively. We adopted the AP method for samples with = 0.03 - 0.2 [40]. The stoichiometric mixtures of the starting materials LaAs, Fe2O3, Fe, and LaF3 were ground thoroughly and cold-pressed into pellets. The pellets were placed into Ta crucible and sealed in quartz tube. They were then sintered at a temperature of 1150∘C for 50 hours. LaFeAsO1-xFx with = 0.25 - 0.75 were synthesized by the HP method. The starting materials LaAs, Fe, Fe2O3 and FeF2 were mixed together according to the nominal ratio and pressed into pellets. Different from the AP method, the pellets were sealed in boron nitride crucibles and sintered in a six-anvil high-pressure synthesis apparatus under a pressure of 6 GPa at 1250∘C for 2-4 hours. After sintering, the sample was quenched to room temperature by water cooling within a few seconds, and then the pressure was released.
Compared to the solid state reaction under ambient pressure, the high pressure synthesis method have two advantages. Fist, the raw materials are sealed and pressurized in the whole synthesis process, so fluorine element, which is volatile and easily react with silica, can be kept. Second, reaction under high pressure and the rapid quenching process help to keep the meta-stable phase that can not be formed at ambient pressure.
Powder x-ray diffraction (XRD) with Cu K radiation (= 0.154nm) were performed at room temperature to characterize the phase purity and structural parameters. The temperature dependence of resistivity were measured by a standard four-probe method. The value of was determined by both dc susceptibility using a superconducting quantum interference device (Quantum Design) and ac susceptibility using an - coil. 75As NMR/NQR measurements were carried out by using a phase-coherent spectrometer. The NMR spectra were obtained by scanning the frequency and integrating the spin echo at a fixed magnetic field . The NQR spectra were also taken by changing the frequency point by point. The spin-lattice relaxation time was measured by using the saturation-recovery method. The recovery curve of 75As ( = 3/2) NQR is well fitted by a single exponential function , where and are the nuclear magnetization in the thermal equilibrium and at a time after the saturating pulse, respectively [41].
Specimens for TEM were prepared by crushing the bulk material into fine fragments which were then supported by a copper grid coated with a thin carbon film. A JEOL 2100F TEM, equipped with cooling (below = 300 K) or heating sample holders (above = 300 K), was used for investigating the structural properties of the samples.
III Results
III.1 Magnetic order in the low doping region

We first present the results for AF order in the low doping region revealed by 75As NQR. The 75As NQR spectra for AP and HP samples are shown in Fig. 1(a),(b), respectively. A clear single peak, which can be fitted by a single Lorentzian function, was observed for 0.06. Theoretically, 75As NQR has only one peak corresponding to the transition, and the NQR frequency probes the electric field gradient (EFG) generated by the carrier distribution and the lattice contribution surrounding the target nucleus. Thus the well-resolved NQR spectra indicate that the carrier doping distribution and the lattice surroundings at As site are uniform for 0.06. In contrast, two peaks were observed for = 0.03 and 0.04, which means that there exist two As sites with different EFG surroundings. This may due to the local arrangement of the F ion in the underdoped samples. Similar 75As NQR spectra of two peaks in underdoped LaFeAsO1-xFx were also reported by other groups[42]. In what follow, we denote the lower (higher) frequency peak with ”Low” (”High”).

The obtained doping dependence of the 75As NQR frequency is shown in Fig. 2 (a). increases almost linearly with increasing the nominal content. This result together with the fact that the lattice constant obtained by XRD also changes continuously as increases[43] ensure that the carrier content does increase with increasing . The full width at half maximum (FWHM) of the 75As NQR spectra are shown in Fig. 2 (b). Since the distribution of the F-content will result in a broadening of the NQR spectrum, it is reasonable that the FWHM increases with increasing for AP samples. The FWHM of the HP samples is almost independent and comparable to that of = 0.1 grown at ambient pressure, which indicates that high-pressure synthesis does not bring about additional F-content distribution.

Figure 3 shows the temperature dependence of the 75As NQR spectra for = 0.03. It is obvious that the spectra are broadened at low temperatures. Figure 4(a) and (b) show the temperature dependence of the FWHM for Low and High peaks obtained by a two-Lorentian fitting. For both of Low and High peaks, FWHM increases below 58 K. In the following, we elaborate that the broadening of NQR spectrum is due to an AF order. The nuclear spin Hamiltonian which derives from the nuclear quadrupole interaction is given by[44]
| (1) |
where is the electric quadrupole moment, is the EFG tensor, and is the asymmetry parameter of the EFG. For 75As nucleus ( = 3/2 ), the 1/2 2/3 transition gives rise to a peak at . When an AF order occurs and an internal magnetic field sets in, the Hamiltonian will be perturbed by the Zeeman interaction. The perturbative Hamiltonian is given by , where is the gyromagnetic ratio and is the internal magnetic field, respectively. Since the direction of at As-site is parallel to the axis in LaFeAsO1-xFx[45], the perturbation can be written as . This perturbation removes the degeneracy of energy levels and the single 75As NQR peak will split into three peaks, corresponding to -3/2 -1/2, -1/2 1/2, and 1/2 3/2 transitions. In particular, -3/2 -1/2 and 1/2 3/2 transitions locate at and , respectively. For our case in = 0.03, the NQR spectra do not split completely due to a small ; the two transitions overlap, resulting in a broad peak. As shown shown in Fig. 2 (b), the FWHM increases rapidly below .

To estimate the value of the internal magnetic field at As site, we performed a simple simulation. Since FWHM of both Low and High increases below = 58 K, we assumed that different size of the internal magnetic field is produced at Low and High sites. For each As site, we have reproduced the spectra using two Lorentzians. Figure 3 shows the spectra below with the simulations. Figure 4 (c) shows the temperature dependence of and obtained by this simulation. Since the internal fields of Low and High have nearly the same values and temperature-variation trend, the AF order occurs homogeneously in the = 0.03 sample. The appearance of two peaks may be understood as NQR being sensitive to the local dopant arrangement. Similar results of multiple NQR peaks with identical were also observed in heavy-fermion CeRh1-xIrxIn5 [46].
Furthermore, we have estimated the magnetic moment of ordered Fe atom by using (75As)=, where the Hyperfine coupling constant =25 kOe/ is taken from other NMR measurement[47]. The obtained magnetic moment saturates at low temperatures with 0.011 , which is much smaller than that of parent compound of 0.36 obtained from neutron scattering[48]. As increasing the electron doping, the Fe magnetic moments are suppressed significantly. The broadening of NQR spectrum is not observed for 0.04, which indicates that the AF order vanishes between = 0.03 and 0.04.
III.2 Coexistence of the AF order and superconductivity

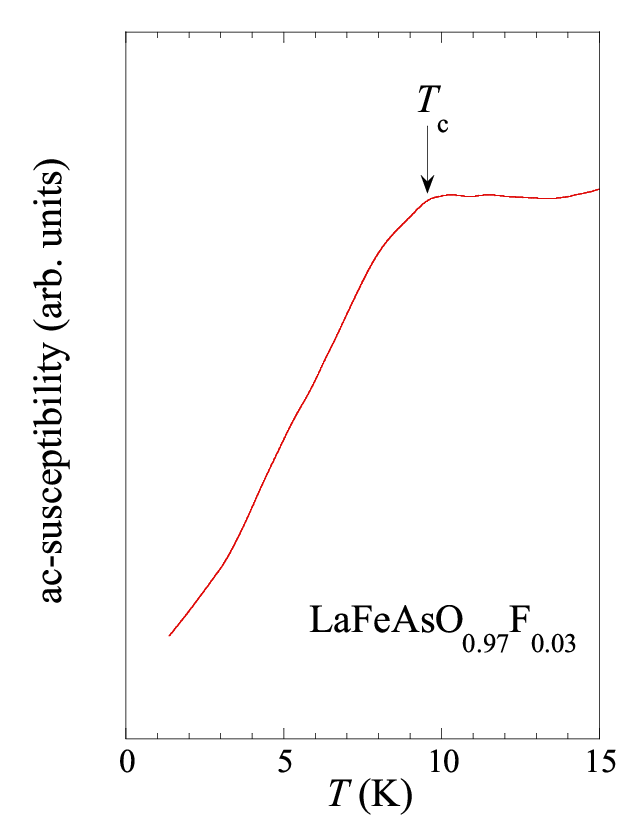
The interrelation between antiferromagnetism and superconductivity is one of the most intriguing issues. In this section, we present the experimental evidence for the microscopic coexistence of the AF order and superconductivity. We measured the spin-lattice relaxation rate (1/) at Low ( = 9.5 MHz) and High ( = 10.3 MHz) for = 0.03. The nuclear magnetization recovery curves of both Low and High peaks are of single component. Figure 5 shows the temperature dependence of . For both Low and High, forms a peak at = 58 K due to a critical slowing down of the magnetic moment. As the temperature is reduced, decreases steeply at = 9.5 K. The AC susceptibility measured by - NQR coil shows that diamagnetism shows up below this temperature ( = 9.5 K), thus the sharp decrease in is due to the opening of a superconducting gap (Fig. 6). The results of NQR spectra and 1/ indicate that superconductivity coexists microscopically with AF order in LaFeAsO0.97F0.03.

Compared to the parent compound LaFeAsO, for = 0.03 is suppressed greatly. Our results of NQR spectra suggest that the AF order vanishes between = 0.03 and 0.04. These features were not seen at all in the previous works[31, 32], which report that only decreases slightly by F doping and vanishes abruptly at some doping level. For = 0.03 in our case, the small moment = 0.011 is probably a factor in favor of the coexistence of antiferromagnetism and superconductivity.
The evolution of with doping level suggests that, with doping, the system is approaching a magnetic instability between = 0.03 and 0.04. According to the theory of weakly antiferromagnetically-correlated metal, is proportional to the staggered magnetic susceptibility and follows a Curie-Weiss law[49], . Here, the first term is the contribution from the density of states at the Fermi level, and the second term describes the contribution from the antiferromagnetic wave vector . The data can be well fitted by this theory [30]. The parameter approaches to 0 K between = 0.03 and 0.04, which means that the diverges at = 0 K there. These facts suggest the existence of a magnetic QCP between = 0.03 and 0.04. The obtained phase diagram at low-doped regime is shown in Fig. 7. It shares many similarities with the 122 system.
Next, we turn to the superconducting state in the coexistence region. Below , for = 0.03 decreases, but becomes almost proportional to below 5.7 K. This is in contrast to the = 0.06 sample with the highest [30] or the optimally-doped Ba1-xKxFe2As2 [28], where below decreases exponentially. The behavior below seen in = 0.03 sample can not be ascribed to impurity scattering, since the line width of NQR spectrum for = 0.03 is smaller than that for = 0.06. Similar -linear behavior of 1/ was also observed in underdoped Ba0.77K0.23Fe2As2[38] and Ca1-xLaxFeAs2[50], where superconductivity coexists with AF order. The gapless state in the coexistence region deserves further study. One possibility is that it arises from the excitations of an exotic pairing state with mixed spin-triplet component due to the coexisting magnetism [51].
III.3 Structural phase transition
In the parent compound LaFeAsO, a structural phase transition takes place above [48], but the evolution of with F content is unclear in the low-doped regime. In the high doping regime of 0.2, we found that a structural phase transition also occurs, with intersecting the new superconducting dome. In this section, we compare the structural phase transition in the two doping regimes.
First, we directly confirmed the structural phase transition by TEM images. Figure 8(a)(b) show the [001] zone-axis electron diffraction patterns for LaFeAsO0.96F0.04 taken at = 300 K and = 100 K. At room temperature, only (110) spots can be seen, which indicates that the crystal structure is tetragonal with the space group of 4/. At = 100 K, additional spots appear at (100) positions, which means the crystal symmetry is lowered. These features are similar with the TEM results of the HP LaFeAsO1-xFx[39]. Figure 8(c)(d) present an example for = 0.6. At = 300 K the (100) spots already exist, indicating a broken symmetry. Upon heating from room temperature, the (100) spots disappeared at = 380 K. Therefore = 380 K was identified for this composition. From the point of view of TEM, structural phase transition is similar between AP and HP samples.


Next, we present the results for structural phase transition seen by 75As NMR. Figure 9 (a) shows the 75As NMR spectra for AP samples with 0.03 0.15 measured at = 230K. For 75As NMR, the total nuclear spin Hamiltonian is given by [44]
| (2) |
where the first term is from the Zeeman interaction with being the Knight shift, and the second term represents the interaction of the nuclear quadrupole moment with EFG tensor. In the high-field limit, the quadrupolar term can be treated as a perturbation. The principle axes (, , ) of the EFG are determined by the local symmetry in the unit cell. is the angle between the applied field and the axis. In the case of random powder samples with a uniform distribution of , the central transition (= -1/2 1/2) of 75As NMR will show a characteristic shape called ”powder pattern”. It can be seen from Fig. 9 (a) that all samples show a two-horns shape, as expected for a powder pattern, where the lower frequency horn and higher frequency horn correspond to = 41.8∘ and 90∘, respectively. For LaFeAsO1-xFx, the principle axes , , of the EFG coincide with the crystal -, -, -axis [52], so the 90∘ peak corresponds to the NMR component with // plane.


Figure 9 (b) and (c) enlarge the = 90∘ peak for = 0.03 and 0.04, respectively. The spectra of both = 0.03 and 0.04 are broadened gradually as the temperature is lowered. To see this in more datail, we plot the temperature dependence of FWHM of the 90∘ peak for = 0.03 and 0.04 in Fig. 10(a), which are obtained by Gaussian fittings to the spectra. The FWHM of = 0.03 shows an anomaly at 135 K, followed by a steeper increase below 58 K where an AF order sets in. For = 0.04, the FWHM keeps constant at high temperatures but increases below 100 K. By contrast, the FWHM is temperature independent from 30 K to 230 K for 0.06 0.15, as shown in Fig. 10(b).
Below we illustrate that = 135 K for = 0.03 and = 100 K for = 0.04 correspond to a structural phase transition temperature . For single crystal LaFeAsO, 75As NMR spectrum with // ab plane shows a single peak above and this peak splits into two corresponding to // axis and // axis below [52]. This is because orthorhombic distortion breaks the fourfold () rotation symmetry of the EFG and the second order effect of the nuclear quadrupolar interaction in // axis differ from that in // axis. Since the difference of the second order effects was smaller, in pollycrystalline samples we observed only the increase of FWHM below , rather than the split of the spectrum.
For , we have found a structural phase transition by measuring the asymmetry of the EFG in the previous work[39]. Here we show that, for HP samples, the FWHM of NMR spectra recognized the structural phase transition as well. Figure 11 shows the = 90∘ peak at some typical temperatures for = 0.55. The spectra become broad with decreasing temperature. Figure 10(c) exhibits the temperature dependence of the FWHM of 90∘ peak for HP samples obtained by Gaussian fittings to the spectra. For = 0.3-0.5, FWHM are temperature independent. For = 0.55, FWHM shows an abrupt change at around = 250 K, which corresponds to the structural phase transition temperature as the case of = 0.03 and 0.04. It is worth noting that we find no sign of AF order from NMR spectra for HP LaFeAsO1-xFx samples.

The , and for the entire range are summarized in the phase diagram shown in Fig. 12. The forms two superconducting domes peaked at = 0.06 with = 27 K and =0.50.55 with = 30 K, respectively. Above , the TEM images together with the NMR spectra, evidence that a symmetry-breaking structural phase transition takes place above both domes, with varying strongly with . In the first dome, the suppression of and shows a second-order-like variation towards superconducting dome, while intersects the second dome. This is the first report showing that the phase diagram of LaFeAsO1-xFx at low doping region is actually similar to that of 122 FeSCs.
III.4 Possible new type of quantum criticality in the second dome

In this section, we discuss possible new type of quantum criticality in the high-doped region on the basis of resistivity measurement. The previous works reported that the parent compound LaFeAsO and the underdoped samples show a kink in electrical resistivity due to structural or magnetic transitions[48, 53]. In addition, obeys variation in the first dome for 0.2 [54, 55]. The temperature dependence of for the second dome (0.3 0.75) are presented in Fig.13(a). For all samples, no anomaly is observed over the temperature range from to 300 K, which implies that AF order is absent in the second dome, being consistent with the NMR/NQR spectra. We fitted the normal state resistivity to and obtained the residual resistivity , the coefficient and the exponent . Figure 13(c)(d) show the fittings over the temperature range shown.


In contrast to the first dome, of the second dome shows a non-Fermi liquid (NFL) behavior with . In particular, shows a -linear behavior with = 1 at = 0.55. To compare the variation of more intuitively, we plot versus in logarithmic coordinates, as shown in Fig.13(b). The evolution of , and with F content are presented in Fig.14. The value of HP samples is comparable to that of AP samples[53]. Since is a measure of the disorder degree, the results indicate that the quality of HP samples is close to that of the AP samples.
At the optimal doping level = 0.50.55 where is maximal and = 1 is observed, the coefficient also shows maximum. is proportional to , where is the effective electron mass. These features are often considered as the signature of a magnetic QCP[56]. However, the second dome is far away from an AF order and no low-energy spin fluctuations can be found. Figure 15 shows the 75As for AP and HP LaFeAsO1-xFx. In the low doping regime close to the AF ordered phase, increases rapidly with decreasing temperature (Fig. 15 (a)), while such increase is absent in the second dome (Fig. 15 (b)). The results indicate the presence of strong AF spin fluctuations in the first dome, whereas neither AF order nor low-energy spin fluctuation can be found in the second dome. Considering the fact that extrapolates to zero at , it is more likely that the -linear behavior of the resistivity arises from quantum criticality associated with the structural phase transition. It has been found that below electronic nematicity appears[15, 16, 17, 18, 19]. Theoretically, it was also shown that electronic nematic QCP can lead to NFL behavior[57].
In fact, a two-superconducting-dome phase diagram has also been found in LaFeAsO1-xHx[58], K1-xFe2-ySe2[59] and LaFeAs1-xPxO[60], and more recently, also in K-doped FeSe thin films[61]. However, our system is quite different from others. The two domes in LaFeAsO1-xHx, LaFeAs1-xPxO and K1-xFe2-ySe2 are all closely adjacent to a magnetic ordered state[60, 58, 62], while in the higher- superconducting dome of K-doped FeSe thin film neither magnetism nor structural phase transition is present[61]. Thus the present system offers a unique opportunity to study the quantum criticality due to AF order and possibly electronic nematic order simultaneously.
IV conclusion
In conclusion, we have performed measurements on LaFeAsO1-xFx ( = 0.03-0.75) by NMR and TEM. We demonstrated that a similar -symmetry-breaking structural phase transition takes place in the two doping regimes where two superconducting domes are formed. In the low-doping regime of 0.2, and are well separated, and both show a second-order-like suppression with increasing doping level. For the = 0.03 sample, we find that 75As nuclear spin-lattice relaxation rate 1/ shows a clear peak at = 58 K due to a critical slowing down of the magnetic moment and then a further decrease below = 9.5 K, which indicates that AF order and superconductivity coexist microscopically. Furthermore, 1/ below 0.6 decreases in proportion to , indicating gapless excitations in the coexisting state. In the second dome, by contrast, there is neither AF order nor low-energy spin fluctuations. The extrapolates to zero at around = 0.50.55, where is the maximal. The -linear behavior of electrical resistivity and the maximum of coefficient seen at points to a new type of quantum criticality which may provide a new route to high temperature superconductivity.
ACKNOWLEDGMENTS
We thank Z. X. Zhao for useful communication and S. Kawasaki for help in some of the measurements. This work was supported by the National Key RD Program of China (No. 2017YFA0302904), the National Natural Science Foundation of China (No. 11674377, No. 11634015), and the Chinese Academy of Sciences (No. XDB07020200). Work in Okayama was supported by research grants from JSPS (No. 16H0401618).
References
- [1] G. R. Stewart, Rev. Mod. Phys. 83, 1589 (2011).
- [2] Z. A. Ren, W. Lu, J. Yang, W. Yi, X. L. Shen, Z. C. Li, G. C. Che, X. L. Dong, L. L. Sun, F. Zhou, and Z. X. Zhao, Chin. Phys. Lett. 25, 2215 (2008).
- [3] Q. Y. Wang, Z. Li, W. H. Zhang, Z. C. Zhang, J. S. Zhang, W. Li, H. Ding, Y. B. Ou, P. Deng, K. Chang, J. Wen, C. L. Song, K. He, J. F. Jia, S. H. Ji, Y. Y. Wang, L. L. Wang, X. Chen, X. C. Ma, Q. K. Xue, Chin. Phys. Lett. 29, 037402 (2012).
- [4] L. Boeri, O. V. Dolgov, and A. A. Golubov, Phys. Rev. Lett. 101, 026403 (2008).
- [5] I. I. Mazin, D. J. Singh, M. D. Johannes, and M. H. Du, Phys. Rev. Lett. 101, 057003 (2008).
- [6] K. Kuroki, S. Onari, R. Arita, H. Usui, Y. Tanaka, H. Kontani, and H. Aoki, Phys. Rev. Lett. 101, 087004 (2008).
- [7] Y. Kamihara, T. Watanabe, M. Hirano, and H. Hosono, J. Am. Chem. Soc. 130, 3296 (2008).
- [8] M. Rotter, M. Tegel and D. Johrendt, Phys. Rev. Lett. 101, 107006 (2008).
- [9] X. C. Wang, Q. Q. Liu, Y. X. Lv, W. B. Gao, L. X. Yang, R. C. Yu, F. Y. Li, and C. Q. Jin, Solid State Commun. 148, 538 (2008).
- [10] F.-C. Hsu, J.-Y. Luo, K.-W. Yeh, T.-K. Chen, T.-W. Huang, P. M. Wu, Y.-C. Lee, Y.-L. Huang, Y.-Y. Chu, D.-C. Yan, and M.-K. Wu, Proc. Natl. Acad. Sci. 105, 14262 (2008).
- [11] J. C. S. Davis and D. H. Lee, Proc. Natl. Acad. Sci. USA 110, 17623 (2013).
- [12] N. D. Mathur, F. M. Grosche, S. R. Julian, I. R. Walker, D.M. Freye, R. K. W. Haselwimmer, G. G. Lonzarich, Nature 394, 39 (1998).
- [13] P. A. Lee, N. Nagaosa, and X. G. Wen, Rev. Mod. Phys. 78, 17 (2006).
- [14] R. M. Fernandes, A. V. Chubukov, and J. Schmalian, Nat. Phys. 10, 97 (2014).
- [15] J.-H. Chu, J. G. Analytis, K. De Greve, P. L McMahon, Z. Islam, Y. Yamamoto, and I. R. Fisher, Science 329, 824 (2010).
- [16] X. Y. Lu, J. T. Park, R. Zhang, H. Q. Luo, A. H. Nevidomskyy, Q. M. Si, and P. C. Dai,Science 345, 657 (2014).
- [17] R. Zhou, L. Y. Xing, X. C. Wang, C. Q. Jin, and Guo-qing Zheng, Phy. Rev. B 93, 060502(R) (2016).
- [18] S. Kasahara, H. J. Shi, K. Hashimoto, S. Tonegawa, Y. Mizukami, T. Shibauchi, K. Sugimoto, T. Fukuda, T. Terashima, A. H. Nevidomskyy, and Y. Matsuda, Nature (London) 486, 382 (2012).
- [19] M. Yi, D. H. Lu, J.-H. Chu, J. G. Analytis, A. P. Sorinia, A. F. Kemper, B. Moritz, S.-K. Mod, R. G. Moore, M. Hashimoto, W.-S. Lee, Z. Hussain, T. P. Devereaux, I. R. Fisher, and Z.-X. Shen, Proc. Natl. Acad. Sci. USA 108, 6878 (2011).
- [20] R. Zhou, Z. Li, J. Yang, D.L. Sun, C.T. Lin, and G.-q. Zheng, Nat. Commun. 4, 2265 (2013).
- [21] H.-H. Kuo, J.-H. Chu, J. C. Palmstrom, S. A. Kivelson, and I. R. Fisher, Science 352, 958 (2016).
- [22] R. M. Fernandes, A. E. Bohmer, C. Meingast, and J. Schmalian, Phys. Rev. Lett. 111, 137001 (2013).
- [23] S. Onari and H.Kontani, Phys. Rev. Lett. 109, 137001 (2012).
- [24] C.-C. Chen, J. Maciejko, A. P. Sorini, B. Moritz, R. R. P. Singh, and T. P. Devereaux, Phys. Rev. B 82, 100504 (2010).
- [25] C. C. Lee, W. G. Yin, and W. Ku, Phys. Rev. Lett. 103, 267001 (2009).
- [26] W. C. Lv, J. S. Wu, and P. Phillips, Phys. Rev. B 80, 224506 (2009).
- [27] F. L. Ning, K. Ahilan, T. Imai, A. S. Sefat, M. A. McGuire, B. C. Sales, D. Mandrus, P. Cheng, B. Shen, and H.-H Wen, Phys. Rev. Lett. 104, 037001 (2010).
- [28] Z. Li, D. L. Sun, C. T. Lin, Y. H. Su, J. P. Hu, and Guo-qing Zheng, Phys. Rev. B 83, 140506(R) (2011)
- [29] Y. Nakai, T. Iye, S. Kitagawa, K. Ishida, H. Ikeda, S. Kasahara, H. Shishido, T. Shibauchi, Y. Matsuda, and T. Terashima, Phys. Rev. Lett. 105, 107003 (2010).
- [30] T. Oka, Z. Li, S. Kawasaki, G. F. Chen, N. L. Wang, and Guo-qing Zheng, Phys. Rev. Lett. 108, 047001 (2012).
- [31] H. Luetkens, H.-H. Klauss, M. Kraken, F. J. Litterst, T. Dellmann, R. Klingeler, C. Hess, R. Khasanov, A. Amato, C. Baines, M. Kosmala, O. J. Schumann, M. Braden, J. Hamann-Borrero, N. Leps, A. Kondrat, G. Behr, J.Werner and B. Büchner, Nat. Mater. 8, 305 (2009).
- [32] Q. Huang, J. Zhao, J. W. Lynn, G. F. Chen, J. L. Luo, N. L. Wang, and P. C. Dai, Phys. Rev. B 78, 054529 (2008).
- [33] N. Fujiwara, T.Nakano, Y. Kamihara, H. Hosono, Phys. Rev. B 85, 094501 (2012).
- [34] M. Hiraishi, R. Kadono, M. Miyazaki, I. Yamauchi, A. Koda, K. M. Kojima, M. Ishikado, S. Wakimoto, and S. Shamoto, J. Phys. Soc. Jpn. 83, 103707 (2014).
- [35] J. Zhao, Q. Huang, C. de la Cruz, S. Li, J. W. Lynn, Y. Chen, M. A. Green, G. F. Chen, G. Li, Z. Li, J. L. Luo, N. L. Wang, and P. C. Dai, Nat. Mater. 7, 953 (2008).
- [36] A. J. Drew, Ch. Niedermayer, P. J. Baker, F. L. Pratt, S. J. Blundell, T. Lancaster, R. H. Liu, G.Wu, X. H. Chen, I.Watanabe, V. K. Malik, A. Dubroka, M. Rossle, K.W. Kim, C. Baines, and C. Bernhard, Nat. Mater. 8, 310 (2009).
- [37] K. Hashimoto, K. Cho, T. Shibauchi, S. Kasahara, Y. Mizukami, R. Katsumata, Y. Tsuruhara, T. Terashima, H. Ikeda, M.A. Tanatar, H. Kitano, N. Salovich, R.W. Giannetta, P. Walmsley, A. Carrington, R. Prozorov, and Y. Matsuda, Science 336, 1554 (2012).
- [38] Z. Li, R. Zhou, D. L. Sun, J. Yang, C. T. Lin, and G.-q. Zheng, Phys. Rev. B 86, 180501(R) (2012).
- [39] J. Yang, R. Zhou, L. L. Wei, H. X. Yang, J. Q. Li, Z. X. Zhao, and G.-q. Zheng, Chin. Phys. Lett. 32, 107401 (2015).
- [40] G. F. Chen, Z. Li, G. Li, J. Zhou, D. Wu, J. Dong, W. Z. Hu, P. Zheng, Z. J. Chen, H. Q. Yuan, J. Singleton, J. L. Luo, and N. L. Wang, Phys. Rev. Lett. 101, 057007 (2008).
- [41] A. Narath, Phys. Rev. 162, 320 (1967).
- [42] G. Lang, H.-J. Grafe, D. Paar, F. Hammerath, K. Manthey, G. Behr, J. Werner, and B. Büchner, Phys. Rev. Lett. 104, 097001 (2010).
- [43] J. Yang and G.-q. Zheng, Hyperfine Interact. 237, 141 (2016).
- [44] A. Abragam, The Principles of Nuclear Magnetism, Oxford University Press, London, 1961.
- [45] S. Kitagawa, Y. Nakai, T. Iye, K. Ishida, Y. Kamihara, M. Hirano, H. Hosono, Phys. Rev. B 81 (2010).
- [46] G.-q. Zheng, N. Yamaguchi, H. Kan, Y. Kitaoka, J. L. Sarrao, P. G. Pagliuso, N. O. Moreno, and J. D. Thompson, Phys. Rev. B 70, 014511 (2004).
- [47] H. J. Grafe, D. Paar, G. Lang, N. J. Curro, G. Behr, J. Werner, J. Hamann-Borrero, C. Hess, N. Leps, R. Klingeler, and B. Büchner, Phys. Rev. Lett. 101, 047003 (2008).
- [48] C. de la Cruz, Q. Huang, J. W. Lynn, J. Li, W. Ratcliff II, J. L. Zarestky, H. A. Mook, G. F. Chen, J. L. Luo, N. L. Wang, and P. C. Dai, Nature. 453, 889 (2008).
- [49] T. Moriya, Spin fluctuations in itinerant magnetism, Springer, 1985, Berlin.
- [50] S. Kawasaki, T. Mabuchi, S. Maeda, T. Adachi, T. Mizukami, K. Kudo, M. Nohara, and Guo-qing Zheng, Phys. Rev. B 92, 180508(R) (2015).
- [51] A. Hinojosa, R. M. Fernandes, and A. V. Chubukov, Phys. Rev. Lett. 113, 167001 (2014).
- [52] M. Fu, D. A. Torchetti, T. Imai1, F. L. Ning, J.-Q. Yan, and A. S. Sefat, Phys. Rev. Lett. 109, 247001 (2012).
- [53] J. Dong, H. J. Zhang, G. Xu, Z. Li, G. Li, W. Z. Hu, D. Wu, G. F. Chen, X. Dai, J. L. Luo, Z. Fang and N. L. Wang, Europhys. Lett. 83, 27006 (2008).
- [54] Y. Nakai, S. Kitagawa, K. Ishida, Y. Kamihara, M. Hirano, and H. Hosono, New J. Phys. 11 045004 (2009).
- [55] C. Hess, A. Kondrat, A. Narduzzo, J. E. Hamann-Borrero, R. Klingeler, J. Werner, G. Behr and B. Buchner, Europhys. Lett. 87, 17005 (2009).
- [56] T. Moriya, J. Magn. Magn. Mater. 100, 261 (1991).
- [57] S. Lederer, Y. Schattner, E. Berg, and S. A. Kivelson, Proc. Natl. Acad. Sci. USA 114, 4905 (2017).
- [58] M. Hiraishi, S. Iimura, K.M. Kojima, J. Yamaura, H. Hiraka, K. Ikeda, P. Miao, Y. Ishikawa, S. Torii, M. Miyazaki, I. Yamauchi, A. Koda, K. Ishii, M. Yoshida, J. Mizuki, R. Kadono, R. Kumai, T. Kamiyama, T. Otomo, Y. Murakami, S. Matsuishi, and H. Hosono, Nat Phys 10, 300 (2014).
- [59] L. L. Sun, X. J. Chen, J. Guo, P. W. Gao, Q. Z. Huang, H. D. Wang, M. H. Fang, X. L. Chen, G. F. Chen, Q. Wu, C. Zhang, D. C. Gu, X. L. Dong, L. Wang, K. Yang, A. G. Li, X. Dai, H. K. Mao, and Z. X. Zhao, Nature 483, 67 (2012)
- [60] H. Mukuda, F Engetsu, T Shiota, K T Lai, M Yashima, Y Kitaoka, S Miyasaka, and S Tajima, J. Phys. Soc. Jpn. 83, 083702 (2014)
- [61] C. L. Song, H. M. Zhang, Y. Zhong, X. P. Hu, S. H. Ji, L. L. Wang, K. He, X. C. Ma, and Q. K. Xue, Phys. Rev. Lett. 116, 157001 (2016).
- [62] J. Guo, X. J. Chen, J. Dai, C. Zhang, J. Guo, X. Chen, Q. Wu, D. Gu, P. Gao, L. Yang, K. Yang, X. Dai, H.-k. Mao, L. L. Sun, and Z. Z. Zhao, Phys. Rev. Lett. 108, 197001 (2012).