Observations of the GRB afterglow ATLAS17aeu and its possible association with GW170104Facilities: ATLAS, PS1, Gemini-GMOS, Keck-DEIMOS
Abstract
We report the discovery and multi-wavelength data analysis of the peculiar optical transient, ATLAS17aeu. This transient was identified in the skymap of the LIGO gravitational wave event GW170104 by our ATLAS and Pan-STARRS coverage. ATLAS17aeu was discovered 23.1hrs after GW170104 and rapidly faded over the next 3 nights, with a spectrum revealing a blue featureless continuum. The transient was also detected as a fading x-ray source by Swift and in the radio at 6 and 15 GHz. A gamma ray burst GRB170105A was detected by 3 satellites 19.04 hrs after GW170104 and 4.10 hrs before our first optical detection. We analyse the multi-wavelength fluxes in the context of the known GRB population and discuss the observed sky rates of GRBs and their afterglows. We find it statistically likely that ATLAS17aeu is an afterglow associated with GRB170105A, with a chance coincidence ruled out at the 99% confidence or 2.6. A long, soft GRB within a redshift range of would be consistent with all the observed multi-wavelength data. The Poisson probability of a chance occurrence of GW170104 and ATLAS17aeu is . This is the probability of a chance coincidence in 2D sky location and in time. These observations indicate that ATLAS17aeu is plausibly a normal GRB afterglow at significantly higher redshift than the distance constraint for GW170104 and therefore a chance coincidence. However if a redshift of the faint host were to place it within the GW170104 distance range, then physical association with GW170104 should be considered.
Keywords:
gravitational waves, stars: black holes, gamma-ray burst: general, gamma-ray burst: individual: GRB170105AI Introduction
The Advanced LIGO experiment began detecting gravitational waves from the merging of black hole (BH) binary systems in 2015 [2] . In addition to being the first direct detection of gravitational waves, these first three detections showed that remarkably high stellar mass BHs exist, with the highest mass system (GW150914) resulting from the coalescence of a 36 M⊙ and 29 M⊙ system. As of yet, no probable electromagnetic counterparts to these events have been found. However the Fermi Gamma-ray Burst Monitor (GBM) detected a weak, hard x-ray transient temporally coincident with GW150914 [12], but this has not been confirmed to be physically associated and its astrophysical nature has been disputed [21].
The second science run of the Advanced LIGO experiment (designated O2) started MJD=57722 (2016-11-30) with a short holiday break between MJD=57744 and MJD=57756. Shortly after the break, the internal system distributed the alert of a candidate gravitational wave (GW) transient, designated as event G268556 at 2017-01-04 10:11:58.599 UTC or MJD = 57757.42498378. It was later given the name GW170104 after the offline analysis provided very strong confirmation of its astrophysical origin [3, as presented in]. The 90% probability area of the associated GW skymap is 2000 square degrees or 5% of the sky. Throughout this paper we use the LALInference sky map released on 2017 May 02 by LIGO i.e. LALInference_f.fits [46]. The estimated binary black hole masses are M⊙ and M⊙ at a luminosity distance of Mpc corresponding to a redshift of [3].
As with previous LIGO events, many teams with electromagnetic follow-up facilities observed the corresponding sky map of this event [1, e.g. for a summary of the GW150914 effort see]. Here we introduce the Asteroid Terrestrial-impact Last Alert System [45, ATLAS;], a full-time near Earth asteroid survey, and describe its early observations of GW170104 in combination with our established Pan-STARRS follow-up program [11, 37, 36] During the course of our coordinated ATLAS and Pan-STARRS observations, we identified a bright optical transient, ATLAS17aeu, discovered 23.1hrs after GW170104 and observed to be rapidly fading over 2 hrs. We discuss the nature of this optical transient and its relation to both the gravitational wave source GW170104 and the gamma ray burst GRB170105A detected by several gamma-ray satellite missions. Throughout this paper, we use the same cosmological parameters adopted by LIGO of .
II Discovery of ATLAS17aeu and follow-up optical observations

The ATLAS system11 1 fallingstar.com currently consists of two 0.5-meter f/2 wide-field telescopes [45], of which only the Haleakala unit was in operation at the time of these observations. The ATLAS sensor is a single thermoelectrically-cooled STA1600 detector with 1.86 arcsecond per pixel platescale (10.56k10.56k pixels) giving a 29.2 square degree field of view. As stated above, GW170104 was detected on MJD = 57757.42498378 [3] and the notification was sent to partners at 57757.70134 (6.6 hrs later). Prior to the alert being released, and coincident with the GW detection time, ATLAS was observing a declination strip between , cutting through the skymap (Fig.1) at this time, with the first pointing post-detection that encroached on the non-zero probability region taken at MJD=57757.44622 (0.5 hrs after the GW detection). One transient was found in the strip during this Hawaiian night of serendipitous survey operations (ATLAS17ace), but it is a known CV candidate with observed activity in CRTS and Pan-STARRS1 going back to 2014 (the object is CSS140914-075541+264619, PS1-14amh). When the LIGO GW event alert was processed and night subsequently fell in Hawaii, the ATLAS telescope began targeting the fields identified by the GW170104 skymap (Figure 1), using the same cadence as normally employed for asteroid discovery and identification. These observations began at 57758.29696 or 20.9 hrs after the signal detection. The tiling started at the bottom of the banana shaped skymap at RA=108.79, DEC= and continued north-eastward toward the top of the banana, finishing at 57758.46645 (25.0 hrs after the signal detection) at sky position RA=170.55, DEC=72.314. Had there been no 6.6 hr notification delay, ATLAS could have been observing within minutes of the LIGO detection as the event was well placed for Hawaiian night time observing. During this first night of dedicated observing, ATLAS covered about 42.6% of the enclosed probability corresponding to a sky-area of 1231 square degrees. The ATLAS system uses Canon 8–15mm fisheye cameras that cover most of the visible sky from Haleakala and Mauna Loa. By co-adding images immediately following the instant of GW170104 and using an adjacent star as a photometric reference, we can place a 3-sigma limit for any optical transient at the location of ATLAS17aeu of for a 1 minute average brightness, for a 1 hour average, and between the instant of GW170104 and the end of night in Hawaii.
We observed in a wide-band filter, designated "cyan" or "", which roughly covers the SDSS/Pan-STARRS and filters, and maintained our cadence for identifying moving asteroids, which was to observe each footprint 5 or more times (30 s exposures, slightly dithered) within about an hour of the first observation of each field. The automatic data processing pipeline results in dark-subtracted, sky-flattened images as well as difference images using a static-sky template generated from previous stacked data. Source extraction is accomplished on the normal and differenced images using DOPHOT [32] and TPHOT (a custom written package for PSF fitting photometry on ATLAS images). Sources on the difference images are cataloged in a MySQL database and merged into objects if there are at least 3 detections from the 5 (or more) images. The objects are subject to a set of quality filters, a machine learning algorithm and human scanning, similar to those described for Pan-STARRS transient searches [48, 37]. ATLAS17aeu was discovered in the first image pass of this region on 57758.41297 (23.7 hrs after the GW detection) and detected on 7 subsequent overlapping images in total spanning 1.18 hrs. It was discovered at RA=138.30789, DEC=+61.09267 (09:13:13.89, +61:05:33.6), with a RMS positional scatter over the 8 images of 052. Only two other extragalactic transients were identified on this night. One is a nuclear transient (ATLAS17ber = PS17em = AT2017aur) coincident with the core of a galaxy (SDSS J084004.30+584703.1) which showed variable activity for the next 70 days and is likely central AGN activity. The other (ATLAS17afb) is variability of the known QSO (SDSS J092136.23+621552.1) at . Neither of these are likely related to GW170104.
In parallel we observed the central high probability region with the Pan-STARRS1 (PS1) system [11], similar to our previous GW events. Our joint ATLAS + PS1 strategy is to cover a wide area (several 1000 square degrees) fast with ATLAS (to roughly 19 mag) and the higher probably region (several 100 square degrees) deeper with PS1 (to roughly 21.5 mag). We observed a total of 671 square degrees, covering 43.4% of the probability sky-area to a more sensitive depth () on the higher probability region (Figure 1). Data were processed and 115 suspected extragalactic transient objects were detected in the first three days after the event as described in [37]. Of these, we have spectroscopically confirmed 12 as supernovae or AGNs (5 SNIa, 2 SNIb, 3 SNII, 2 AGNs), with two uncertain classifications dominated by the host galaxy and a summary paper on PS1 findings in LIGO O2 is in preparation. PS1 also detected ATLAS17aeu on MJD=57758 and 57759 in the filter, with the first detection just before the ATLAS17aeu point. We recovered the transient in the ATLAS data first, due to our quicker processing speed for the shallower and smaller data rate (a factor of about 10) of ATLAS compared to PS1. All photometry values are reported in Table 1.
We subsequently observed ATLAS17aeu with Gemini North and GMOS [22], acquiring both band imaging and optical spectroscopy on MJD = 57761.595 (2017-01-08.595 UT, 4.2 days after the GW detection). These data were taken with the e2V deep depletion (e2vDD) detector array before it was decommissioned in February 2017 (within program GN-2016B-Q-2 PI: Chambers). The spectrum was taken with the R400 grating covering 4490-8878 Å, with a 10 slit in seeing conditions of 106. Six separate 900s exposures were taken giving a total of 5400s on source. These 2D data were reduced with the IRAF/Gemini package in a standard way, with the arc lamp wavelength calibration checked using sky emission lines. Two methods of spectrum stacking and sky subtraction were used. The first method simply extracted a spectrum from each single 900s exposure, with sky subtraction in apertures close to the object. The second involved 2D image subtraction, alignment and stacking (since the object was shifted spatially during the exposures). Similar results were achieved in each case. The imaging sequence was a set of 6180 s exposures which were shifted, aligned and stacked together. A series of 14 SDSS reference stars within 2 arcmin of the position of ATLAS17aeu were used to photometrically calibrate the stacked image. ATLAS17aeu was clearly detected in the GMOS images at (Table 1) and a good signal-to-noise spectrum revealed a blue featureless continuum ( per pixel). We applied flux calibration using a standard star with the same instrument setup and a telluric absorption line correction for O2 using an atmosphere model convolved and rebinned to the spectrometer resolution e.g. as described in [35].
When the object had faded we again used Gemini North and GMOS to take a deep band image to search for a host galaxy and constrain the redshift of the transient (within program GN-2017A-Q-23 PI: Chambers). On 2017 April 01, we took a series of s images with a midpoint time of MJD=57844.33 (86.9 days after the GW detection) during the 1170 s total exposure time. By this time, the new Hamamatsu detector array had been installed in the instrument. We then centered the GMOS slit on the position of ATLAS17aeu and set the slit angle to also cover the closest visible galaxy, which offset from the source by . On the night of MJD=57845.252 (2017-04-02, 87.8 days after the GW detection), we took a series of s exposures with the R400 grating, again covering 4490-8878 Å. The observations used the Nod & Shuffle mode. Nod & Shuffle mode interleaves short observations (typically 60 seconds each) of the object and the sky without reading out the CCD. The charge is shuffled on the chip into storage regions, resulting in two separate spectra images in a single CCD exposure, one containing the object and the other containing only the sky. The two spectra images are then subtracted from each other which helps remove strong sky emission residuals, leaving increased Poisson noise at the position of the skylines. As the IRAF/Gemini package does not yet function with the Hamamatsu detector array, we employed manual reductions for both the imaging and spectroscopic modes. After subtracting the spectra images from each other we then shifted and stacked the 9 exposures together. The results are described in Section IV
In addition we used Keck II and the DEIMOS spectrometer to take spectra with the same slit position as set for the GMOS spectra on the night of MJD=57870 (2017-04-27, 113 days after the GW detection). We took s with the R600ZD grating, and a 12 slit, giving a spectral range of 5550-9839 Å (with the OG550 blocking filter) and a resolution of 4.5 Å at the center of the range. DEIMOS is an 8-detector array and ATLAS17aeu fell on chips 3 and 7 (Video Input 6 and 14). These two detectors data were debiased using overscan, flat-fielded and extracted in standard fashion. After correcting for the 2D distortion on these chips, we forced an extraction of the weak signal close to the position of ATLAS17aeu. The results of the imaging and spectroscopy are in Section IV.
ATLAS17aeu immediately stood out as an unusual and rare transient in the ATLAS and Pan-STARRS1 data streams that occurred within 1 day of GW170104 [43]. The decay rate of 0.71 mag hr-1 is faster than typical cataclysmic variable (CV) decline [5] and slower than M-dwarf flares [7]. The PS1 images confirmed the fading on the second night of observations when it had faded below the ATLAS detection limit. During the first year of general ATLAS surveying we typically took 5 dithered exposures per night, separated across approximately 1hr. PS1 has been observing in a set of quad exposures each night, separated by about 15mins each, since 2015. In both these surveys, we find many supernovae, M-dwarf and CV like candidates [44], but fast transients which decline with this rate are rare (see Section V for further discussion of rates). Therefore we immediately released this information [43, in] to the broad LIGO-Virgo EM-followup effort [1, see]. This instigated a series of multi-wavelength observations, which we summarize in the next section.
III Multi-wavelength observations and GRB170105A
ATLAS17aeu was observed in both the x-ray by Swift [17] and the radio by the Arcminute MicroKelvin Imager [29, AMI;] and the Very Large Array [13, VLA]. [17] reported an x-ray source with Swift (0.3-10 keV; RA, Dec = 138.3059,+61.0919) on MJD=57760.034 (2.6 days after the GW detection) at 4163 from the position of ATLAS17aeu. We downloaded the Swift X-ray Telescope (XRT) images from the archive and measured fluxes using the HEASARC sosta task on 8 separate epochs from MJD=57760.03365 to 57770.50380. We used cm-2 and a photon index of [16, as in] to convert the measured counts s-1 to erg cm-2 s-1 using HEASARC WebPIMMS. A subsequent enhanced position was published on the Swift website as RA, Dec = 138.30789, 61.09263 with an error radius of 2.2 arcsecond (90% confidence) which is also consistent with ATLAS17aeu. The unabsorbed fluxes over the 0.3-10 keV range are reported in Table 1 and plotted in Fig. 2. The HEASARC tool xselect was used to extract XRT images in different energy range frames from which the photons were counted. A histogram of the energy distribution of individual photons from the 5 epochs with x-ray detection is shown in Fig. 3. The values cluster around 1 keV, consistent with a soft X-ray source. Two radio detections were reported, the first by [29] with the AMI-LA (Arcminute Microkelvin Imager Large Array) at 15 GHz on MJD=57760.04 (2.6 days after the GW detection) and shortly later by [13] with the VLA at 6 GHz in an observation covering MJD=57760.58796 to 57760.62950. The AMI results are publicly available22 2 https://4pisky.org/ami-grb/ and are listed in Table 1.
A gamma-ray burst was, independently of all these data, discovered by POLAR [26, GRB170105A;] with a discovery time that could imply a link between the GRB and ATLAS17aeu [23, as initially proposed by], or perhaps linking either of the events to GW170104. The GRB was also detected by AstroSat CZTI [33], Konus-Wind, and INTEGRAL SPI-ACS [41]. The properties of the GRB are summarized in Table 1. The GRB fluence from Konus-Wind was erg cm-2, within the energy range 20 keV - 10 MeV [41]. The signal in the three energy bands of Konus-Wind 33 3 http://www.ioffe.ru/LEA/GRBs/GRB170105_T22450/ shows no flux in the hardest band 300-1160 keV, but significant detections in the 18-70 and 70-300 keV channels. We estimated the and durations (the time intervals containing 25-75% and 5%-90% of the total fluence) from the available Konus-Wind lightcurve and found s, s in the publicly available integrated energy bandpass of 50-200 keV 44 4 https://gcn.gsfc.nasa.gov/konus_grbs.html. [8] reported a s and with no signal above 100 keV, they suggest a classification of a long, soft GRB. While we measured s in the integrated energy bandpass of 50-200 keV (and s), it appears that there is a flux over a longer duration of order 20 s in the softest channel only [41, 18-70keV]. This is visible in the online plot of the GRB duration (in the low time resolution plot) but is not captured in the high time resolution data files. [40] presented the second Konus-Wind sample of short GRBs, and in defining the sample they adopted s. This is somewhat of an arbitrary cut off, in order to define a relatively clean sample of short bursts which could be further sub-classified. However [40] more quantitatively defined two Gaussian distributions in the hardnessduration plane for 1143 Konus-Wind bursts. The long, 20 s duration of GRB170105A in the soft -ray channel puts it comfortably within the long GRB Gaussian distribution, and outside the 3 contour that defines the short, hard GRBs. The hardness ratio from Konus-Wind is defined as the ratio of counts in the G3 to G2 bands (). These quantitative fluxes are not available publicly yet but since there is no flux in the 300-1160 keV range (roughly band G3) then it is likely that this GRB is long and soft. The properties of this GRB in context with the Swift, Fermi and Konus-Wind detected GRBs is further discussed in Section V.
The detections by Konus-Wind, and INTEGRAL (SPI-ACS) allowed triangulation of the signal, resulting in a sky annulus which has a radius of 34.255∘ (and is 16.644∘ wide) centered on RA=129.749 deg (08h38m60s) and DEC=+27.904 deg (+27d54m14s) as reported in [41]. ATLAS17aeu is 34.040∘ from the center and within the annulus and therefore the positions are consistent. Figure 1 shows the skymap from LIGO for GW170104 and the likely GRB170105A annulus from [41] together with the position of ATLAS17aeu. A joint AstroSat CZTI + IPN localization analysis showed ATLAS17aeu spatially consistent with the detection [8].
Therefore we have three distinct astrophysical events GW170104, ATLAS17aeu and GRB170105A which are spatially coincident within the uncertainties and are temporally coincident within 24 hr. We now consider the possibility that ATLAS17aeu is related to either of these transients and the likelihood that all three are physically related.
| Telescope | Magnitude/Flux/Fluence | Filter/Waveband | MJD | Position | Ref |
| GW170104 | … | … | 57757.42498 | [3] | |
| GRB170105A | see Fig. 1 | ||||
| POLAR | 80-500 keV | 57758.218137 | [26] | ||
| AstroSAT CZTI | 40-200 keV | 57758.218125 | [8] | ||
| Konus-Wind | erg cm-2 | 20 keV - 10 MeV | 57758.218174 | Centre : 129.749,+27.904 | [41] |
| INTEGRAL-SPIACS | 80keV - 8MeV | 57758.218125 | Annulus radius :34.255 | [26] | |
| SWASP | 57758.05948013 | at 17aeu coords | [39] | ||
| SWASP | 57758.09198558 | … | [39] | ||
| SWASP | 57758.20992235 | … | [39] | ||
| PS1 | 17.75 0.01 | 57758.389 | 138.30783, +61.09272 | this paper | |
| ATLAS | 18.12 0.09 | 57758.41297 | 138.30789 +61.09267 | this paper | |
| ATLAS | 18.25 0.11 | 57758.41446 | 138.30789 +61.09267 | this paper | |
| ATLAS | 18.26 0.11 | 57758.42672 | 138.30789 +61.0926 | this paper | |
| ATLAS | 18.57 0.14 | 57758.44191 | 138.30789 +61.09267 | this paper | |
| ATLAS | 18.48 0.13 | 57758.44691 | 138.30789 +61.09267 | this paper | |
| ATLAS | 18.34 0.12 | 57758.44792 | 138.30789 +61.09267 | this paper | |
| ATLAS | 18.45 0.10 | 57758.45499 | 138.30789 +61.09267 | this paper | |
| ATLAS | 18.94 0.17 | 57758.46196 | 138.30789 +61.09267 | this paper | |
| PS1 | 18.25 0.02 | 57758.464 | … | this paper | |
| PS1 | 20.64 0.10 | 57759.338 | … | this paper | |
| PS1 | 20.71 0.13 | 57759.354 | … | this paper | |
| PS1 | 20.97 0.09 | 57759.539 | … | this paper | |
| PS1 | 21.20 0.12 | 57759.556 | … | this paper | |
| PS1 | 20.88 0.10 | 57759.618 | … | this paper | |
| Swift - XRT | erg cm-2 s-1 | 0.3-10 keV | 57760.03365 | 138.3059 +61.0919 | [17] |
| Swift - XRT | erg cm-2 s-1 | 0.3-10 keV | 57760.86307 | … | this paper |
| AMI | 336.0 Jy | 15.5 GHz | 57760.1667 | Not quoted in GCN | [29] |
| Hale | 57760.33719 | … | [23] | ||
| DCT | 57760.45556 | … | [9] | ||
| DCT | 57760.45556 | … | [9] | ||
| DCT | 57760.45556 | … | [9] | ||
| VLA | 159.0 9.8) Jy | 6 GHz | 57760.62950 | Not quoted in GCN | [13] |
| AMI | 35317 Jy | 15.5GHz | 57761.03 | … | https://4pisky.org/ami-grb/ |
| TNG | Vega | 57761.09319 | … | [28] | |
| Gemini | 22.77 | 57761.51968 | … | this paper | |
| Swift - XRT | 9.12.8 erg cm-2 s-1 | 0.3-10 keV | 57762.69006 | 138.3059 +61.0919 | [16] |
| Swift - XRT | erg cm-2 s-1 | 0.3-10 keV | 57764.12551 | … | this paper |
| AMI | 18319 Jy | 15.5GHz | 57765.03 | … | https://4pisky.org/ami-grb/ |
| Swift - XRT | 1.30.6 erg cm-2 s-1 | 0.3-10 keV | 57765.38889 | … | this paper |
| Swift - XRT | erg cm-2 s-1 | 0.3-10 keV | 57766.21122 | … | this paper |
| AMI | 14219 Jy | 15.5GHz | 57767.02 | … | https://4pisky.org/ami-grb/ |
| Swift - XRT | erg cm-2 s-1 | 0.3-10 keV | 57767.37897 | … | this paper |
| AMI | 12220 Jy | 15.5GHz | 57768.03 | … | https://4pisky.org/ami-grb/ |
| AMI | 11827 Jy | 15.5GHz | 57769.03 | … | https://4pisky.org/ami-grb/ |
| AMI | 11827 Jy | 15.5GHz | 57770.03 | … | https://4pisky.org/ami-grb/ |
| Swift - XRT | 5.52.3 erg cm-2 s-1 | 0.3-10 keV | 57770.50380 | … | this paper |
| AMI | 8123 Jy | 15.5GHz | 57771.03 | … | https://4pisky.org/ami-grb/ |
| AMI | 14921 Jy | 15.5GHz | 57772.04 | … | https://4pisky.org/ami-grb/ |
| AMI | 8428 Jy | 15.5GHz | 57773.04 | … | https://4pisky.org/ami-grb/ |
| AMI | Jy | 15.5GHz | 57774.01 | … | https://4pisky.org/ami-grb/ |
| AMI | Jy | 15.5GHz | 57775.97 | … | https://4pisky.org/ami-grb/ |
| AMI | 8218 Jy | 15.5GHz | 57777.01 | … | https://4pisky.org/ami-grb/ |

IV Host galaxy and redshift constraints for ATLAS17aeu
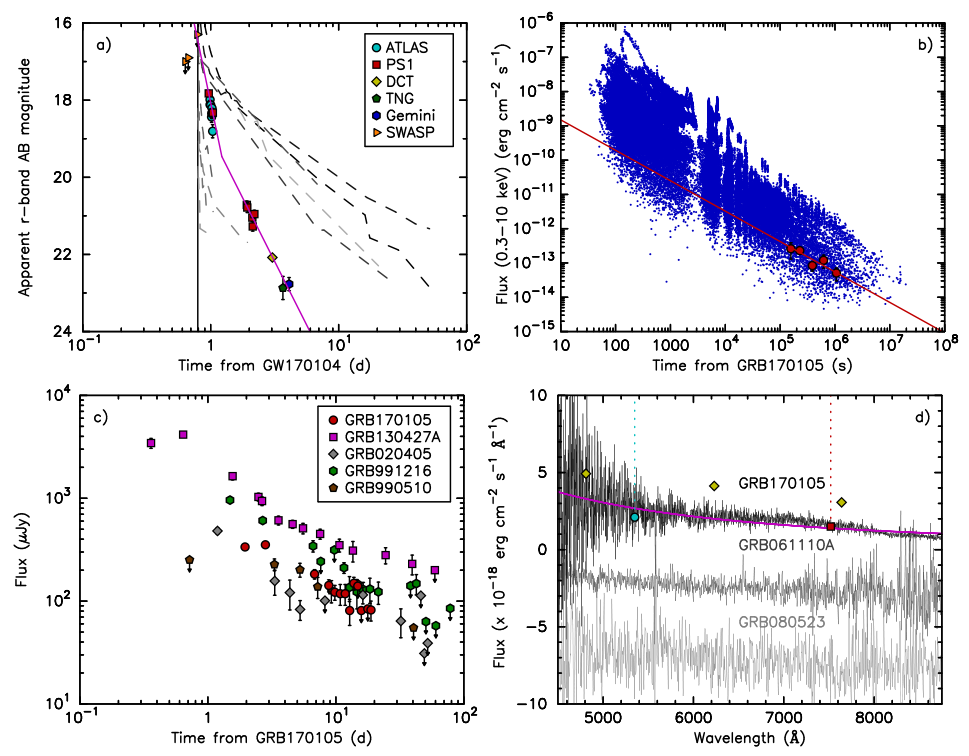
The relative volumetric rates of GRBs, GRB-like afterglows and GW sources can inform a discussion of probability of coincidences. Therefore identification of the host galaxy and redshift determination of ATLAS17aeu is desirable. The initial GMOS spectrum of ATLAS17aeu, when it was fading at , shows a blue featureless continuum (Fig. 2). There are no obvious absorption lines such as Mg ii (from ISM absorption in the host) and no strong nebular emission lines (e.g. H, O [iii]) from star formation in the host. The blue featureless continuum can be fit with a power-law with index . This is not unlike other GRB afterglow spectra, for example from the extensive study of [19]. Some of these are examples for which a definitive redshift has proven difficult. Two examples are shown in (Fig. 2), GRB060110A and GRB080523 from [19]. The shape of the SED of ATLAS17aeu from the Gemini spectrum (which is +3.3 days after GRB170105A) is consistent with the color inferred from the ATLAS cyan and the Pan-STARRS photometry at just +4.8 hr after the GRB. The SED from the Discovery Channel Telescope photometry (at +2.3 days after GRB170105A) by [9] also shows the same blue slope. This indicates that the optical SED of ATLAS17aeu stayed relatively constant for the three days over which it was observed with a power-law index .
A montage of our images is shown in Fig. 4. We originally noted in [43] that ATLAS17aeu is 23 arcsec from the face-on, bright, spiral galaxy SDSS J091312.36+610554.2 which has a spectroscopic redshift of . This implies a luminosity distance of 990 Mpc so if ATLAS17aeu were related it would be at a projected distance of 75 kpc from this galaxy (see Fig. 4). This luminosity distance is consistent with the LIGO distance to GW170104 which suggests a 10-90 percentile probability of 520-1010 Mpc in this direction [34, from the analysis of]. However our deep GMOS imaging reveals the environment of ATLAS17aeu in more detail. There is a faint galaxy exactly at the position of ATLAS17aeu in the Gemini image of 2017 Apr 01, which we label "Galaxy A" in Fig. 4. With aperture photometry, we measure . There is also a brighter extended source which is 18 south east of the position of ATLAS17aeu (RA=9:13:14.120, DEC=+61:05:32.60), for which we measure . We label this "Galaxy B", and it is clearly visible in the earlier Gemini image (from 2017 Jan 08) resolved from ATLAS17aeu. In this image we measure , with the difference between the two arising from the choice of aperture required to minimise contamination from the bright flux of ATLAS17aeu. Galaxy B is almost certainly the object report by [27] at , which they proposed as a host. Our GMOS images now show that this is offset and resolved from the position of ATLAS17aeu. It is possible that Galaxy A and B are physically linked and could either be a merging or disturbed system and a redshift for both is desirable.
We placed the slit of GMOS and DEIMOS (see Sect.II for details of these deep spectra) across these two galaxies as illustrated in Fig. 4 in search of any emission lines of either which would provide a redshift for ATLAS17aeu. There is no obvious emission line detected at the spatial positions of Galaxy A or B. The slit passed through two brighter galaxies, for which we measure redshifts for the starforming SDSS J091318.49+610512.6 and for the early type galaxy SDSS J091310.39+610548.6 (labeled in Fig. 4 for completeness). In the Gemini GMOS spectrum (for which nod and shuffle was used), there is faint continuum present for Galaxy B, whereas no apparent signal is at the position of Galaxy A (see Fig. 5). We are confident in the location of Galaxy B on the 2D spectral images from the spatial consistency of its position and measured offsets from the and bright sources located in the slit. In the first GMOS spectrum of ATLAS17aeu there is weak, possible emission line at 7860.30.5 Å illustrated in the inset panel of Fig. 5. If this was confirmed, it could potentially be H from Galaxy A or B at . The feature is visible in two different extraction methods, either extracting and combining the six individual spectra or combining and sky subtracting the 2D frames and then extracting the object. It has a FWHM of Å, which is narrower than the skylines measured on the frames (6 to 7.6 Å). No spatially extended flux is visible on the 2D spectral frame at this position. An excess in flux is only marginally visible in the 2D spectrum of ATLAS17aeu at this position (which would be Galaxy A). However we find no confirmation of the line in the GMOS or DEIMOS deep spectra taken later (Fig. 5) and therefore cannot confirm a redshift for either Galaxy A or B. A faint continuum for each of Galaxy A and B is visible in the Keck 2D images and we forced extraction of the signal using the trace of the bright galaxy. Since slit nodding or shifting was not used in the Keck spectra, the red part is skyline noise dominated. We manually snipped out the lines and rebinned the 1D, flux calibrated, spectra to 20 Å per pixel dispersion. This gives a course spectrum for which the overall SED should be reliable. We then applied synthetic photometry and scaling to bring the continuum into line with and respectively for Galaxies B and A. Fig. 5 shows that Galaxy B is bluer than A, however no reliable redshift could be determined. Galaxy A looks relatively flat in its SED, while Galaxy B clearly does have a rising blue continuum (which we also see in the Gemini spectrum). There is no clear sign of the 4000 Å break, for example, in either. This could mean that , but it is not a definitive statement given the signal-to-noise and wavelength coverage of the data. We may be seeing either the rising optical continuum of a low redshift galaxy, or the rising UV (2000-3000 Å) continuum of an Sb-Sd starforming galaxy. The fact that we see no strong absorption due to the Lyman- forest in the first GMOS spectrum of ATLAS17aeu provides a robust upper limit to the redshift of [19, as done for other GRBs in]. As far as we can tell with these data, there is no clear evidence of either being high redshift (). At the position of ATLAS17aeu (Galaxy A, where we see no continuum flux in the Gemini spectrum) the 3 upper limit for an emission line is erg s cm-2 depending on where the measurement is made. In the Gemini spectrum of Galaxy B, the limit is around erg s cm-2. We chose to make these measurements on the Gemini spectrum only due to the superior sky subtraction methods employed during observing and reductions.
Therefore we are left with the conclusion that ATLAS17aeu has a very faint host galaxy, at which is offset by 18 from another galaxy at . We have no firm redshift constraints for either, nor can we say if they are physically (kinematically) linked. The sample of host galaxies of 46 GRBs from [31], which extends out to redshift , indicates that about 13% (6 out of 46) are located in galaxies or fainter. [25] shows that for GRBs with , there are no objects with host galaxies fainter than , but that they are relatively common beyond . If ATLAS17aeu were at the redshift of GW170104 ( or Mpc) then it would be only mag, which is very faint even for GRB host galaxies. Assuming this redshift, it would imply a limit on the luminosity erg s-1 and a limit on the SFR of M⊙ yr-1. Of course, we have no firm redshift constraints other than it is , which would correspond to erg s-1 or a SFR limit of M⊙ yr-1. In conclusion, we do not have a measured redshift for the host of ATLAS17aeu but the faintness of the detected galaxy and the deep limits on H emission imply that a high redshift GRB origin () for ATLAS17aeu would be compatible with the characteristics of the known population of long, soft GRBs. Of course if ATLAS17aeu were associated physically with GW170104 then differences between it and the known GRB population might be expected.

V Discussion and Analysis
We begin by investigating the scenario whereby ATLAS17aeu is indeed the optical, x-ray and radio afterglow of GRB170105A. The x-ray source and the radio source are to a very high degree of probability the counterparts of ATLAS17aeu. The detection times of the three transients are listed in Table 1 in decimal MJDs and given here in UT times to the nearest second: GW170104 at 2017-01-04 10:11:58 [3], GRB170105A at 2017-01-05 06:14:07 [26, 33], and ATLAS17aeu at 2017-01-05 09:54:40. The Swift x-ray transient is within 41 (within the 1 error bars) of ATLAS17aeu. Although the radio detections do not state their positional uncertainty, the radio instruments have pointing uncertainties of about 50 indicating their likely positional coincidence. The probability that either the radio or the x-ray transient is coincident with ATLAS17aeu to with 50 is . Trivially, we must assume that these transients are from the same object, ATLAS17aeu.
Fig 2 shows the optical and x-ray lightcurves of ATLAS17aeu in comparison with other GRB afterglows. The decline rate in the optical is a broken power law with indexes and , which is compatible with other known GRB afterglows from [10], and may offer insight into the circum-burst medium. The x-ray lightcurve for Swift XRT is shown in comparison with 297 GRBs with known redshifts and again, it sits within the expected locus of points. GRBs show a trend between x-ray flux and -ray fluence, albeit with a broad spread of more than one order of magnitude [18, see Fig. 12 of]. The fluence of GRB170105A [41, erg cm-2;] should be compared with the estimate of x-ray flux at 11hrs after burst. Fig. 2 indicates that this would be of order erg cm-2 s-1 if we extrapolate back to s after the GRB. The ratio of x-ray flux to -ray fluence thus comfortably sits in the observed range of GRB afterglows. Long GRBs show a characteristic range of optical to x-ray flux, when both are estimated at s from the burst [10]. For ATLAS17aeu we estimate Jy and Jy, having corrected the extrapolated point for Galactic ISM extinction and the extrapolated XRT data for Galactic H I column density (and assuming an energy band of 1 keV, see Fig. 3). This falls within the broad range of the Cenko et al. [10] sample and within the spectral index expected for GRB afterglows. While these numbers are compatible, we need to consider the rates of GRB more quantitatively to determine the probability of association of ATLAS17aeu with GRB170105A.
We now calculate the probability that the -ray burst is independent of ATLAS17aeu (i.e. just a chance coincidence). We use Poisson statistics, where the probability of an occurrence of events is given by
| (1) |
where is the expectation value. The value of is the product of a number of factors given by the rate of each
| (2) |
The rates we will discuss in this section are listed for reference in Table 2. In this case, we will derive the Poisson probabilities of getting one or more random coincidences, which simplifies Eqn. 1 to
| (3) |
To determine the time coincidence, we take as a lower bound the SWASP observation at MJD=57758.20992235, [39] and as an upper bound the first PS1 observation (to an approximate depth of 21.5 mag) at 57758.38892. GRB170105A occurred at 57758.218137. Therefore we have a time coincidence window of () days. The 2nd Fermi GBM catalog [47] and the Swift catalogue 55 5 http://www.grbcatalog.org/ [18] indicate rates of 238 and 99 GRBs per year in each facility. However there is obviously overlap between the two samples. The Fermi GBM catalogue indicates that 26% of their sources were also detected by Swift, therefore we estimate a total sky rate of Fermi GBM + Swift of 275 per year. For a GRB rate of 275 per year (0.75 per day; ) and a time window of 0.18 days (=0.18), this results in a probability of getting 1 or more random coincidences of .
The positional coincidence from the IPN triangulation of [41] means we should use the positional annulus for the GRB170105A which covers 2901.5 square degrees, resulting in a probability of 0.07 compared to all sky (i.e. =0.07). Combining these probabilities, we get 1% probability that GRB170105A was simply a chance coincidence with ATLAS17aeu. (). In other words the chance coincidence of ATLAS17aeu and GRB170105A can be ruled out with 99% (2.6) confidence.
This calculation assumes, of course, that ATLAS17aeu has properties that lead us to hypothesise that an association is plausible. We are justified in this since we find that the x-ray, optical, and radio detections are similar to GRB afterglows. The three energy bands of Konus-Wind show no detected flux in the hardest channel of 300-1160keV. This, combined with the measurements of POLAR and AstroSat CZTI of between 2-15 s, and the soft extended -ray flux (around 20 sec duration) detected by Konus-Wind (18-70 keV) would classify GRB170105A as a very soft GRB (as discussed above in Section III) with extended emission. In Fig. 6 we place GRB170105A in the locus of the Swift and Konus-Wind bursts with the measured and with an approximate upper limit of . While we are aware that is larger in the softest channel (only), we do not have access to those data to make a quantitative measurement and therefore we plot the specific measurement we can make on the integrated 50-200 keV data. Its location is not particularly unusual in the broad population of GRBs, although how soft the spectrum is remains to be reported by the Konus-Wind team. Since the redshift is unknown, the arrow in the vs plane represents the possible position of ATLAS17aeu from z=0.18 (were it to be associated with GW170104) and , which is our upper limit from the lack of Lyman- absorption in the Gemini afterglow spectrum.
[4] reported radio observations of the GRB130427A with the Arcminute Mircrokelvin Imager (AMI) at a frequency of 15.7 GHz between 0.36 and 59.32 days. At a redshift of , it had a flux of 1300Jy at +2 days, which is 4 times brighter than ATLAS17aeu at the same epoch (with respect to the GRB in each case) as shown in Fig. 2. [4] compiled early radio observations of GRBs and illustrated that the brightness temperatures can be estimated from
| (4) |
where is the distance (in cm), is the flux (Jy), is the observed frequency in Hz, and is time (s) since the GRB. [4] further discuss that a minimum Lorentz factor of a jet (assuming the standard GRB scenario) can be estimated from , where the maximum brightness temperature is the inverse-Compton limit K [20, as in]. For ATLAS17aeu to have a comfortably high Lorentz factor of [4, the minimum found in] then the redshift must be . Therefore, one explanation is that ATLAS17aeu is the x-ray, optical and radio afterglow of GRB170105A, and that the GRB is part of the known population of long, soft GRBs between redshift . All the data we have would be consistent with that explanation, including the low probability of a chance coincidence of the two ( as discussed above).
| Object | Rate | Reference |
| Fermi GRBs (GBM) | 238 per year | [47] |
| Swift GRBs | 99 per year | http://www.grbcatalog.org/ |
| Fermi + Swift | 275 per year | see Section 4 |
| Fraction of Swift GRBs with x-ray afterglow | 0.95 | [18] |
| Fraction of Swift GRBs with optical afterglow | 0.3 | [10] |
| Fraction of GRBs in hosts | 0.13 | [31] |
| Fraction of LGRBs within | 0.025 | [6] |
| Fraction of all (short+long) sGRBs within | 0.158 | [6] |
We assume then that ATLAS17aeu is the optical, x-ray and radio afterglow of GRB170105A and now consider the rate of GRBs to determine the Poisson probability of coincidence of this gamma-ray, x-ray, optical and radio transient with GW170104. The GRB170105A was approximately =1 day away from the GW170104, hence the Poisson probability of 1 or more GRBs per 1 day period is (where ). The LIGO skymap has an area of 2000 square degrees [46, 90% enclosed probability, from the LALInference map;] or about 0.05 of the sky. Therefore the rate of GRBs within 1 day and 2000 square degrees provides a probability of coincidence of (for =0.05) . This is the probability in 3 dimensions - the 2D location on the sky and in the temporal window of 1 day. In other words a chance coincidence is unlikely at 2.1 level, but not ruled out.
However it is worth considering the facts that if GRB170105A is associated with ATLAS17aeu then there are other properties that make the chance of coincidence reduce. The rate of Swift GRBs which have optical afterglows is 30% of all Swift GRBs from [10]. We chose this value of since [10] defined their afterglow distribution at s after the GRB and extrapolating ATLAS17aeu back to s, it would comfortably sit above this flux level. With only 30% of GRBs having bright afterglows, this reduces the probability of an optically bright GRB within 24hrs, within the sky annulus to =0.01 (with ) In other words a chance coincidence is unlikely at the 2.6 level. One could also propose that the host galaxy of ATLAS17aeu (Galaxy A) is unusually faint for a GRB host, in that [31] find that only 13% of GRBs are found in galaxies fainter than . Hence if we fold this into the Poisson probability equation, we reduce the expectation value by a factor of , giving =0.001 This would imply that a chance coincidence is unlikely at the 99.9% level, or 3.3. However we recognize that inclusion of every property of GRB170105A simply serves to reduce the probability and therefore reduces the meaning and viability of the calculation. We therefore simply state that the chance of a long GRB within the time and 2D sky area window for GW170104 is . While we have a 4D location (in space and time) for GW170104, we lack a definitive distance to GRB170105A. Such a measurement would provide a more definitive answer.
While the probability of a chance coincidence of the GW even with GRB170105A (which has ATLAS17aeu as its afterglow) is low, there are further reasons to be cautious about drawing a conclusion of a causal link. We lack a quantitative physical mechanisms to produce a GRB and multi-wavelength afterglow beginning 24hrs after the merger of two black holes of masses 31M⊙and 19M⊙. [30] and [15] have proposed that binary black holes could well have a circumbinary disc still existing at the time of merger and that perturbation of this disk by the GW energy could result in accretion onto the newly formed single BH with energy from the mid-energy x-ray range to the mid-infrared.
For illustrative purposes, to consider the plausibility that emission of the sort proposed by [30] and [15] has occurred, we speculate that ATLAS17aeu is within the distance range implied by LIGO ( or Mpc). We consider the x-ray and optical to be linked through emission from hot, thermal radiation from a circumbinary disk. The measured contemporaneous fluxes at days are erg cm-2 s-1 in the optical (=21.5) and erg cm-2 s-1 in the x-ray. This gives a ratio of . The Swift detected x-rays were soft as shown in Fig. 3, peaking at 1keV or below. If we assume that they peak at 300 eV, we can approximately fit a thermal blackbody SED at K (20eV), which would peak in the EUV around 140Å. However a thermal blackbody spectrum is a poor fit to the Gemini afterglow spectrum and the inferred SED from the combined ATLAS and PS1 colors and the DCT photometry of [9], and also does not explain the radio flux. Therefore we can conclude that the spectral energy distribution at the time of the first (and brightest) x-ray point appears to be non-thermal, no matter what distance the GRB is at. If indeed ATLAS17aeu was within the LIGO distance range then it has luminosities in the x-ray, optical and radio ( in Table 3) of order erg s-1. This is broadly similar to the energies predicted by [15] for the circumbinary disk accretion model. The uncertainties are large and the luminosity is a strong power of , the greater of the Keplerian disk velocity and the post-merger kick velocity (which is unknown), and is dependent on an unknown efficiency scaling factor and the relic disk mass (see their equation 6). In addition, the de Mink - King model predicts that the emitting region should have a characteristic emitting temperature between and the peak of the EM radiation should be in the medium x-ray energy regime. This is quite compatible with the emitted energies of ATLAS17aeu (Table 3) and the delay time of hrs between the GW and energy emission is also in the broad region proposed in [15]. Of course, this relies on the assumption that ATLAS17aeu is within the LIGO distance range. It’s not clear if the de Mink - King model can also produce a GRB, through disk accretion with a delay of 24 hrs after black hole merger. It is possible that the GRB emission is a distraction, a chance coincidence, and not related to ATLAS17aeu. As shown above this is statistically unlikely but still plausible. A key requirement is future constraints on the redshift of the host galaxy of ATLAS17aeu, either through very deep and long integration spectra or through a photometric redshift technique. If we were able to determine the redshift and luminosity distance of either Galaxy A or B, and if it were to fall within the distance range of GW170104, this would reduce the rate of such a coincidence to levels that would force consideration of a physical link. Correspondingly, if the redshift were definitive in being outside the GW170104 range, a chance coincidence could be securely concluded.
| Wavelength | Epoch | |||
|---|---|---|---|---|
| erg/s/cm2 | erg/s | ergs | ||
| Gamma rays | 57758.22 | … | … | 2.4 |
| Optical | 57758.39 | 1.2 | 1.0 | … |
| X-rays | 57760.03 | 2.9 | 2.7 | … |
| Optical | 57760.03 | 3.7 | 3.4 | … |
| Radio | 57760.17 | 5.0 | 4.7 | … |
Finally, we comment on how frequently ATLAS should see the optical afterglows of GRBs during its normal operations. Since ATLAS typically observes 5 times over a 5000 square degree footprint every night, there is a quantifiable probability of the system catching a GRB afterglow. The number afterglows that ATLAS is likely to detect per year is
| (5) |
where is the annual rate of GRBs, is the area in square degrees covered per night, is the time window in hours that GRB afterglows are typically visible above the ATLAS limit of , is the fraction of GRB afterglows that are detectable by ATLAS during this period of hrs and is the fraction of clear, useful weather time that ATLAS observes. For , then over one year with the major uncertainty being . Since ATLAS has been working in survey mode for approximately one year (March 2016 - April 2017) and we have been processing the difference imaging routinely during this period, finding 1 candidate for a GRB-like afterglow (ATLAS17aeu) is not unexpected ( of finding 1 or 0 for an expected rate of 2.4).
VI Summary
We have reported the discovery of the transient ATLAS17aeu which lies spatially within the GW170104 skymap and has a first optical detection 23.2hrs after the binary black hole merger. Analysis of multi-wavelength data from x-ray through radio, indicates that it is likely to be the optical, x-ray and radio afterglow of the gamma ray burst GRB170105. The distance inferred by LIGO to GW170104 of Mpc () leaves us with two possibilities.
One is that GRB170105A and its afterglow ATLAS17aeu are simply part of the known GRB population at higher redshift than GW170104 and a chance coincidence in time and 2D sky area. This hypothesis would not violate any constraints from the observational data, but is not uniquely proven yet. The other is that ATLAS17aeu and its associated GRB is an unusual lower redshift transient and is physically associated with GW17014. Specifically, we find the following:
- •
We have detected a host galaxy, or host galaxy system but do not have a secure redshift. For the radio flux to be consistent with a relativistic outflow and a standard GRB, the source should be (to produce a Lorentz factor ). The lack of Lyman- forest absorption in the afterglow spectrum indicates a fairly secure upper redshift limit of . The GRB is soft, with extended flux in the softest Konus-Wind band of 18-70 keV lasting about 20 seconds. Therefore a soft GRB lying at is not inconsistent with any observational data, including the faint host.
- •
We computed the probability that ATLAS17aeu was indeed such a chance coincidence with GW170104, assuming it was a GRB-like event and find this to be small (formally ). One could argue that the probability calculation is somewhat selective in its choices of what to choose as sky rates and the most robust probability to quote for coincidence is , or a chance coincidence being significant at .
- •
While this is low, it is not significant enough to link the two events. If a redshift and distance to the host galaxy could be established and if it were to be consistent with the LIGO range for GW170104, then the GRB and afterglow properties would not be those of the normal GRB population. The emitted energies in the optical, x-ray and radio would be similar to those predicted by [15] for plausible EM signatures from coalescing black holes with a relic circumbinary disk. It is not clear if the gamma-rays or significant time-delay as observed can be produced in this model.
- •
Hence it is essential that a distance estimate (either spectroscopic or photometric) is measured for the faint host galaxy (at ) and its nearby companion. A redshift lying outside the LIGO range for GW170104 would securely rule this out as a viable counterpart.
In conclusion, given the multi-wavelength data combined with the rate and probability calculations it appears that GRB170105A and ATLAS17aeu are linked but their energetics are most comfortably explained by a high redshift GRB and afterglow which is just a chance coincidence with the position and time of GW170104. The probability of such a coincidence is low, but not uncomfortably so.
However hypothesising a link between this energetic electromagnetic event and GW170104 is quite testable. If a soft gamma-ray to radio transient of something resembling ATLAS17aeu is generally produced by merging black holes (in the de Mink - King scenario), then we have had three events for which such optical coverage has been attempted (GW150914, GW151226 and GW170104). For the first one, issues with the skymap release and observability of much of the high probability region hindered observing. We covered finally only 4% of the region containining the source [37], iPTF covered about 2.5% [24], and the Dark Energy Camera project covered 3% [38] hence we can discount this as a quantitative search. For the latter two we covered 31% and 43% of the respective regions with Pan-STARRS and ATLAS [36, see]. The Dark Energy Camera and J-GEM teams covered 3% and 29% of the GW151226 map [14, 49, respectively] and there was substantial overlap between our Pan-STARRS/ATLAS coverage and that of J-GEM. Assuming that for any well observed event we have a 40% coverage of the skymap, then using the binomial distribution (probability of detections in trial events) the probability of getting 2 or more detections if we observe 8 LIGO events is 93% (approx ). The corollary is that to rule out optical electromagnetic counterparts accompanying binary black hole mergers at the 3 confidence level requires at least 11 events with 40% sky probability coverage. This behooves the EM community to either increase the sky survey coverage (for example getting to 75% probability coverage would then require only 4 events) or for LIGO and Virgo, and potentially KAGRA, to shrink the size of the sky maps by factors of around . It is also essential that accurate maps are released promptly (within 1hr of event detection) given the timescales for decline for ATLAS17aeu and the practical limitations of optical observations (e.g. daylight hours and weather).
References
- [1] Abbott, B. P., Abbott, R., Abbott, T. D., et al. 2016a, ApJ, 826, L13
- [2] —. 2016b, Physical Review Letters, 116, 061102
- [3] —. 2017, Physical Review Letters, 118, 221101
- [4] Anderson, G. E., van der Horst, A. J., Staley, T. D., et al. 2014, MNRAS, 440, 2059
- [5] Bailey, J. 1975, Journal of the British Astronomical Association, 86, 30
- [6] Berger, E. 2014, ARA&A, 52, 43
- [7] Berger, E., Leibler, C. N., Chornock, R., et al. 2013, ApJ, 779, 18
- [8] Bhalerao, V., Kasliwal, M. M., Bhattacharya, D., et al. 2017, ArXiv e-prints, arXiv:1706.00024 [astro-ph.HE]
- [9] Cenko, S., & Troja, E. 2017, GRB Coordinates Network, 20397
- [10] Cenko, S. B., Kelemen, J., Harrison, F. A., et al. 2009, ApJ, 693, 1484
- [11] Chambers, K. C., Magnier, E. A., Metcalfe, N., et al. 2016, ArXiv e-prints, arXiv:1612.05560 [astro-ph.IM]
- [12] Connaughton, V., Burns, E., Goldstein, A., et al. 2016, ApJ, 826, L6
- [13] Corsi, A., Kasliwal, M., Frail, D., & Palliyaguru, N. 2017, GRB Coordinates Network, 20396
- [14] Cowperthwaite, P. S., Berger, E., Soares-Santos, M., et al. 2016, ApJ, 826, L29
- [15] de Mink, S. E., & King, A. 2017, ApJ, 839, L7
- [16] Evans, P., E., K., Barthelmy, S., Beardmore, A., & Breeveld, A. 2017a, GRB Coordinates Network, 20415
- [17] —. 2017b, GRB Coordinates Network, 20390
- [18] Evans, P. A., Beardmore, A. P., Page, K. L., et al. 2009, MNRAS, 397, 1177
- [19] Fynbo, J. P. U., Jakobsson, P., Prochaska, J. X., et al. 2009, ApJS, 185, 526
- [20] Galama, T. J., Briggs, M. S., Wijers, R. A. M. J., et al. 1999, Nat., 398, 394
- [21] Greiner, J., Burgess, J. M., Savchenko, V., & Yu, H.-F. 2016, ApJ, 827, L38
- [22] Hook, I. M., Jørgensen, I., Allington-Smith, J. R., et al. 2004, PASP, 116, 425
- [23] Kasliwal, M., Adams, S., Vedantham, H., et al. 2017, GRB Coordinates Network, 20393
- [24] Kasliwal, M. M., Cenko, S. B., Singer, L. P., et al. 2016, ApJ, 824, L24
- [25] Krühler, T., Malesani, D., Fynbo, J. P. U., et al. 2015, A&A, 581, A125
- [26] Marcinkowski, R., Xiao, H., & Hajdas, W. 2017, GRB Coordinates Network, 20387
- [27] Melandri, A., Piranomonte, S., Branchesi, M., & et al.. 2017a, GRB Coordinates Network, 20735
- [28] Melandri, A., Piranomonte, S., D’Avanzo, P., & et al.. 2017b, GRB Coordinates Network, 20416
- [29] Mooley, K., Fender, R., & Horesh, A. 2017, GRB Coordinates Network, 20425
- [30] Perna, R., Lazzati, D., & Giacomazzo, B. 2016, ApJ, 821, L18
- [31] Savaglio, S., Glazebrook, K., & Le Borgne, D. 2009, ApJ, 691, 182
- [32] Schechter, P. L., Mateo, M., & Saha, A. 1993, PASP, 105, 1342
- [33] Sharma, V., Bhalerao, V., Bhattacharya, D., Rao, A. R., & Vadawale, S. 2017, GRB Coordinates Network, 20389
- [34] Singer, L. P., Chen, H.-Y., Holz, D. E., et al. 2016, ApJ, 829, L15
- [35] Smartt, S. J., Valenti, S., Fraser, M., et al. 2015, A&A, 579, A40
- [36] Smartt, S. J., Chambers, K. C., Smith, K. W., et al. 2016a, ApJ, 827, L40
- [37] —. 2016b, MNRAS, 462, 4094
- [38] Soares-Santos, M., Kessler, R., Berger, E., et al. 2016, ApJ, 823, L33
- [39] Steeghs, D., Pollacco, D., Ulaczyk, K., et al. 2017, GRB Coordinates Network, 20434
- [40] Svinkin, D. S., Frederiks, D. D., Aptekar, R. L., et al. 2016, ApJS, 224, 10
- [41] Svinkin, D.and Golenetskii, S., Aptekar, R., Frederiks, D., et al. 2017, GRB Coordinates Network, 20406
- [42] Tody, D. 1993, in Astronomical Society of the Pacific Conference Series, Vol. 52, Astronomical Data Analysis Software and Systems II, ed. R. J. Hanisch, R. J. V. Brissenden, & J. Barnes, 173
- [43] Tonry, J., Denneau, L., Heinze, A., & et al.. 2017, GRB Coordinates Network, 20382
- [44] Tonry, J., Denneau, L., Stalder, B., et al. 2016, The Astronomer’s Telegram, 8680
- [45] Tonry, J. L. 2011, PASP, 123, 58
- [46] Veitch, J., Raymond, V., Farr, B., et al. 2015, Phys. Rev. D, 91, 042003
- [47] von Kienlin, A., Meegan, C. A., Paciesas, W. S., et al. 2014, ApJS, 211, 13
- [48] Wright, D. E., Smartt, S. J., Smith, K. W., et al. 2015, MNRAS, 449, 451
- [49] Yoshida, M., Utsumi, Y., Tominaga, N., et al. 2017, PASJ, 69, 9