ISM properties of a Massive Dusty Star-Forming Galaxy discovered at
Abstract
We report the discovery and constrain the physical conditions of the interstellar medium of the highest-redshift millimeter-selected dusty star-forming galaxy (DSFG) to date, SPT-S J0311325823.4 (hereafter SPT031158), at . SPT031158 was discovered via its 1.4 mm thermal dust continuum emission in the South Pole Telescope (SPT)-SZ survey. The spectroscopic redshift was determined through an ALMA 3 mm frequency scan that detected CO(6–5), CO(7–6) and [C I](2–1), and subsequently confirmed by detections of CO(3–2) with ATCA and [C II] with APEX. We constrain the properties of the ISM in SPT031158 with a radiative transfer analysis of the dust continuum photometry and the CO and [C I] line emission. This allows us to determine the gas content without ad hoc assumptions about gas mass scaling factors. SPT031158 is extremely massive, with an intrinsic gas mass of . Its large mass and intense star formation is very rare for a source well into the Epoch of Reionization.
Keywords:
galaxies: high-redshift — galaxies: star formation — early universe=1
I Introduction
Searches for the most distant galaxies have now reached as far back as the first billion years in the history of the Universe, and are peeking into the epoch of reionization (EoR) at [22]. Some of the most important questions in observational cosmology concern the time scale over which the reionization of the Universe took place, the identification of the objects providing the ionizing photons and the enrichment of galaxies with metals. It is expected that star-forming galaxies play a major role in the reionization, so to understand the evolution of the Universe from its neutral beginning to its present ionized state we must study the galaxies in the EoR [29, 1, see reviews by]. How galaxies formed and evolved in the EoR is unknown. Galaxies in this era are currently being found from rest-frame ultraviolet (UV) surveys [19, e.g.]. Most of these systems, however, are low-mass star-forming galaxies for which the enrichment of the cold ISM is difficult to study even in long integrations with the Atacama Large Millimeter/submillimeter Array (ALMA) [2, b].
Massive dusty star-forming galaxies (DSFGs) [4] are not expected to be found into the EoR because it is difficult to produce their large dust masses within a few hundred Myr of the Big Bang [7, 15]. Recent wide-area Herschel and optical QSO surveys, however, have revealed dusty galaxies out to [32, 23, e.g.,]. These systems offer the unique opportunity to study extreme cases of metal/dust enrichment of the ISM within the EoR in the most massive over-densities at these redshifts.
Here we present the DSFG SPT-S J0311325823.4 (hereafter SPT031158) discovered in the South Pole Telescope (SPT)-SZ survey [3, 33]. SPT031158 is the highest redshift millimeter-selected DSFG known to-date, located well into the EoR at a redshift of . With this source, we take a step of almost 100 Myr closer to the Big Bang than the previously most distant DSFG at found by Riechers et al. [23], bringing us 760 Myr away from Big Bang. Throughout the paper, we assume a CDM cosmology with H0=70 km s-1 Mpc-1, = 0.7 and = 0.3.
II Observational Results
II.1 Determining the redshift
The redshift search for SPT0311-58 was performed in ALMA band 3 by combining five tunings covering 84.2 – 114.9 GHz [project ID: 2015.1.00504.S; see 36, 30, for further details on the observing setup]. The observations were carried out on 2015 December 28 and 2016 January 2 in the Cycle 3 compact array configuration. The number of antennas varied from 34 to 41, with baselines up to 300 m yielding a synthesized beam size of . Typical system temperatures for the observations were = 50 – 80 K (SSB). Flux calibration was done with Uranus, bandpass calibration with J03344008, and phase calibration with J03036211 and J03096058. The on-source time varied between 60 seconds and 91 seconds per tuning, accounting for a total of 6 minutes and 10 seconds. The data were processed using the Common Astronomy Software Application package [16, CASA,].
We created a cleaned 3 mm continuum image combining all 5 tunings. This yields a high signal to noise ratio (SNR) detection of 35. We also generated a spectral cube using natural weighting with a channel width of 19.5 MHz (50 – 65 kms-1 for the highest and lowest observing frequency, respectively), which gives a typical noise per channel of 0.9 –1.7 mJy beam-1.
The ALMA 3 mm spectrum of SPT031158 was extracted at the centroid of the 3 mm continuum emission (: 03h11m33142 : 23′3337 (J2000)) and is shown in Figure 1. We detect emission in the CO = 6 – 5 and 7 – 6 lines and the [C I] line (in the following ) and their noise-weighted line frequencies yield a redshift of . We also see hints of H2O( – ) and CH+(1–0), but these are not formally detected in this short integration.
The line and continuum properties are given in Table 1. For the fit to the CO(7–6) and [C I](2–1) lines we fix the line width to the mean value derived from the unblended lines. Their uncertainties include the variations of the line intensities for a fit where the line width is a free parameter.
II.2 Observations of CO(3–2) and [C II]
We used the 7 mm receivers of the Australia Telescope Compact Array (ATCA) to observe the CO(3–2) line (project ID: CX352). Observations were carried out with the hybrid H214 array, which yields a beam size of 5-6′′ at the observing frequency of 43.77 GHz. The line is detected with a SNR of 5.0 at a frequency and line width consistent with the ALMA derived redshift and line profiles.
In addition, we used the Atacama Pathfinder Experiment (APEX) to observe [C II] at 240.57 GHz. The observations were carried out in 2016 April–May in good weather conditions with a precipitable water vapor content 1.5 mm (project IDs E-296.A-5041B-2016 and M-097.F-0019-2016). The observations were performed and the data processed as described by Gullberg et al. [12]. The [C II] line is detected with a SNR of 4.3. From ALMA high spatial resolution observations of the [C II] line (Marrone et al. in prep.; project ID: 2016.1.01293.S), we extract a [C II] spectrum and flux, which are in good agreement with the APEX data. We adopt the ALMA [C II] flux hereafter.
II.3 FIR dust continuum
Table 1 (right) summarizes the dust continuum observations of SPT031158. With seven broadband continuum detections between 3 mm to 250 µm, the far-infrared spectral energy distribution (SED) of SPT031158 is thoroughly covered.
The SPT 1.4 and 2.0 mm flux densities were extracted and deboosted as described by Mocanu et al. [17]. We obtained a 870 µm map with APEX/LABOCA (project ID: M-091.F-0031-2013). The data were obtained, reduced, and the flux extracted following Greve et al. [11]. Using Herschel/SPIRE, we obtained maps at 250 µm, 350 µm and 500 µm (project ID: DDT_mstrande_1). The data were obtained and reduced as described by Strandet et al. [30].
From our photometry, we derive an apparent far-infrared (FIR) luminosity (integrated between 40–120 µm rest) of L (see Figure 2).
| Line properties | Continuum properties | |||||
|---|---|---|---|---|---|---|
| Transition | L | Wavelength | ||||
| [Jy km/s] | [km/s] | 1011 [K km/s/pc2] | 108 [] | [µm] | [mJy] | |
| CO(3–2) | 0.96 0.15 | 790 150 | 1.52 0.24 | 2.01 0.32 | 3000 | 1.30 0.05 |
| CO(6–5) | 2.10 0.33 | 720 140 | 0.83 0.13 | 8.8 1.4 | 2000 | 7.5 1.3 |
| CO(7–6) | 2.78 0.80 | 750b | 0.81 0.11 | 13.6 1.8 | 1400 | 19.0 4.2 |
| [C I](2–1) | 1.29 0.80 | 750b | 0.37 0.10 | 6.4 1.8 | 870 | 32.0 5.0 |
| [C II]APEX | 22.1 5.1 | 890 260 | 1.16 0.27 | 254 59 | 500 | 52.0 8.0 |
| [C II]ALMA | 25.88 0.65 | 1.36 0.03 | 298.1 7.5 | 350 | 38.0 6.0 | |
| 250 | 29.0 8.0 | |||||
III Characterizing the ISM in SPT031158
III.1 Source properties from high resolution imaging
ALMA high spatial resolution imaging (angular resolution of 0.3 0.5) of the [C II] line in SPT031158 shows that the system consists of two galaxies in close proximity (Marrone et al. in prep.). Only the western source is significantly gravitationally magnified and this source dominates the apparent continuum luminosity (% of the restframe 160 µm continuum flux density is emitted by the western source). In the following, we assume that the contribution from the eastern source is negligible and model the system as a single object, using the system magnification of (Marrone et al. in prep.).

III.2 Radiative Transfer Models
We use the FIR photometry and the line luminosities from Table 1 to simultaneously model the dust continuum, CO spectral line energy distribution (SLED), and the [C I](2–1) line following the radiative transfer calculation presented in Weiß et al. [35]. In this model, the background radiation field is set to the cosmic microwave background (CMB) for the dust and to the CMB plus the dust radiation field for the lines. The line and dust continuum emission are further linked via the gas column density in each component that introduces the turbulence line width as a free parameter in the calculation [35, see Eq. 7 in]. The gas column density calculated from the line emission together with the gas to dust mass ratio (GDMR) then determines the optical depth of the dust.
The calculations treat the dust and the kinetic temperature as independent parameters, but with the prior that the kinetic gas temperature has to be equal to or higher than the dust temperature. Physically, this allows for additional sources of mechanical energy (e.g. shocks) in the ISM in addition to photo-electric heating.
The chemical parameters in our model are the CO and [C I] abundances relative to H2 and the GDMR. We use a fixed CO abundance of relative to H2 [8], but keep the [C I] abundance and the GDMR as free parameters. For the frequency dependence of the dust absorption coefficient we adopt [m2 kg-1] [14], which is in good agreement with m2 kg-1 used in other work [see 26, and references therein], for our best-fitting .
Model solutions are calculated employing a Monte-Carlo Bees [21] algorithm which randomly samples the parameter space and gives finer sampling for good solutions (as evaluated from a analysis for each model). In total, we sample models. Parameter values and uncertainties were calculated using the probability-weighted mean of all solutions and the standard deviations.
III.3 Model results
| Parameter | unit | overall | cold component | warm component |
|---|---|---|---|---|
| Equivalent radius a | pc | (4000 1700) | (3700 1300) | (1500 1200) |
| K | 36 7 | 115 54 | ||
| K | 58 23 | 180 51 | ||
| log((H2)) | cm-3 | 3.7 0.4 | 5.1 1.9 | |
| km s-1 | 130 17 | 100 4 | ||
| 1.9 1.9 | 3.1 2.5 | |||
| GDMR | 110 15d | |||
| 1.91 0.05d | ||||
| [C I]/[H2] | (6.0 1.4) | (1.7 2.3) | ||
| (5.7 0.8) | () | () | ||
| (6.3 3.7) | () | () | ||
| /K km s-1 pc2 | 4.8 2.9 | 5.5 4.0 | 3.1 2.5 | |
| (4.1 0.7) | ||||
| SFR | yr-1 | ) | ||
| Myr | 150 90 | |||
Note. — The values here are apparent values. Intrinsic values can be calculated using .
Figure 2 shows the CO SLED, the continuum SED, and [C I] flux density. From the figure, it is apparent that the dust continuum SED cannot be modeled with a single temperature modified blackbody, so we instead fit two components. Since we have no information on the high- CO transition, we use the shape of the CO SLED of Arp220 [24] and HFLS3 [23] as priors. With this choice, we compare the moderately excited CO SLED of Arp220 (see Rosenberg et al. [24] for a comparison of Arp220 to other local ULIRGs) to the more extreme case of HFLS3 where the CO SLED stays high up to the =9 level (see Fig. 2). The use of the priors mainly affects the parameters of the warm gas and therefore only has a small effect on our derived gas mass (see below). Table 2 lists the parameters obtained from the radiative transfer calculations for the Arp220 prior, not corrected for magnification.
For both priors, the warm dust component dominates the peak of the CO SLED and the short wavelength part of the dust spectrum and therefore the FIR luminosity. Its size is small compared to the cold gas with an area ratio of ( kpc where is the equivalent radius defined as r [35]) for HFLS3 and slightly smaller for Arp220) which implies that the region of intense FIR continuum emission is significantly smaller than the overall gas distribution. Due to a lack of observations of CO transitions beyond (7–6), its properties are mainly driven by the assumed shape of the CO SLED for the high- transitions. But the models for both priors indicated consistently that the warm gas has a substantial density (of order 105 cm-3), a dust temperature of K and a kinetic temperature in excess (but consistent within the errors) of the dust temperature (=180 50 K when using Arp220 priors).
The cold dust component is required to fit the CO(3–2) and [C I] line emission, and the long wavelength part of the dust SED. Due to its large extent and relatively high density (r0=3.7 1.3 kpc, log(n(H2)=3.7 0.4)), it carries 90% of the gas mass. The abundance of neutral carbon in this gas phase is [C I] in agreement with other estimates at high redshift and in nearby galaxies [e.g. 34, and references therein]. For both priors, the cold gas dominates the CO(1–0) line luminosity. As for the warm gas, we find that the kinetic temperature is above the dust temperature (T=36 7 K, =58 23 K), which may suggest that the ISM in SPT0311-58 experiences additional mechanical energy input e.g., via feedback from stellar winds or AGN driven outflows. This is also supported by the large turbulent line width of order 100 km s-1 and super-virial velocity gradients (, see note b in Table 2) we find for both components and priors.
We use the kinematic parameters (dvturb and ) together with the source size and the H2 density for each component [35, see Eq. 8 in] to derive a total apparent gas mass of Mgas=(6.3 3.7) M⊙ (including a 36% correction to account for the cosmic He abundance). For the HFLS3 prior, the gas mass is % higher.
IV Discussion
IV.1 Gas mass conversion factor
With the independent gas mass estimate from the radiative transfer models in-hand we can also derive the gas-to-dust mass ratio (GDMR) and the CO-to-H2 conversion factor () for SPT031158. Since the CO(1–0) transition has not been observed, we use the flux density from the radiative transfer model which predicts ICO(1-0)=0.10 0.03 Jy km/s. In our models, we assume that each gas component has the same GDMR and we find GDMR=110 15. Due to the different physical conditions in each gas component, there is a specific value for each component. For the cold dust component, we find (K km s-1 pc and for the warm dust component (K km s-1 pc. Combining both gas components we find for SPT031158 (K km s-1 pc.
When calculating gas masses for ULIRGs, a factor of (K km s-1 pc is typically assumed [6], significantly below our estimate. The difference can easily be explained by the much higher densities we find in both components compared to the models from Downes & Solomon [6] in which most of the CO(1–0) luminosity arise from a diffuse inter-cloud medium. Since the bulk of the gas mass of this source is in the dense component, it is vital to include the higher- CO transitions in the calculation of .
A similar two-component analysis was done for the broad absorption line quasar APM08279+5255 at [35], where the dense component was found to dominate the CO(1–0) line by 70%. They find a high conversion factor of (K km s-1 pc, similar to what we find in the dense gas component. A similar reasoning for higher CO conversion factors owing to the presence of dense gas was put forward by Papadopoulos et al. [20] based on the CO SLED in local (U)LIRGs.
IV.2 [C II]
From our [C II] detection, we derive a / ratio of (7.3 0.1). Figure 3 shows that this puts SPT031158 into the lower region of the / ratio observed in a larger sample of SPT-DSFGs [12]. Similarly, low / ratios are found for the star-forming galaxy HFLS3 [23] and for the QSO host galaxy J1120+0641[32].
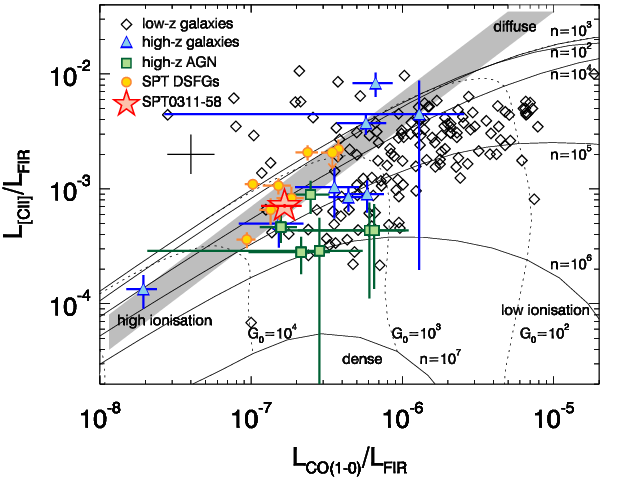
The / ratio in SPT031158 is similar to what is observed in the SPT sample [12, 4300 1300 compared to 5200 1800], and HFLS3 [23, 3000,]. This is consistent with the picture in which the [C II] emission stems from the surface of dense clouds exposed to the strong UV field from the intense starburst in SPT031158 [28, 12, 27].
The larger [C II] deficit together with the decreasing / ratio of SPT031158 and other high redshift sources compared to local galaxies may be understood as a consequence of an increasing gas surface density [18]: the higher molecular gas surface density pushes the HI + H2 mass budget towards higher H2 fractions. Since [C II] mainly arises from the PDR zone associated with HI and the outer H2 layer, this effect reduces the size of the [C II] emitting region and therefore the [C II] line intensity. At the same time, the ratio of / will decrease due to an increase in the fraction of carbon locked in CO compared to [C II].
IV.3 Concluding remarks
Both our radiative transfer model and fine structure line results indicate that SPT0311-58 resembles typical DSFGs, just at . This is also supported by its extreme SFR surface density of M⊙yr-1kpc-2 (derived using the size of the warm gas component that dominates the FIR luminosity) which approaches the modeled values for radiation pressure limited starbursts [31, M⊙yr-1kpc-2] and is comparable to what is found in other starburst like Arp220, HFLS3 and other SPT-DSFGs [25, 23, 27]. Future observations of this source will explore its spatial structure, physical conditions, formation history, and chemical evolution in great detail as it is one of very few massive galaxies known at
References
- [1] Bouwens, R. 2016, in Astrophysics and Space Science Library, Vol. 423, 111
- [2] Bouwens, R. J., Aravena, M., Decarli, R., et al. 2016, ApJ, 833, 72
- [3] Carlstrom, J. E., Ade, P. A. R., Aird, K. A., et al. 2011, PASP, 123, 568
- [4] Casey, C. M., Narayanan, D., & Cooray, A. 2014, Phys. Rep., 541, 45
- [5] Chabrier, G. 2003, ApJ, 586, L133
- [6] Downes, D., & Solomon, P. M. 1998, ApJ, 507, 615
- [7] Ferrara, A. 2010, in American Institute of Physics Conference Series, Vol. 1294, 148–157
- [8] Frerking, M. A., Langer, W. D., & Wilson, R. W. 1982, ApJ, 262, 590
- [9] Goldsmith, P. F. 2001, ApJ, 557, 736
- [10] Greve, T. R., Papadopoulos, P. P., Gao, Y., & Radford, S. J. E. 2009, ApJ, 692, 1432
- [11] Greve, T. R., Vieira, J. D., Weiß, A., et al. 2012, ApJ, 756, 101
- [12] Gullberg, B., De Breuck, C., Vieira, J. D., et al. 2015, MNRAS, 449, 2883
- [13] Kennicutt, Jr., R. C. 1998, ApJ, 498, 541
- [14] Krügel, E., & Siebenmorgen, R. 1994, A&A, 288, 929
- [15] Mattsson, L. 2015, ArXiv e-prints:1505.04758, arXiv:1505.04758
- [16] McMullin, J. P., Waters, B., Schiebel, D., Young, W., & Golap, K. 2007, in Astronomical Data Analysis Software and Systems XVI, Vol. 376, 127
- [17] Mocanu, L. M., Crawford, T. M., Vieira, J. D., et al. 2013, ApJ, 779, 61
- [18] Narayanan, D., & Krumholz, M. R. 2017, MNRAS, 467, 50
- [19] Ouchi, M., Shimasaku, K., Furusawa, H., et al. 2010, ApJ, 723, 869
- [20] Papadopoulos, P. P., van der Werf, P. P., Xilouris, E. M., et al. 2012, MNRAS, 426, 2601
- [21] Pham, D. T., & Castellani, M. 2009, Proceedings of the Institution of Mechanical Engineers, Part C: Journal of Mechanical Engineering Science, 223, 12
- [22] Planck Collaboration, Ade, P. A. R., Aghanim, N., et al. 2016, A&A, 594, A13
- [23] Riechers, D. A., Bradford, C. M., Clements, D. L., et al. 2013, Nature, 496, 329
- [24] Rosenberg, M. J. F., van der Werf, P. P., Aalto, S., et al. 2015, ApJ, 801, 72
- [25] Scoville, N. 2003, Journal of Korean Astronomical Society, 36, 167
- [26] Spilker, J. S., Aravena, M., Marrone, D. P., et al. 2015, ApJ, 811, 124
- [27] Spilker, J. S., Marrone, D. P., Aravena, M., et al. 2016, ApJ, 826, 112
- [28] Stacey, G. J., Hailey-Dunsheath, S., Ferkinhoff, C. an d Nikola, T., et al. 2010, ApJ, 724, 957
- [29] Stark, D. P. 2016, ARA&A, 54, 761
- [30] Strandet, M. L., Weiss, A., Vieira, J. D., et al. 2016, ApJ, 822, 80
- [31] Thompson, T. A., Quataert, E., & Murray, N. 2005, ApJ, 630, 167
- [32] Venemans, B. P., McMahon, R. G., Walter, F., et al. 2012, ApJ, 751, L25
- [33] Vieira, J. D., Marrone, D. P., Chapman, S. C., et al. 2013, Nature, 495, 344
- [34] Weiß, A., Downes, D., Henkel, C., & Walter, F. 2005, A&A, 429, L25
- [35] Weiß, A., Downes, D., Neri, R., et al. 2007, A&A, 467, 955
- [36] Weiß, A., De Breuck, C., Marrone, D. P., et al. 2013, ApJ, 767, 88