Dense Molecular Gas at 12 mm Towards Galactic TeV gamma-ray Sources
Abstract
The High Energy Stereoscopic System (H.E.S.S.) has revealed many TeV (eV) gamma-ray sources along the Galactic Plane and around 30 of these sources remain unidentified. The morphology and dynamics of dense gas coincident and surrounding the gamma-ray emission can provide clues about the nature of the TeV emission. The H2O Southern Galactic Plane Survey (HOPS) undertaken with the Mopra radio telescope, includes several dense gas tracers, such as NH3 (n,n) transitions and HC3N (3-2), star formation tracers including H2O masers, and radio recombination lines which trace ionised gas. A search for dense gas, traced by NH3 (1,1) emission seen in HOPS and additional observations, towards Galactic TeV sources has been undertaken. Of the 49 Galactic TeV sources covered by 12 mm observations, NH3 (1,1) is detected towards or adjacent to 38 of them. Dense gas counterparts have been detected near several unidentified Galactic TeV sources which display morphology pointing to a hadronic origin to the TeV gamma-rays. The dense gas detected towards some TeV sources displays unusual emission characteristics, including very broad linewidths and enhanced ortho-to-para NH3 abundance ratios towards HESS J1745303 and HESS J1801233, which reflects previous shock activity within the gas.
Keywords:
gamma-rays:general – gamma-rays:ISM – ISM:clouds – ISM:cosmic-rays – ISM:supernova remnants – stars:pulsars:general1 Introduction
The sensitivity of the current generation of ground based VHE gamma-ray experiments such as the High Energy Spectroscopic System (H.E.S.S., de Oña Wilhelmi 2009), has led to the discovery of many previously unknown sources of TeV (eV) gamma-rays towards the Galactic plane. The largest fraction of Galactic TeV gamma-ray sources is still made up of unidentified objects (Pühlhofer et al., 2015).
TeV gamma-rays are produced by interactions of relativistic particles and so their observation provides a probe of non-thermal astrophysical processes. GeV-TeV gamma-rays are produced hadronically, through proton-proton interactions, and/or leptonically, via Inverse Compton scattering or Bremsstrahlung. The presence of dense molecular gas can give clues about both leptonic and hadronic production of TeV gamma-rays.
The flux of gamma-rays which are produced hadronically, through proton-proton interactions, can be expected to peak along with the density of gas near proton accelerators. Coincident dense gas and TeV emission can be seen in sources such as HESS J1801233 (Aharonian et al., 2008b, see), a supernova remnant (SNR) / molecular cloud interaction region, to the NE of SNR W28, as well as parts of HESS J1745-303 (Aharonian et al., 2008c) and RX J1713.7-3946 (Maxted et al., 2012). TeV gamma-ray sources which are produced leptonically through inverse Compton emission, for example pulsar wind nebulae (PWNe), often exhibit asymmetric morphology. In the case of PWNe, this asymmetry may be explained by an inhomogeneous distribution of interstellar gas around pulsars which strongly influences their development (Blondin et al., 2001, e.g.). The TeV emission then tails off in a direction away from the denser parts of the interstellar gas.
Star formation that may not show up as infra-red sources may be traced by molecular transitions in the 12 mm band pass, such as H2O masers (Walsh et al., 2011). There is evidence that H2O masers, signposts of outflows and shocked gas, may be observable at very early stages of star formation (Forster & Caswell, 2000, e.g). Ionised gas in Hii regions is also traced, by radio recombination lines such as H69 which is included in our study. This provides an opportunity to test what role star forming regions play in TeV gamma-ray emission.
High mass stars have been linked with TeV gamma-ray emission through particle acceleration in SNRs and PWNe. High mass star forming regions and/or young high mass stellar objects may also have the potential to produce observable TeV gamma-ray emission through several mechanisms. The regions themselves could be sites of particle acceleration or the dense gas associated with these regions could simply provide target material for accelerate particles. Protostellar jets (which could be traced by H2O masers), have been identified as potential sources of observable GeV gamma-rays (Araudo & Rodríguez, 2012, see) where particles are accelerated at the jet termination shock (Bosch-Ramon et al., 2010, e.g.). Colliding wind binaries have been linked to TeV emission (Pittard & Dougherty, 2006; Bednarek & Pabich, 2011, e.g.), but, so far, no CWB has been unambiguously associated with TeV gamma-rays and only one has been detected in GeV gamma-rays (Farnier et al., 2011; Reitberger et al., 2015). Wind blown bubbles from high mass stellar clusters and/or SNRs have long been proposed as sites of particle acceleration, through diffusive shock acceleration, up to PeV ( eV) energies (Casse & Paul, 1980, e.g.) and recently, the first superbubble has been detected in TeV gamma-rays (H.E.S.S. Collaboration et al., 2015a). (Pedaletti et al., 2014) show that regions of high stellar activity within the central Galactic region, traced by dust emission and CO, could be correlated with TeV emission.
In summary, dense molecular gas that is both coincident with and/or adjacent to TeV emission can be very important in identifying the TeV emission mechanism and the location of particle accelerators. The transitions included in this study can not only help understand the density profile of molecular clouds, but can also identify regions of unusual astrophysical conditions such as outflows (e.g. the H2O maser), shocked gas (e.g. the H2O maser and NH3 transitions) and ionised gas (e.g. H69). The kinematic velocity and linewidth of molecular transitions can provide information about the distance of and gas dynamics towards Galactic TeV gamma-ray sources.
Previously, the 12CO(1-0) transition has been used to identify potential molecular cloud counterparts to unidentified TeV emission (Aharonian et al., 2008c; Abramowski et al., 2011b, e.g.). For example, by making a thorough comparison of two Galactic plane datasets, the HESS TeV gamma rays and the Nanten CO(1-0) emission, it was shown that the CO clouds in the W28 region have a remarkable spatial coincidence with the TeV gamma rays (Aharonian et al., 2008b). A subsequent comparative study toward the SNR RX J1713.73946 revealed that the combination of the atomic and molecular gas, i.e., the total interstellar hydrogen, shows a good spatial correspondence, where the Nanten CO J=1-0 distribution and the ATCA HI 21cm distribution were used to derive the gas column density (Fukui et al., 2012). This correspondence is interpreted as indication for a hadronic component to the gamma rays from RXJ1713.73946 arising from the dense ISM clumps (Zirakashvili & Aharonian, 2010; Inoue et al., 2012). The interpretation is supported by the theoretical works on the VHE gamma rays which incorporates the highly inhomogeneous distribution of the interstellar medium (Inoue & Inutsuka, 2012; Gabici & Aharonian, 2014). Further observational identification of the molecular and atomic gas toward the VHE sources are presented by Fukuda et al. (2014) for HESS J1731347, and Hayakawa et al. (2012) for HESS J1745303. These observational and theoretical results indicate the important role of the interstellar medium whose density is in a wide range from 10 cm-3 to 105 cm-3 in producing the TeV gamma-rays, and warrant further systematic efforts to identify the interstellar gas toward the galactic HESS sources.
While 12CO is abundant, the 12CO(1-0) transition has a critical density of 1000 cm-3 which contributes to the transition becoming optically thick towards molecular cloud cores. In addition, CO rapidly depletes from the gas phase towards the centre of cloud cores (Tafalla et al., 2002; Bergin et al., 2002, e.g. see). Both of these aspects can hamper the understanding of molecular cloud density profiles and internal dynamics if the 12CO(1-0) transition is used on its own. Due to the coarse angular resolution of current TeV observations (), the Dame CO survey has been used to trace large scale molecular content. As the angular and energy resolution of TeV gamma-ray observations improve with the new generation of ground based TeV telescope systems such as the Cherenkov Telescope Array (CTA, angular resolution 0.02∘ to 0.2∘), a better understanding of the density profiles of molecular clouds, using transitions which trace a wide range of temperatures and densities, will be needed to explore cosmic ray transport scenarios. Surveys such as MopraCO (angular resolution , Braiding et al. (2015)), Nanten2 (angular resolution ) and H2O Southern Galactic Plane Survey (HOPS) (angular resolution , Purcell et al. (2012)), used here, will be invaluable for this cause.
Ideal tracers of dense gases such as NH3, CS or HC3N are widely used to trace molecular cloud cores due to their lower abundance (a factor of the CO abundance) and higher effective critical densities cm-3. This gives them much lower optical depths in dense gas and so allows for a more accurate calculation of gas density and mass towards dense ( cm-3) molecular cloud cores. In addition, NH3 depletes less rapidly than CO from the gas phase in cold molecular cloud cores (Tafalla et al., 2002) and so is often used to trace cold (K) gas which is often seen in infra red dark clouds (IRDCs). NH3 inversion emission may be seen with collisional masers such as the H2O maser traced in this study which is thought to trace protostellar jet termination shocks in early stages of star formation. The CS (1-0) and HC3N transitions are used to trace warmer dense cores where star formation may already be switched on. These warmer cores are sometimes seen within Hii regions, traced by radio recombination lines such as the H69 transition, where atomic hydrogen has been ionised by young, high mass stars.
The NH3 molecule is a pyramidal symmetric top with inversion motion and metastable levels some of which display readily observable hyperfine structure. The NH3 (1,1) transition displays prominent satellite lines which along with NH3 (2,2) allow the optical depth, and hence gas temperature and mass to be strongly constrained (Ho & Townes, 1983; Walmsley & Ungerechts, 1983, e.g.). NH3 has two distinct species, distinguished by the relative nuclear spins of the hydrogen atoms, ortho-NH3 () in which all three spins are aligned and para-NH3 (K ) in which the three spins are not aligned. The rotational temperature within the same spin species reflects the kinetic temperature under Local Thermodynamic Equilibrium (LTE) conditions (Maret et al., 2009). Since the transfer processes between ortho and para NH3 are almost thermoneutral, conversion between the two spin species is very slow with respect to the reactive pathways (which are exothermic). The time scale of conversion processes between spin species is considered to be of the order of yr in the gas phase (Cheung et al., 1969). As a result, the "spin temperature" (or the rotational temperature between ortho and para species) is not considered to reflect the kinetic temperature of NH3, but instead reflect formation conditions of the NH3.
The ortho-NH3 to para-NH3 abundance ratio (OPR) is widely expected to be the statistical equilibrium value of 1.0 when the NH3 molecules are formed in gas-phase or surface grain reactions (Umemoto et al., 1999, e.g.). However, modelling by Faure et al. (2013) suggests that, in gas phase reactions, the OPR can reasonably be expected to be , and an OPR reflects production from para-enriched H2 gas. Faure et al. (2013) have modelled the formation of ortho and para ammonia and have suggested that ortho ammonia is formed preferentially over para ammonia when the NH3 is formed or condensed on a cold surface ( K) such as water or ice. In addition, because the lowest energy level of the para species of NH3 is 23 K higher than the lowest energy level of the ortho species, the para species require more energy for desorption than ortho species (Umemoto et al., 1999). Both of these aspects would enhance the ortho-to-para abundance ratio (hereafter OPR) for NH3 released from grain surfaces into the gas phase by shocks over the OPR of NH3 produced in the gas phase. The observational study of Umemoto et al. (1999) (amongst others) suggests that an enhanced OPR (OPR > 1) along with an enhanced NH3 abundance can indicate a previous shock that has released NH3 formed on dust grains into the gas phase.
This work provides a first systematic look at the dense gas (n > cm-3) traced by HOPS (Purcell et al., 2012) and further dedicated observations with the Mopra radio telescope towards Galactic TeV gamma-ray emission seen by H.E.S.S.. The large (8 GHz) bandwidth of the Mopra spectrometer (MOPS) allows for the simultaneous observation of many molecular transitions. Multiple inversion-rotation transitions of NH3 are included which allow us to identify molecular cloud cores displaying non-LTE conditions, which may indicate shocked gas. The velocity resolution (km/s at 22 GHz, Urquhart et al. 2010) of MOPS at these wavelengths provides an opportunity to search for asymmetric line profiles of molecular transitions, which can indicate disruption and shocks within cloud cores. These Mopra observations are able to provide information about the densest parts of the interacting interstellar gas and will allow us to gain an insight in the cosmic ray penetration in the inner part of the cloud cores and the gamma-ray production.
2 Observations and Data Reduction
Our study uses published H.E.S.S. results up to March 2015 (see Table 1 for specific references). H.E.S.S. detects TeV gamma-rays above an energy threshold of 100 GeV and up to 100 TeV with a typical energy resolution of 15% per photon and an angular resolution of per event (Aharonian et al., 2006c). The H.E.S.S. field of view is in diameter with a point source sensitivity of erg cm-2 s-1 at 1 TeV (25 hrs obs).
Molecular line data were taken from HOPS (Walsh et al., 2011) data and reduced using the ATNF packages LIVEDATA, GRIDZILLA, ASAP and MIRIAD (see http://www.atnf.csiro.au/computing/software/ for information on these packages). HOPS has mapped a 100 square degree strip of the Galactic plane (30∘ > l > -70∘, < 0.5∘) at 12 mm wavelengths using the Mopra radio telescope. The telescope main beam size (FWHM) is arcmin at a wavelength of 12 mm (Urquhart et al., 2010). Mopra is a 22 m single-dish radio telescope located 450 km north-west of Sydney, near Coonabarabran, NSW, Australia. HOPS observations made use of the Mopra spectrometer (MOPS) in on-the-fly mapping mode. The zoom-mode of MOPS allows simultaneous observations from up to 16 spectral windows, where each window is 137.5 MHz wide and contains 4096 channels. HOPS targets water masers, thermal molecular emission and radio-recombination lines. Overlap of HOPS with the Galactic sky seen by H.E.S.S. can be seen in Fig. 1. The Central Molecular Zone (CMZ) is not discussed in this study, and a study of this region will be detailed in a future paper. Further observation details of HOPS can be found described in Walsh et al. (2011). To derive kinematic distances from the local standard of rest (LSR) kinematic velocity, the Galactic rotation curve derived by Brand & Blitz (1993) was used unless otherwise indicated.

We also carried out dedicated observations with the Mopra radio telescope between February 2011 and January 2015. These observations employed MOPS in zoom mode and utilised the same zoom bands and central frequency as HOPS. Five sites of deep ON/OFF pointing towards HESS J1801233 and HESS J1745303 were undertaken using modified zoom bands to include the NH3 (4,4) and (5,5) transitions. Deep ON/OFF pointing is where one beam-sized ’ON’ region is observed, and calibrated using a single, beam-sized ’OFF region and are used in this study to provide extra sensitivity over mapping data. The FWHM of the Mopra beam within the 12 mm band varies between 1.7 arcmin at the highest observed frequency in this data (27.5 GHz) and 2.4 arcmin at the lowest observed frequency (19.5 GHz) (Urquhart et al., 2010). The mapping data, as with HOPS, uses MOPS in on-the-fly mapping mode with two scanning directions, Galactic longitude and latitude, in order to reduce scanning artefacts and noise. Each 0.50.5∘ map took approximately 90 mins for each pass. Deep ON/OFF pointings were were undertaken for 60 mins in selected regions where extra sensitivity was required. The mapping regions of our dedicated observations with HOPS-equivalent exposure have a mean Trms of K per channel. Mapping regions with deeper coverage had four times the exposure, and so achieved a Trms 0.1 K per channel. Position-switched deep ON/OFF observations achieved a Trms of 0.02 K per channel.
We applied the methods of Ungerechts et al. (1986) to estimate the NH3 column density (), the kinetic temperature (TK) and the H2 density () of the molecular clumps from the detected emission lines NH3 (J,K), J=K=1,2. The masses of molecular clumps are presented and discussed for six unidentified sources in detail in Section 4. For clumps where all data are from HOPS the NH3 gas parameters are presented in Purcell et al. (2012). Since our study is particularly interested in those unidentified TeV sources towards star forming regions, the TeV sources which are toward molecular clumps displaying H2O maser emission and/or H emission are listed in Table. 2.
2.1 TeV/Molecular Clump overlap
Dense molecular clouds were included based on their emission in the NH3 (1,1) transition. The NH3 data were smoothed over five velocity channels ( km/s), improving the integrated S/N by a factor of . We have classified molecular clouds as significant if their peak emission is > 3, where . Molecular clumps were identified as being towards the TeV emission if the clump centroid position fell within a 3 radius from the TeV centroid, and adjacent to the TeV emission if the clump centroid position fell between a 3 and 5 radius range from the TeV centroid, where is the intrinsic rms of the TeV sources quoted in publication (relevant publications are noted in Table. 1).
[b] H.E.S.S. name Alternative name l b NH3 (1,1) NH3 (1,1) TeV position/size towards adjacent reference HESS J1023575 Westerlund 2 284.22 0.40 - - 1 HESS J1119614 292.10 0.49 - - 24 HESS J1303631 304.24 0.36 ✓ - 2 HESS J1418609 Kookaburra(Rabbit) 313.25 0.15 - ✓ 3 HESS J1420607 Kookaburra(PWN) 313.56 0.27 ✓ ✓ 3 HESS J1427608 314.41 0.14 ✓ ✓ 4 HESS J1457593 G318.2+0.1 318.36 0.43 - ✓ 5 HESS J1503582 319.62 0.29 - - 6 HESS J1614518 331.52 0.58 - ✓ 4 HESS J1616508 332.39 0.14 ✓ ✓ 7 HESS J1626490 334.77 0.05 ✓ ✓ 4 HESS J1632478 336.38 0.19 ✓ ✓ 4 HESS J1634472 337.11 0.22 ✓ ✓ 4 HESS J1640465 338.32 0.02 - ✓ 7 HESS J1641463 338.52 0.09 ✓ - 22 HESS J1646458 Westerlund 1 339.55 0.35 ✓ ✓ 8 HESS J1702420 344.30 0.18 ✓ ✓ 4 HESS J1708410 345.68 0.47 - ✓ 4 HESS J1713397 RX J1713.73946 347.34 0.47 ✓ ✓ 9 HESS J1713381 CTB 37B 348.65 0.38 - - 7 HESS J1714385 CTB 37A 348.39 0.11 - - 10 HESS J1718385 348.83 0.49 - - 11 HESS J1729345 353.44 0.13 ✓ - 12 HESS J1731347 353.54 0.67 - ✓ 12 HESS J1741302 358.4 0.19 - - 13 HESS J1745303 358.71 0.64 ✓ ✓ 7 HESS J1800240A 6.14 0.63 ✓ - 14 HESS J1800240B 5.9 0.37 ✓ - 14 HESS J1800240C 5.71 0.06 - ✓ 14 HESS J1801233 W28 6.66 0.27 ✓ - 14 HESS J1804216 8.4 0.03 ✓ - 7 HESS J1808204 9.96 0.25 - - 23 HESS J1809193 11.18 0.09 ✓ ✓ 11 HESS J1813178 12.81 0.03 - ✓ 7 HESS J1818154 SNR G15.40.1 15.41 0.17 ✓ - 15 HESS J1825137 17.71 0.7 - ✓ 7 HESS J1828099 21.49 0.38 - - 22 HESS J1831098 21.85 0.11 - - 16 HESS J1832093 22.48 0.16 ✓ - 17 HESS J1832085 23.21 0.29 - - 24 HESS J1834087 23.24 0.31 ✓ - 7 HESS J1837069 25.18 0.12 ✓ ✓ 7 HESS J1841055 26.8 0.2 ✓ ✓ 4 HESS J1843033 29.3 0.51 ✓ ✓ 18 HESS J1844030 29.41 0.09 - - 24 HESS J1846029 29.7 0.24 - - 19 HESS J1848018 31.0 0.16 ✓ - 20 HESS J1858020 35.58 0.58 - - 4 HESS J1912101 44.39 0.07 ✓ - 21
- 1
- 2
- 3
- 4
- 5
- 6
- 7
- 8
- 9
- 10
- 11
- 12
- 13
- 14
- 15
- 16
- 17
- 18
- 19
- 20
- 21
- 22
- 23
- 24
The NH3 (1,1) transition and five further specific molecular transitions were searched for in our study towards the molecular clouds detected with NH3 (1,1) emission. The transitions were chosen based on their ability to trace star forming regions at various evolutionary phases and broad line gas within dense cloud cores. Three inversion-rotation transitions of NH3, NH3 (J,K): J=K=1,2,3 were chosen in order to estimate gas temperature and density of molecular clumps as well as to identify regions of broad line emission, and unusual gas dynamics. The H2O maser transition at 12 mm was chosen to identify regions of ongoing star formation which may not show up in infra-red observations, and the radio recombination line H was chosen to identify regions of ionised gas where high mass stars have been recently formed. The cyanopolyyne transition HC3N(3-2) was chosen as it, and other cyanopolyyne transitions, are thought to trace early stages of core evolution while NH3 tends to become more abundant at later stages (Suzuki et al., 1992). The detections of these six molecular transitions are summarized in Table 2.
3 Results overview
Out of the 49 TeV sources included in our study, NH3 (1,1) emission was detected towards or adjacent to 38 of them (see Table 1 for a full list). Between one and nine molecular clumps are seen towards or adjacent to each TeV source. Around half of the molecular clumps detected in NH3 (1,1) emission display NH3 (2,2) emission and around one third display NH3 (3,3) emission. HC3N (3-2) emission is detected in around one third of molecular clumps, as is the H2O maser transition, while H emission is seen towards less than one fifth of molecular cores. These results are summarised in Table 2.
| TeV Source | NH3 | NH3 | NH3 (1,1) | kinematic | distance | NH3 | NH3 | HC3N | H2O | H69 |
|---|---|---|---|---|---|---|---|---|---|---|
| (1,1) | (1,1) | VLSR | near | far | (2,2) | (3,3) | (3-2) | (6-5) | ||
| l | b | (km/s) | (kpc) | (kpc) | ||||||
| HESS J1729345 | 353.3 | 0.1 | 16.1 | 3.8 | 10.3 | - | - | - | - | - |
| HESS J1731347 | 353.4 | 0.3 | 18.7 | 4.3 | 9.8 | ✓ | ✓ | ✓ | - | - |
| HESS J1745303 | 358.4 | 0.5 | 6.5 | - | - | ✓ | - | - | ✓ | - |
| 358.5 | 0.4 | 3.7 | 2.6 | 10.5 | ✓ | ✓ | - | ✓ | - | |
| 358.6 | 0.8 | 2.7 | 19.5 | - | ✓ | - | ✓ | - | - | |
| 358.6 | 0.4 | 6.7 | 6.3 | - | - | - | - | - | - | |
| 358.8 | 0.4 | 29.7 | - | - | ✓ | ✓ | ✓ | - | - | |
| 358.8 | 0.5 | 54.0 | - | - | ✓ | ✓ | ✓ | - | - | |
| HESS J1800240C | 5.6 | 0.1 | 27.2 | - | - | ✓ | ✓ | ✓ | ✓ | - |
| 5.8 | 0.2 | 12.0 | 3.5 | 10.7 | - | - | - | - | - | |
| HESS J1800240B | 5.9 | 0.4 | 7.7 | 2.3 | 11.9 | ✓ | ✓ | ✓ | ✓ | ✓ |
| 5.9 | 0.3 | 9.0 | 2.6 | 11.5 | ✓ | - | ✓ | - | - | |
| HESS J1800240A | 6.6 | 0.3 | 6.0 | 1.6 | 12.6 | ✓ | ✓ | - | - | - |
| 6.8 | 0.3 | 20.1 | 4.7 | 9.3 | ✓ | - | ✓ | ✓ | - | |
| HESS J1804216 | 8.1 | 0.2 | 18.0 | 3.7 | 10.5 | ✓ | ✓ | - | - | ✓ |
| 8.3 | 0.2 | 17.1 | 3.5 | 10.7 | ✓ | - | - | - | - | |
| 8.4 | 0.3 | 36.7 | 6.7 | - | ✓ | ✓ | ✓ | - | - | |
| 8.7 | 0.4 | 36.7 | 6.4 | - | ✓ | ✓ | ✓ | ✓ | - |
3.1 NH3 Linewidths
The FWHM of the NH3 main line is often used as a measure of the total energy (thermal plus non-thermal) associated with a molecular clump. Broader lines are expected from regions with higher temperatures or additional dynamics (due to turbulence, infall, outflow or tidal flow). The purely Maxwell-Boltzmann thermal linewidth FWHM expected from a gas at temperature T is given by:
| (1) |
where k is Boltzmann’s constant and is the mass of the NH3 molecule. For a temperature of 15 K, as might be expected in typically cold, dense NH3 cores, a thermal linewidth of 0.20 km.s-1 is obtained, (Ho & Townes, 1983). The line FWHM, of each core was estimated from a Gaussian fit to the main peak of the emission with additional Gaussians to fit each of the four satellite lines, which are generally resolved in the (1,1) transition.
The FWHM for all molecular clumps identified in our study is noticeably wider than that expected from purely thermal broadening, suggesting additional non-thermal or kinetic energy which dominates over broadening from the instrumental response, which in zoom mode at 12 mm provides a velocity resolution of km/s (Urquhart et al., 2010). Typical linewidth FWHMs observed for NH3 emission in our study are from 1-2 km/s, but in a few cases, very broad linewidths (> 10km/s) are observed. For NH3 (1,1) emission with very broad linewidths, the satellite lines are blended with the main line which makes fitting the five Gaussian components non-trivial. For these sources, the NH3 (2,2) linewidth (assumed to be unaffected by satellite line blending) was used as an upper limit to the width of the NH3 (1,1) main line, and a temperature and density calculated based on this fit. The TeV sources towards which these very broad linewidths are found, HESS J1801233 (the TeV source to the NE of the SNR W28 towards a SNR/molecular cloud interaction region) (Nicholas et al., 2011) and HESS J1745303 (Aharonian et al., 2008c), are both thought to be produced hadronically through interaction of accelerated protons and dense gas. The broad linewidths observed towards these sources, together with coincident broad SiO(1-0) emission (which can be seen in Nicholas et al. (2012) for HESS J1801233 and in an upcoming paper for HESS J1745303), indicates the previous passage of a shock through this gas.
3.2 Ortho-to-para NH3 Abundance Ratios
Para NH3 (1,1) and NH3 (2,2) detections (as well as ortho NH3 (3,3) detections when available) and the LTE methods summarised in Ungerechts et al. (1986) were used to determine the rotational temperatures of all molecular clumps towards TeV sources in the HOPS dataset. Towards HESS J1745303 and HESS J1801233 where NH3 (3,3) detections were made, it was noticed when calculating rotational temperatures that the optical depths did not decrease with increasing J (as would be expected) and the NH3 (3,3) brightness temperature > NH3 (1,1) brightness temperature which is shown in Figs 2 and 9 as well as the spectra in Figs 3, 5, 7, 10 and 12. Subsequently, in this work, where NH3 (3,3) brightness temperature > NH3 (1,1) brightness temperature, the NH3 (J,K), J=K > 2 emission is not expected to represent the same excitation temperature as the NH3 (1,1) transition and so it is assumed that the NH3 (J,K) J=K=3,4,5,6 emission is optically thin. The molecular clumps towards HESS J1745303 and HESS J1801233 with NH3 (3,3) brightness temperature > NH3 (1,1) brightness temperature were found to have extended emission in all four of the metastable ammonia transitions considered in the HOPS observations (NH3 (J,K) J=K=1,2,3,6). The molecular clouds towards both HESS J1745303 and HESS J1801233 exist close to supernova remnants (SNRs) that are interacting with molecular clouds, evident by 1720 MHz OH masers. In addition, 7 mm observations of the regions displaying NH3 (3,3)-to-NH3 (1,1) brightness temperature ratios > 1 revealed extended SiO (1-0) emission which matches the morphology of the NH3 emission.
Upper state column densities for each transition were calculated using the LTE analysis summarised by Ungerechts et al. (1986). These values were divided by the total degeneracy (angular momentum degeneracy, g as well as spin and K degeneracy) and used to plot rotation diagrams. Rotation diagrams shown in Figs 4, 6, 8, 11 and 13 include upper-state column densities of each observed transition towards each region of extended NH3 emission where NH3 (3,3) brightness temperature NH3 (1,1) brightness temperature. The rotation temperature of para NH3 was estimated separately for the NH3 (J,K) J=K=1,2 transitions and the NH3 (J,K) J=K=4,5 transitions. The rotational temperature of ortho NH3 was estimated using the NH3 (J,K) J=K=3,6 transitions, and it is assumed that T T45.
ON/OFF deep pointing observations were taken at three positions towards HESS J1745-303, and two positions towards HESS J1801233. These regions indicated in Fig. 2, which were chosen due to their high NH3 (3,3)-to-(1,1) brightness temperature ratios, and Fig. 9 which were chosen due to their positions immediately post shock and pre shock where the shock position is traced by 1720 MHz OH masers. The method of Umemoto et al. (1999) was used to estimate the ortho-to-para NH3 abundance ratio. Figs 4, 6, 8, 11 and 13 display a straight line fit to the derived NH3 (4,4) and (5,5) column densities, where 1/slope = Trot. This rotational temperature was compared to the Trot fit for the ortho NH3 (3,3) and (6,6), and in many cases the lines fitting each pair of column densities is almost parallel (indicating an equivalent Trot). Ortho-to-para NH3 abundance ratios were estimated and used to produce reduced ortho NH3 (3,3) and (6,6) column densities (ROCDs) according to
| (2) |
where is the upper state ortho NH3 column density for each transition, and is the estimated NH3 ortho-to-para abundance ratio. These ’reduced’ ortho NH3 column densities were then optimised with least squares fitting with a straight line fit to all NH3 (J,K) J=K=3,4,5,6 column densities. The ortho-to-para abundance ratio which gives the best fit is given in Table. 3.
| TeV Source | Trot | Trot | Trot | Trot | |
|---|---|---|---|---|---|
| and region | para | ortho | para | (3,3)-(6,6) | OPR |
| (1,1),(2,2) | (3,3),(6,6) | (4,4),(5,5) | (reduced ortho) | best fit | |
| (K) | (K) | (K) | (K) | ||
| HESS J1745303 | |||||
| region 1 | 68 | 222 | 239 | 224 | |
| region 2 | 64 | 256 | 232 | 234 | |
| region 3 | 91 | 247 | 181 | 239 | |
| HESS J1801233 | |||||
| region 1 | 108 | 285 | 360 | 291 | |
| region 2 | 143 | 259 | - | - | > 2.0* |
It can be see in Table. 3 that for all three regions investigated towards HESS J1745-303, a an OPR 1 is indicated (see Table. 3). We believe an OPR 1 indicates the previous passage of a shock through a gas cloud (see Section 1). The regions observed towards HESS J1745303 with an OPR 1 lie outside the boundary of the SNRs in the region indicating that another shock is responsible for the enhancement of ortho-NH3 over para-NH3. Several radio continuum point sources, centred on a molecular CO (1-0) ring in the region, may be remnants of an OB association responsible for a superbubble (Uchida et al., 1992).


ON-OFF deep pointing observations were taken at two positions towards HESS J1801233. These regions are indicated in Fig. 9 and were chosen due to their positions immediately post shock and pre shock where the shock position is traced by 1720 MHz OH masers.
For HESS J1801233, the method used here cannot determine whether the OPR is enhanced in the regions indicated in Fig. 9. Region 1 is immediately post shock and region 2 is immediately pre-shock where the shock position is traced by 1720 MHz OH masers. The best fit indicates that the OPR is enhanced in both regions which is consistent with a previous study (Maxted et al., 2016) using NH3 (J,K), J=K=1,2,3,4,6 to estimate the OPR in region 1. For region 2 (indicated in Fig. 9) the rotational temperature for NH3 (1,1) and (2,2) fits to the column densities of transitions up to the NH3 (4,4) upper limit (as can be seen in Fig. 13), which may indicate that the higher J NH3 (5,5) and (6,6) transitions are tracing a higher temperature component of the gas. If this were the case, the lower limit OPR for this region would not reflect the conditions of the gas. An enhanced OPR would not be expected in this region. In region 1 (indicated in Fig. 9), the post shocked region, the determined OPR is consistent with 1, within errors, however an enhanced OPR could be expected in this region.


3.3 TeV emission from PWNe
Pulsar Wind Nebulae or old relic PWNe are thought to be responsible for the TeV emission from many of the unidentified Galactic gamma-ray sources (Chang et al., 2008; Mattana et al., 2009). The population of likely TeV PWNe is thought to include 27 sources (de Oña-Wilhelmi et al., 2013), although many of these sources do not have associated, observed pulsars. Gallant et al. (2008) have identified seven TeV sources as confirmed PWNe. We have added HESS J1303631 to this list as it has been since confirmed as a PWN (H.E.S.S. Collaboration et al., 2012), and meets the same requirements for confirmed PWNe proposed by Gallant et al. (2008).
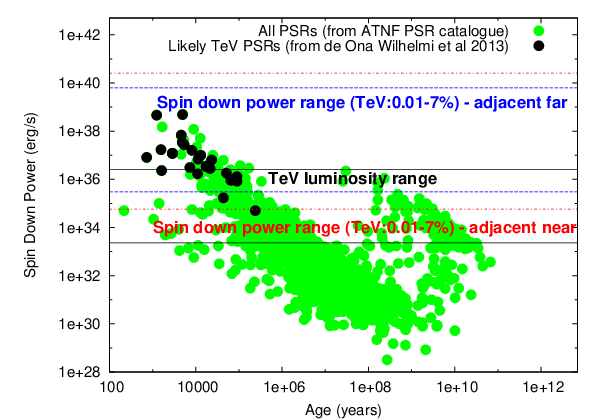
In order to assess whether TeV sources in our study meet energetics constraints provided by confirmed PWNe, we have assumed that the TeV emission is at the same distance as the dense molecular gas traced by NH3 (1,1) emission and scaled the TeV luminosity of each source accordingly. We then calculated the range of spin down powers a pulsar producing this emission could have if the TeV emission was between 0.01% and 7% of the pulsar spin down power (as is the case for the population of seven confirmed PWN in Gallant et al. (2008)). In Fig. 14, the range of TeV luminosities for all TeV sources included in this study, along with the range of spin down powers these luminosities would translate to, with minimum and maximum TeV efficiencies of 0.001% and 7% respectively. It can be seen that, even with minimum TeV efficiency, the range of inferred spin down powers is between 1034erg/s and 1039erg/s, a range consistent with the population of pulsars likely to have an association with TeV emission identified by de Oña-Wilhelmi et al. (2013). Therefore all of the TeV sources included in this study of dense gas detected by NH3 (1,1) adjacent to TeV emission meet energetics requirements to be Galactic pulsar wind nebulae.
In addition, we believe the range of inferred spin down powers in Fig. 14 indicates that there could be a population of older TeV emitting PWNe, in the population of TeV sources included in this study, with a higher TeV efficiency (i.e. close to the maximum current TeV efficiency seen of 7%, or even greater), which do not yet have associated, detected pulsars considered likely to have an association with TeV emission identified by de Oña-Wilhelmi et al. (2013). This population of TeV emitting PWNe is likely to become more apparent with the increasing sensitivity of TeV gamma-ray observations.
This method has not allowed for discrimination based on energetics requirements for those sources which are currently unidentified, which may be PWNe. Fig. 14 demonstrates this as TeV luminosities derived for all molecular cores detected in our study fall within the expected range for TeV emitting PWNe. This study is useful for more detailed studies for individual TeV sources which compare the morphology of dense gas with the TeV emission (Voisin et al., 2016, e.g.). In the case of PWNe, which are produced leptonically through inverse Compton emission, the TeV emission often exhibits asymmetric morphology, and is expected to anti-correlate with molecular gas. This asymmetry can be explained by an inhomogeneous distribution of interstellar gas around pulsars which strongly influences their development (Blondin et al., 2001, e.g.). This study can be used to search for dense gas anti-correlated with asymmetric morphology of TeV emission to identify relic PWNe. In addition, these relic PWNe would be less likely to display 2-10 keV X-ray emission than the younger PWNe, in accordance with the ratio of gamma-ray to X-ray flux identified by Mattana et al. (2009) to increase with PWNe age.
4 Discussion of Six Prominent Unidentified TeV sources
Six TeV sources which have not been unambiguously connected to any counterpart at other wavelengths are discussed in detail here. These sources were chosen for their coincidence with star formation regions as evident by IR emission, H2O masers and/or H69 emission or, as for HESS J1745-303, an anomalous NH3 ortho-to-para brightness temperature ratio. Images of the peak pixel brightness temperature between velocities of km/s and km/s of various molecular transitions along with spectra towards selected molecular gas clumps and infra-red features are displayed in Figures 15 to 26. A discussion of notable gas and infra-red features is included in the following section. The molecular transition gas maps seen in Fig. 15 to 25 have been chosen based on significant emission (defined as > 3, where ) seen towards or adjacent to the TeV emission. Maps of the other transitions searched for are not shown. Kinematic distance solutions and molecular clump masses for the dense gas (traced by NH3 (1,1) emission) towards, and adjacent to, the six TeV sources discussed in this section are presented in Table 4.
For the sources for which the TeV could possibly originate from cosmic ray protons, a simple calculation of diffusion time has been used to help assess the plausibility of the TeV emission coming from interactions between cosmic rays from a nearby accelerator and dense gas catalogued in this survey.
To calculate the distance travelled by cosmic ray protons in a given time, , we have used:
| (3) |
where is the diffusion coefficient dependent on maximum proton energy, and magnetic field according to:
| (4) |
from Gabici et al. (2007). is the average Galactic diffusion coefficient (Berezinskii et al., 1990), is the diffusion suppression coefficient (assumed to be inside molecular cores; 1 outside) (Berezinskii et al., 1990; Gabici et al., 2007). The magnetic field strength as a function of density cm-3 using:
| (5) |
was taken from Crutcher (1999) based on their Zeeman splitting measurements in molecular clouds.
| TeV Source | NH3 | NH3 | NH3 (1,1) | kinematic | distance | H2 | H2 | |
|---|---|---|---|---|---|---|---|---|
| (1,1) | (1,1) | VLSR | near | far | mass (near) | density | ||
| l | b | (km/s) | (kpc) | (kpc) | M⊙ | (cm-2) | (cm-3) | |
| HESS J1626490 | 334.71 | 0.04 | 86.46 | 5.5 | 8.6 | 0.2 | 7.7 | 1.3 |
| HESS J1640465 | 338.09 | 0.01 | 40.00 | 3.3 | 11.2 | 1153 | 8.4 | 5.8 |
| 338.33 | 0.14 | 36.59 | 3.1 | 11.4 | 100 | 1.3 | 1.2 | |
| 338.47 | 0.04 | 37.01 | 3.2 | 11.3 | 975 | 5.2 | 3.1 | |
| HESS J1729345 | 353.28 | 0.06 | 16.09 | 3.9 | 10.2 | - | - | - |
| HESS J1745303 | 358.37 | 0.46 | 6.50 | - | - | 353 | 1.2 | 0.6 |
| 358.46 | 0.38 | 3.73 | 3.3 | 9.3 | 186 | 2.4 | 2.2 | |
| 358.59 | 0.81 | 2.66 | 19.4 | - | - | |||
| 358.64 | 0.40 | 6.71 | 6.3 | - | 0.1 | 0.4 | 6.7 | |
| 358.80 | 0.36 | 29.73 | - | - | 23827 | 11.1 | 2.0 | |
| 358.81 | 0.51 | 54.02 | - | - | - | |||
| HESS J1804216 | 8.14 | 0.22 | 17.96 | 3.7 | 10.5 | 517 | 3.0 | 1.8 |
| 8.25 | 0.17 | 17.10 | 3.5 | 10.7 | 212 | 1.4 | 1.0 | |
| 8.40 | 0.28 | 36.71 | 6.7 | - | 7669 | 3.4 | 0.6 | |
| 8.68 | 0.40 | 36.71 | 6.4 | - | 8091 | 4.8 | 1.0 | |
| HESS J1848018 | 30.72 | 0.07 | 92.16 | 5.2 | 9.2 | 1942 | 6.3 | 2.9 |
| 30.78 | 0.08 | 94.30 | 5.1 | 9.1 | 1.2 | 4.8 | 8.1 | |
| 30.81 | 0.04 | 93.87 | 5.1 | 9.1 | 1909 | 5.9 | 2.6 | |
| 30.98 | 0.14 | 77.25 | 4.4 | 10.0 | - | - | - |
4.1 HESS J1745303
HESS J1745303 in Fig. 15 is a source where NH3 (1,1) emission is coincident with the TeV peak. Of particular interest here is the broad line emission of all thermal molecular line transitions towards the TeV centroid. HESS J1745303 partially overlaps both the molecular cloud and the SNR G. The SNR G interacts with a molecular cloud as evident by a cluster of 1720 MHz OH masers towards the SNR rim. This SNR has been attributed to producing this broad line emission, however the broad line emission has a kinematic velocity which differs from that of the masers by around 50 km/s and the broad emission line region lies outside the boundary of the SNR observed in radio continuum (see Fig. 15 where the SNR boundary is indicated). Broad line molecular gas is only observed towards one region of the gamma-ray emission, defined as region A by Aharonian et al. (2008c) (and indicated in Fig. 15), which includes the highest TeV gamma-ray significance region, the 7 contour. The molecular line emission detected in our study, within the 7 significance contour, includes this broad emission line cloud (FWHM > 10 km/s), the spectra of which are displayed in the LHS of Fig. 15. In addition to broad emission lines, NH3 (3,3) emission is observed to have a higher peak brightness temperature than NH3 (2,2) and (1,1). As discussed in Section 3.2, this molecular cloud has an enhanced ortho-to-para NH3 abundance ratio which we believe is due to the previous passage of a shock through the cloud. The nature of the shock is not clear as this gas is outside the boundary of the observed SNRs in the region. Non-thermal broadening (i.e. from turbulence) of these spectral lines dominates over the thermal broadening ( 4 km/s) which further supports that a shock as passed through this molecular cloud. This will be discussed in more detail in a future study (de Wilt, P. & Rowell, G. in preparation).
There are several other potential sources of cosmic-ray hadrons and/or electrons in the region which include two energetic pulsars, an additional SNR, G359.0-0.9, (all of which are indicated in Fig. 15) and a further radio continuum feature seen in archival data taken as part of the Molonglo Galactic Plane Surveys (Green, 1999), which, could potentially be another SNR (de Wilt, P. & Rowell, G. in preparation).
Previous studies have discussed the lack of molecular cloud emission towards the West and South-West components of TeV emission in HESS J1745303 (Aharonian et al., 2008c; Hayakawa et al., 2012, e.g.). Our study confirms a lack of broad molecular line emission towards these components of TeV emission, and therefore suggests that there is no Galactic ridge molecular cloud counterparts to the West and South-West components of the TeV source. We have identified dense molecular gas through NH3 transitions which are found towards region B (as defined by Aharonian et al. (2008c) and seen in Fig. 15) which may be associated with the TeV emission. The NH3 emission from these dense gas cloud cores exhibits narrow linewidths ( 4 km/s) which suggests that the emission is foreground or background to the Galactic Centre. Purcell et al. (2012) state that the sensitivity of the HOPS observations mean that it is unlikely that any emission seen is background to the Galactic Centre, which makes it likely that these clouds are foreground to the GC. The association between this newly detected gas and the TeV emission is being investigated further and the results will be presented in a future paper. The narrow line NH3 (1,1) emission extent and spectrum can be seen in Fig. 15.
Fig. 16 shows that no active star formation is seen overlapping the TeV centroid in either the Spitzer infra-red bands nor in the molecular tracers used in our study. A similar situation is seen towards HESS J1801233, the TeV peak towards the interacting SNR W28 (Nicholas et al., 2011). The lack of IR emission here supports the interpretation of the broad line emission not being associated with heating due to star formation processes, but perhaps due to additional energetics such kinetic energy provided by a shock which has passed through the gas cloud. As the gas lies outside the boundary of the SNR G359.1-0.5 as seen in radio continuum, we propose that there has been another shock which has passed through the cloud, producing the post-shocked gas characteristics of broad line emission, an ortho-to-para brightness temperature ratio > 1 as well as extended SiO (1-0) emission.


4.2 HESS J1640465
Fig. 17 displays NH3 (1,1) emission towards the edges of the TeV gamma-ray source HESS J1640465. The gamma-ray emission is seen towards the SNR G338.30.0 and a giant Hii region G338.4+0.1, both detected in radio continuum at 843 MHz (Whiteoak & Green, 1996). The faint ASCA X-ray source AX J1640.74632 (Sugizaki et al., 2001, see) is coincident with HESS J1640465, as is the Fermi-LAT source 3FGL J1640.44634. A separate TeV source named HESS J1641463, with a harder spectral index, to the edge of this TeV source is seen (Lemoine-Goumard et al., 2014, see) towards the SNR G338.5+00.1. The molecular line emission seen in HOPS data shows broad ( km/s) NH3 emission in the (1,1) to (3,3) inversion transitions, indicative of shocked/excited gas towards the giant Hii region G338.40.1, located between the two TeV sources. Several H2O masers (Walsh et al., 2011) are seen towards and surrounding this TeV source (seen in Fig. 17), indicating the ongoing star formation in the region. All of the detected molecular line transitions have a far kinematic distance matching that of both of the SNRs in the region (11 kpc, Kothes & Dougherty 2007).
The pulsar PSR J16404631 has been recently discovered by Gotthelf et al. (2014), using the Nuclear Spectroscopic Telescope Array (NuSTAR), towards HESS J1640465 with a a spin-down luminosity of 4.4 erg s-1. The pulsed X-ray emission and the TeV centroid of HESS J1640465 occur at the centre of the SNR G338.30.1. This, together with the morphology of the molecular material detected in our study (which surrounds the TeV emission), may favour a PWN model for the TeV emission. Rescaling the TeV flux (> 1 TeV) to the distance of the SNRs and NH3 emission gives a gamma-ray luminosity of erg/s. Assuming that PSR J16404631 is linked to SNR G338.20.0, and so is at a distance of 11 kpc, and is powering the PWN HESS J1640465, the apparent efficiency of PSR J16404631 would be 0.05%, within the range of confirmed TeV PWNe, to (Gallant et al., 2008).
3FGL J1640.44634, also catalogued as 1FGL J1640.84634, the Fermi-LAT GeV source coincident with HESS J1640465, has a spectrum (from five years of Fermi-LAT data) which joins smoothly to the TeV spectrum (Lemoine-Goumard et al., 2014). This smooth spectrum from GeV to TeV favours a hadronic origin to the TeV gamma-rays, and has been reproduced by a hadronic model of HESS J1640465 (Lemoine-Goumard et al., 2014), however the spectrum can also be reproduced by fine tuning to a leptonic, PWN model (Gotthelf et al., 2014, see), and so this possibility cannot be ruled out.
Adjacent to HESS J1640465 is the TeV source HESS J1641463 (Abramowski et al., 2014). This source has a harder spectral index than HESS J1640465 and several possible counterparts including SNR G338.50.1, several X-ray sources (which may point towards a PWN scenario) have been identified (Abramowski et al., 2014). HESS J1641463 could also be a TeV binary system, although no variability in TeV gamma-rays or X-rays has been observed in current data (Abramowski et al., 2014). The spectrum of the GeV source 3FGL J1641.14619c is very soft (Lemoine-Goumard et al., 2014, see), compared to the hard TeV spectrum detected by H.E.S.S. (Abramowski et al., 2014) which suggests different origins for the GeV and TeV gamma-rays. Lau et al. (2017) have used observations of many molecular and atomic transitions towards HESS J1640465 and HESS J1641463 to gain an understanding of total gas distribution and mass to explore both hadronic and leptonic TeV emission scenarios. Lau et al. (2017) find that in a hadronic origin for the gamma-ray emission, the cosmic-ray enhancement rates are and times the local solar value for HESS J1640465 and HESS J1641463 respectively. In the hadronic case, if HESS J1641465 were produced by runaway protons from the SNR G338.30.0 and applying the diffusion distance estimate according to Equation 3, protons of 100 TeV would take 10,000 yrs to travel from the SNR to the second TeV source if moving through the dense gas. In this case, however, we would expect the TeV gamma-rays to peak along with the density of molecular gas, which, as can be seen in Fig. 17 appears not to be the case. As outlined by Lau et al. (2017), and which can be seen in Table 2, in the highest density region, there are molecular cloud cores at different distances along the line of sight, which could allow for CR diffusion between them. This would allow for the CRs to diffuse faster, and using the diffuse gas parameters of Lau et al. (2017), we calculate that 100 TeV protons would take 1600 yrs to diffuse from SNR G338.30.0 to HESS J1641463. As the age of SNR G338.30.0 has been estimated from 1-2 kyr up to 5-8 kyr, this would allow time for VHE CRs to travel from SNR G338.30.0 to produce the TeV emission from HESS J1641463, between dense cloud cores (as outlined in Lau et al. (2017)).


4.3 HESS J1848018
HESS J1848018 is located towards the W43 star forming region. No obvious counterparts for the TeV emission such as SNRs or energetic pulsars are seen towards HESS J1848018 (Chaves et al., 2008). The high mass stellar cluster W43 is offset from the centroid of the TeV emission within a giant molecular cloud with mass M⊙ detected in both sub-millimetre wavelengths (Motte et al., 2003) and 13CO (Jackson et al., 2006). This cluster contains the high mass binary system, WR 121a, catalogued by van der Hucht (2001) and classified as a colliding wind binary (CWB) by Anderson et al. (2011). Our observations (Fig. 19) reveal broad NH3 emission lines in the giant molecular cloud as well as H2O maser emission and H69 emission indicative of ongoing star formation and ionised gas towards WR 121a. The H69 emission traces the Hii region G30.80.0 (Lester et al., 1985). The infra red dark cloud (IRDC) G030.9700.14, catalogued by Rathborne et al. (2006), is seen towards the TeV centroid in Fig. 20, overlapping a gas clump detected in NH3 (1,1) by our study. Spectra towards this gas clump are displayed on the LHS of Fig. 19, which show H2O maser emission, indicative of active star formation. Due to the coincident IRDC, we suggest that this is an early star formation region, slightly foreground to the W43 region which provides much of the extended, background 8m emission in Fig. 20 which is being absorbed by the cold, dense gas.
Colliding wind binaries are expected to produce leptonic gamma-ray emission through Inverse Compton (IC) scattering up to a few GeV (Pittard & Dougherty, 2006; De Becker & Raucq, 2013, e.g.). Theoretical models suggest that, given a suitable environment, stellar winds which are ejected during the high mass star evolution may also be able to accelerate hadrons as effectively as SNRs (see Farnier et al., 2011, and references therein). If the CWB WR 121a is indeed responsible for the TeV emission, then approximately 3 of the kinetic power of the wind-wind collision (estimated to be erg.s-1 in the system WR140 (Pittard & Dougherty, 2006)) is converted into TeV emission. This agrees with numerical simulations of relativistic collision-less shocks, which indicate that at least 10 of energy is converted into relativistic particles downstream of the shock (Spitkovsky, 2008).
Coincident with HESS J1848018 are the Fermi-LAT source 3FGL J1848.40141 (Acero et al., 2015) and HAWC source 1HWCJ1849017c (Abeysekara et al., 2016). While spectra of the HESS and HAWC sources have not been published, a continuous spectrum from Fermi-LAT energies up to tens of TeV (where HAWC is most sensitive) would point towards a hadronic origin to the gamma-rays, as leptonic sources are expected to cut off at lower energies. Further studies to determine the TeV morphology of HESS J1848-018 would be beneficial in determining whether the CWB WR 121a is a possible counterpart to the TeV emission. The cold, dense core detected by NH3 observations in our study towards the IRDC G030.9700.14 is within 2 arcmin of the TeV centroid and could provide a target for accelerated hadrons. A study of the morphology of more diffuse gas (i.e. that traced by 12CO(1-0) and Hi) is planned, and will give clues as to the origin of the TeV gamma-rays.


4.4 HESS J1626490
The centroid of HESS J1626490 is found within 0.5∘ of the SNR G which has been noted as a possible source of accelerated particles responsible for the TeV emission (Eger et al., 2011, see). An Hi void is seen in Southern Galactic Plane Survey (McClure-Griffiths et al., 2005, SGPS,) data between velocities of and km/s which is thought to correspond to the SNR (Eger et al., 2011). The GeV Fermi-LAT source 3FGL J1626.24911 is coincident with HESS J1626490, however the GeV and TeV spectra are not well matched and so the sources may not be associated. Our study reveals NH3 (1,1) emission towards the TeV peak which can be seen in Fig. 21. The NH3 (1,1) emission has a kinematic velocity of -86km/s, giving implied kinematic distance solutions 5.5 kpc (near) and 8.6 kpc (far). The position of the molecular clump traced by NH3 emission in our study corresponds to that of an IRDC which can be seen in Fig. 22. This indicates that it is foreground to the widespread IR emission. This IRDC, MSXDC G334.70+0.02, has been previously catalogued by Jackson et al. (2008). The widespread IR emission is assumed to originate from the complex containing the Hii region G, which has a distance of 12.8 kpc Russeil et al. (2005). Both the near and far kinematic distances of the NH3 clump are foreground to the Hii region so this does not resolve the distance ambiguity. HI absorption towards the SNR G335.2+0.1 seen in HI data from SGPS (McClure-Griffiths et al., 2005) indicates a SNR distance between 5.9 and 12.4 kpc. Assuming the SNR and NH3 detected molecular core are at the same distance, we can assign the far distance of 8.7 kpc to the NH3 (1,1) emission detected in this study. At a distance of 8.7 kpc, the distance for CR protons to travel from the SNR shell to the far side of HESS J1626-490 is 76 pc. Using equations 5 and 3 and assuming an average gas density of 1cm-3 towards the TeV emission, eV CR protons would take 5,300 yrs to traverse this distance, and lower energy cosmic rays would take a longer time. This would indicate a middle-aged or old SNR, at an age similar to other TeV emitting SNRs where a hadronic scenario is supported.


4.5 HESS J1804216
HESS J1804216 is seen towards a number of interesting features including SNR G8.70.1 (Odegard, 1986) and several Hii regions observed as part of catalogues (Kuchar & Clark, 1997; Lockman et al., 1996; Wink et al., 1982). The high spin down power ( erg/s) PSR J1803-2137 offers a plausible PWNe emission scenario for HESS J1804216. However, the nature of the TeV source and its association with the X-ray sources found towards this object is still unclear (Kargaltsev et al., 2007). There is a 1720 MHz OH maser along the border of SNR G8.70.1. This maser signals a shock interaction between the SNR and dense clouds (Frail & Mitchell, 1998) however, this maser is not coincident with the TeV emission as seen in Fig. 23. Several dense cloud clumps are seen in our study and are traced by the emission lines indicated in Table 2.
The dense gas seen in our study mainly surrounds the published extent of TeV emission. Thus, the morphology of the cool, dense gas supports a PWNe scenario for the TeV emission. However, there is infra-red poly-aromatic hydrocarbon (PAH) emission over the extent of the TeV emission, indicating that there is likely diffuse molecular material in this region not detected in our study. The lack of detected 12 mm emission towards the 1720 OH maser suggests that there are undetected molecular clouds in our study, since molecular material with a density cm-3 is needed to produce 1720 MHz OH maser emission (Wardle, 1999; Lockett et al., 1999). This additional molecular material as well as atomic material traced by Hi may provide enough target material for a hadronic origin of the TeV emission. Almost all NH3 (1,1) emitting clumps near HESS J1804216 display H2O maser emission (as seen in Fig. 23).
HESS J1804216 is one of the brightest unidentified TeV sources and so may provide the opportunity for improved angular resolution studies and energy dependent morphology studies in TeV gamma-rays, potentially reducing confusion between counterparts at other wavelengths. Further studies of molecular gas, including tracers of warmer and more diffuse gas such as 12CO(1-0), CS (1-0) and Hi emission should be undertaken in this region to account for more of the gas mass than is implied by our studies.


4.6 HESS J1729345
HESS J1729345 (aka HESS J1731347 B) is offset from a TeV shell, HESS J1731347 A (Abramowski et al., 2011b), and lies near the direction of the Hii region G353.3810.114 catalogued in Caswell & Haynes (1987) at a distance of > 7.5 kpc which is not traced in this study. Previously, this Hii region has been suggested as an indication for a molecular cloud complex, possible counterpart to HESS J1729345. This molecular cloud complex is seen, traced by PAH emission in Fig. 26. In this work a dense gas clump, traced with emission from the NH3 (1,1) transition is seen towards HESS J1729345, at a velocity of km/s. This gas feature is seen in Fig. 25 and also, as an IRDC in Fig. 26. As this molecular cloud is seen as an IRDC, we can deduce that the NH3 emission is foreground to the PAH emission which rules out the far kinematic distance solution of the NH3 and tells us that the NH3 cloud core is at 3.2 kpc. The kinematic distance of this gas feature is 3.8 kpc, within errors of a previous distance estimate of the SNR, based on it’s assumed connection to the compact Hii region G353.420.37, of 3.2 kpc (Tian et al., 2008). This is however foreground to a more recent SNR distance estimate of 5.2 - 6.2 kpc based on the assumption that the SNR is within the 3 kpc expanding arm (Fukuda et al., 2014). Further preliminary discussion about the distance of this source can be seen in Maxted et al. (2014) which details CS (1-0) emission.
If the molecular clump detected in this study was a counterpart to HESS J1729345, the TeV emission could arise from decay resulting from p-p collisions between cosmic-rays accelerated in the SNR. The SNR is at a distance of 3.2 kpc (Tian et al., 2008), as is the molecular clump towards HESS J1729345 traced by NH3 (1,1) in our study. At this distance and with an angular separation between the centre of the SNR and HESS J1729-345 of , the protons would have travelled approximately 30 parsecs. Using the method outlined in Section 2, it would take 140 yrs for a eV proton to diffuse from the SNR (HESS J1731347) to HESS J1729345 and 1400 yrs for a eV proton. With a SNR age estimate of 27,000 yrs (Tian et al., 2008), protons would have sufficient time to travel and interact with the molecular gas towards HESS J1729345 and produce the TeV emission.


5 Conclusions / Further Work
The first large scale systematic study of dense (> 104 cm-3) gas towards Galactic TeV sources has been completed. HOPS equivalent coverage provides a good first look at distribution and dynamics of dense gas towards Galactic TeV sources. Knowledge about gas density profiles towards TeV sources allows for more robust studies of cosmic ray diffusion. Preliminary results suggest 12 mm NH3 inversion transitions, used to estimate NH3 ortho-para ratios, could be used to search for regions of dense gas with previous shock activity. With this first look, we have found dense gas counterparts to unidentified regions of TeV emission including HESS J1745303B and HESS J1745303C as well as HESS J1848018 and HESS J1626490 which indicate it is likely there is a hadronic component to these sources.
Further observations of TeV sources showing dense gas overlap traced by the NH3 (1,1) emission seen in the H2O Galactic Plane Survey would be beneficial at millimetre wavelengths. Further 12 mm observations would provide more sensitivity to dense gas clumps traced by NH3 emission. Observations at 7 mm to trace molecular transitions such as SiO (1-0) which traces shocked gas and CS (1-0) which traces the denser features of gas clouds will provide better understanding of the mechanisms producing the relativistic particles producing the TeV gamma-rays as well as understanding the kinematics of the densest parts of gas towards these TeV gamma-ray sources. Further 12 mm observations which include the NH3 (4,4) and (5,5) transitions would be beneficial to estimate the NH3 OPR in sources which we have found an anomalous NH3 (3,3)-to-(1,1) brightness temperature ratio.
In addition, studies of particle transport within individual TeV sources should include not only the dense gas described here, but observations of moderately dense molecular gas, e.g. that traced by CO(1-0), and atomic gas, traced by HI, in order to understand density profiles of molecular clouds towards and adjacent to the TeV emission. The Mopra CO Survey (Burton et al., 2013) provides a large scale study for more diffuse gas towards Galactic TeV sources. With an angular resolution of 33 arcsec, and the inclusion of several isotopologues (including which help to trace a range of molecular gas densities, the Mopra CO Survey will provide the most accurate large scale look at molecular gas in the Milky Way for use with current and future gamma-ray data sets. The Mopra CO and HOPS angular resolution (33 arcsec and 1 arcmin respectively) and the future CTA angular resolution (2-3 arcmin between 1-10 TeV) are comparable and have the ability to resolve molecular cloud cores. In addition, all of these observations will cover a significant portion of the Galactic plane allowing for improved morphological comparison studies, and robust statistical studies of molecular gas and TeV gamma-rays. These higher resolution gas surveys will also provide a necessary picture of the distribution of Galactic gas to be used for new gamma-ray emission templates needed for higher angular resolution gamma-ray observations. HI gas is also an important contribution to the target gas mass for cosmic rays (Fukui et al., 2012, e.g.). Quantifying the contribution from HI has been improved with recent studies of optically thick HI in the ISM (Fukui et al., 2015, e.g.). The contribution of dark gas (both molecular and atomic) may also be important (Burton et al., 2015, e.g.).
Currently, a robust statistical study of the overlap between Galactic TeV emission and star forming regions is not possible due to confusion, sensitivity, and uneven coverage. Recent observations of the Large Magellenic Cloud (H.E.S.S. Collaboration et al., 2015a) have shown that superbubbles are capable of producing TeV emission, and it is suspected that we will find similar Galactic environments. As the angular resolution of TeV instruments improves, specifically with CTA, to match that of molecular gas studies (such as HOPS and MopraCO) and the sensitivity of molecular gas observations improves also, a much better understanding of the emission mechanisms and high energy particle transport in Galactic star forming regions will evolve.
Acknowledgements
This work was supported by an Australian Research Council grant (DP1096533). The Mopra Telescope is part of the Australia Telescope and, at the time of these observations, was funded by the Commonwealth of Australia for operation as a National Facility managed by CSIRO. The University of New South Wales Mopra Spectrometer Digital Filter Bank used for these Mopra observations was provided with support from the Australian Research Council, together with the University of New South Wales, University of Sydney, Monash University and the CSIRO. This research has made use of NASA’s Astrophysics Data System Bibliographic Services, the SIMBAD database, operated at CDS, Strasbourg, France (Wenger et al., 2000) and the ATNF Pulsar Catalogue (Manchester et al., 2005) which can be found at http://www.atnf.csiro.au/people/pulsar/psrcat/.
References
- Abeysekara et al. (2016) Abeysekara A. U., et al., 2016, ApJ, 817, 3
- Abramowski et al. (2011a) Abramowski A., et al., 2011a, A&A, 525, A46
- Abramowski et al. (2011b) Abramowski A., et al., 2011b, A&A, 531, A81
- Abramowski et al. (2012) Abramowski A., et al., 2012, A&A, 537, A114
- Abramowski et al. (2014) Abramowski A., et al., 2014, ApJ, 794, L1
- Acero et al. (2015) Acero F., et al., 2015, ApJS, 218, 23
- Aharonian et al. (2005) Aharonian F., et al., 2005, A&A, 439, 1013
- Aharonian et al. (2006a) Aharonian F., et al., 2006a, A&A, 449, 223
- Aharonian et al. (2006b) Aharonian F., et al., 2006b, A&A, 456, 245
- Aharonian et al. (2006c) Aharonian F., et al., 2006c, A&A, 457, 899
- Aharonian et al. (2006d) Aharonian F., et al., 2006d, ApJ, 636, 777
- Aharonian et al. (2007) Aharonian F., et al., 2007, A&A, 472, 489
- Aharonian et al. (2008a) Aharonian F., et al., 2008a, A&A, 477, 353
- Aharonian et al. (2008b) Aharonian F., et al., 2008b, A&A, 481, 401
- Aharonian et al. (2008c) Aharonian F., et al., 2008c, A&A, 483, 509
- Aharonian et al. (2008d) Aharonian F., et al., 2008d, A&A, 484, 435
- Aharonian et al. (2008e) Aharonian F., et al., 2008e, A&A, 490, 685
- Anderson et al. (2011) Anderson G. E., et al., 2011, ApJ, 727, 105
- Araudo & Rodríguez (2012) Araudo A. T., Rodríguez L. F., 2012, in Aharonian F. A., Hofmann W., Rieger F. M., eds, American Institute of Physics Conference Series Vol. 1505, American Institute of Physics Conference Series. pp 281–284 (arXiv:1210.3078), doi:10.1063/1.4772252
- Bednarek & Pabich (2011) Bednarek W., Pabich J., 2011, A&A, 530, A49
- Berezinskii et al. (1990) Berezinskii V. S., Bulanov S. V., Dogiel V. A., Ptuskin V. S., 1990, Astrophysics of cosmic rays
- Bergin et al. (2002) Bergin E. A., Alves J., Huard T., Lada C. J., 2002, ApJ, 570, L101
- Blondin et al. (2001) Blondin J. M., Chevalier R. A., Frierson D. M., 2001, ApJ, 563, 806
- Bosch-Ramon et al. (2010) Bosch-Ramon V., Romero G. E., Araudo A. T., Paredes J. M., 2010, A&A, 511, A8
- Braiding et al. (2015) Braiding C., et al., 2015, Publ. Astron. Soc. Australia, 32, 20
- Brand & Blitz (1993) Brand J., Blitz L., 1993, A&A, 275, 67
- Burton et al. (2013) Burton M. G., et al., 2013, Publ. Astron. Soc. Australia, 30, 44
- Burton et al. (2015) Burton M. G., et al., 2015, ApJ, 811, 13
- Casse & Paul (1980) Casse M., Paul J. A., 1980, ApJ, 237, 236
- Caswell & Haynes (1987) Caswell J. L., Haynes R. F., 1987, A&A, 171, 261
- Chang et al. (2008) Chang C., Konopelko A., Cui W., 2008, ApJ, 682, 1177
- Chaves et al. (2008) Chaves R. C. G., Renaud M., Lemoine-Goumard M., Goret P., 2008, in Aharonian F. A., Hofmann W., Rieger F., eds, American Institute of Physics Conference Series Vol. 1085, American Institute of Physics Conference Series. pp 372–375, doi:10.1063/1.3076684
- Cheung et al. (1969) Cheung A. C., Rank D. M., Townes C. H., Knowles S. H., Sullivan III W. T., 1969, ApJ, 157, L13
- Crutcher (1999) Crutcher R. M., 1999, ApJ, 520, 706
- De Becker & Raucq (2013) De Becker M., Raucq F., 2013, A&A, 558, A28
- Deil et al. (2015) Deil C., Brun F., Carrigan S., Chaves R., Donath A., Gast H., Marrandon V., Terrier R., 2015, PoS, ICRC2015
- Djannati-Ataï et al. (2008) Djannati-Ataï A., deJager O. C., Terrier R., Gallant Y. A., Hoppe S., 2008, International Cosmic Ray Conference, 2, 823
- Eger et al. (2011) Eger P., Rowell G., Kawamura A., Fukui Y., Rolland L., Stegmann C., 2011, A&A, 526, A82
- Farnier et al. (2011) Farnier C., Walter R., Leyder J.-C., 2011, A&A, 526, A57
- Faure et al. (2013) Faure A., Hily-Blant P., Le Gal R., Rist C., Pineau des Forêts G., 2013, ApJ, 770, L2
- Forster & Caswell (2000) Forster J. R., Caswell J. L., 2000, ApJ, 530, 371
- Frail & Mitchell (1998) Frail D. A., Mitchell G. F., 1998, ApJ, 508, 690
- Fukuda et al. (2014) Fukuda T., Yoshiike S., Sano H., Torii K., Yamamoto H., Acero F., Fukui Y., 2014, ApJ, 788, 94
- Fukui et al. (2012) Fukui Y., et al., 2012, ApJ, 746, 82
- Fukui et al. (2015) Fukui Y., Torii K., Onishi T., Yamamoto H., Okamoto R., Hayakawa T., Tachihara K., Sano H., 2015, ApJ, 798, 6
- Gabici & Aharonian (2014) Gabici S., Aharonian F. A., 2014, MNRAS, 445, L70
- Gabici et al. (2007) Gabici S., Aharonian F. A., Blasi P., 2007, Ap&SS, 309, 365
- Gallant et al. (2008) Gallant Y. A., et al., 2008, in Bassa C., Wang Z., Cumming A., Kaspi V. M., eds, American Institute of Physics Conference Series Vol. 983, 40 Years of Pulsars: Millisecond Pulsars, Magnetars and More. pp 195–199, doi:10.1063/1.2900140
- Gotthelf et al. (2014) Gotthelf E. V., et al., 2014, ApJ, 788, 155
- Green (1999) Green A. J., 1999, in A. R. Taylor, T. L. Landecker, & G. Joncas ed., Astronomical Society of the Pacific Conference Series Vol. 168, New Perspectives on the Interstellar Medium. p. 43
- H.E.S.S. Collaboration et al. (2012) H.E.S.S. Collaboration et al., 2012, A&A, 548, A46
- H.E.S.S. Collaboration et al. (2015a) H.E.S.S. Collaboration et al., 2015a, Science, 347, 406
- HESS Collaboration et al. (2015b) HESS Collaboration et al., 2015b, MNRAS, 446, 1163
- Hayakawa et al. (2012) Hayakawa T., Torii K., Enokiya R., Amano T., Fukui Y., 2012, PASJ, 64, 8
- Ho & Townes (1983) Ho P. T. P., Townes C. H., 1983, ARA&A, 21, 239
- Hofverberg et al. (2010) Hofverberg P., Chaves R. C. G., Fiasson A., Kosack K., Méhault J., de Onã Wilhelmi E., H.E.S.S. Collaboration 2010, in 25th Texas Symposium on Relativistic Astrophysics. (arXiv:1104.5119)
- Hofverberg et al. (2011) Hofverberg P., Chaves R. C. G., Méhault J., de Naurois M., 2011, in Proceedings, 32nd International Cosmic Ray Conference (ICRC 2011): Beijing, China, August 11-18, 2011. pp 248–251 (arXiv:1112.2901), doi:10.7529/ICRC2011/V07/1271, http://inspirehep.net/record/1081159/files/arXiv:1112.2901.pdf
- Hoppe (2008) Hoppe S., 2008, in International Cosmic Ray Conference. pp 579–582 (arXiv:0710.3528)
- Inoue & Inutsuka (2012) Inoue T., Inutsuka S.-i., 2012, ApJ, 759, 35
- Inoue et al. (2012) Inoue T., Yamazaki R., Inutsuka S.-i., Fukui Y., 2012, ApJ, 744, 71
- Jackson et al. (2006) Jackson J. M., et al., 2006, ApJS, 163, 145
- Jackson et al. (2008) Jackson J. M., Finn S. C., Rathborne J. M., Chambers E. T., Simon R., 2008, ApJ, 680, 349
- Kargaltsev et al. (2007) Kargaltsev O., Pavlov G. G., Garmire G. P., 2007, ApJ, 670, 643
- Kothes & Dougherty (2007) Kothes R., Dougherty S. M., 2007, A&A, 468, 993
- Kuchar & Clark (1997) Kuchar T. A., Clark F. O., 1997, ApJ, 488, 224
- Lau et al. (2017) Lau J. C., et al., 2017, MNRAS, 464, 3757
- Lemoine-Goumard et al. (2014) Lemoine-Goumard M., Grondin M.-H., Acero F., Ballet J., Laffon H., Reposeur T., 2014, ApJ, 794, L16
- Lester et al. (1985) Lester D. F., Dinerstein H. L., Werner M. W., Harvey P. M., Evans II N. J., Brown R. L., 1985, ApJ, 296, 565
- Lockett et al. (1999) Lockett P., Gauthier E., Elitzur M., 1999, ApJ, 511, 235
- Lockman et al. (1996) Lockman F. J., Pisano D. J., Howard G. J., 1996, ApJ, 472, 173
- Manchester et al. (2005) Manchester R. N., Hobbs G. B., Teoh A., Hobbs M., 2005, AJ, 129, 1993
- Maret et al. (2009) Maret S., Faure A., Scifoni E., Wiesenfeld L., 2009, MNRAS, 399, 425
- Mattana et al. (2009) Mattana F., et al., 2009, ApJ, 694, 12
- Maxted et al. (2012) Maxted N. I., et al., 2012, MNRAS, 422, 2230
- Maxted et al. (2014) Maxted N., et al., 2014, PoS, CRISM2014, 009
- Maxted et al. (2016) Maxted N. I., de Wilt P., Rowell G. P., Nicholas B. P., Burton M. G., Walsh A., Fukui Y., Kawamura A., 2016, MNRAS, 462, 532
- McClure-Griffiths et al. (2005) McClure-Griffiths N. M., Dickey J. M., Gaensler B. M., Green A. J., Haverkorn M., Strasser S., 2005, ApJS, 158, 178
- Motte et al. (2003) Motte F., Schilke P., Lis D. C., 2003, ApJ, 582, 277
- Nicholas et al. (2011) Nicholas B., Rowell G., Burton M. G., Walsh A., Fukui Y., Kawamura A., Longmore S., Keto E., 2011, MNRAS, 411, 1367
- Nicholas et al. (2012) Nicholas B. P., Rowell G., Burton M. G., Walsh A. J., Fukui Y., Kawamura A., Maxted N. I., 2012, MNRAS, 419, 251
- Odegard (1986) Odegard N., 1986, AJ, 92, 1372
- Pedaletti et al. (2014) Pedaletti G., de Oña Wilhelmi E., Torres D. F., 2014, A&A, 565, A118
- Pittard & Dougherty (2006) Pittard J. M., Dougherty S. M., 2006, MNRAS, 372, 801
- Pühlhofer et al. (2015) Pühlhofer G., et al., 2015, preprint, (arXiv:1509.03872)
- Purcell et al. (2012) Purcell C. R., et al., 2012, MNRAS, 426, 1972
- Rathborne et al. (2006) Rathborne J. M., Jackson J. M., Simon R., 2006, ApJ, 641, 389
- Reitberger et al. (2015) Reitberger K., Reimer A., Reimer O., Takahashi H., 2015, A&A, 577, A100
- Renaud et al. (2008) Renaud M., Goret P., Chaves R. C. G., 2008, in Aharonian F. A., Hofmann W., Rieger F., eds, American Institute of Physics Conference Series Vol. 1085, American Institute of Physics Conference Series. pp 281–284 (arXiv:0811.1552), doi:10.1063/1.3076660
- Rowell et al. (2012) Rowell G., Naurois M. D., Ataï A. D., Gallant Y., H. E. S. S. Collaboration 2012, in Aharonian F. A., Hofmann W., Rieger F. M., eds, American Institute of Physics Conference Series Vol. 1505, American Institute of Physics Conference Series. pp 273–276, doi:10.1063/1.4772250
- Russeil et al. (2005) Russeil D., Adami C., Amram P., Le Coarer E., Georgelin Y. M., Marcelin M., Parker Q., 2005, A&A, 429, 497
- Sheidaei et al. (2011) Sheidaei F., Djannati-Ataï A., Gast H., 2011, in Proceedings, 32nd International Cosmic Ray Conference (ICRC 2011): Beijing, China, August 11-18, 2011. pp 244–247 (arXiv:1110.6837), doi:10.7529/ICRC2011/V07/1225, http://inspirehep.net/record/943822/files/arXiv:1110.6837.pdf
- Spitkovsky (2008) Spitkovsky A., 2008, ApJ, 682, L5
- Sugizaki et al. (2001) Sugizaki M., Mitsuda K., Kaneda H., Matsuzaki K., Yamauchi S., Koyama K., 2001, ApJS, 134, 77
- Suzuki et al. (1992) Suzuki H., Yamamoto S., Ohishi M., Kaifu N., Ishikawa S.-I., Hirahara Y., Takano S., 1992, ApJ, 392, 551
- Tafalla et al. (2002) Tafalla M., Myers P. C., Caselli P., Walmsley C. M., Comito C., 2002, ApJ, 569, 815
- Tian et al. (2008) Tian W. W., Leahy D. A., Haverkorn M., Jiang B., 2008, ApJ, 679, L85
- Tibolla et al. (2008) Tibolla O., Komin N., Kosack K., Naumann-Godo M., 2008, in Aharonian F. A., Hofmann W., Rieger F., eds, American Institute of Physics Conference Series Vol. 1085, American Institute of Physics Conference Series. pp 249–252, doi:10.1063/1.3076652
- Uchida et al. (1992) Uchida K. I., Morris M., Bally J., Pound M., Yusef-Zadeh F., 1992, ApJ, 398, 128
- Umemoto et al. (1999) Umemoto T., Mikami H., Yamamoto S., Hirano N., 1999, ApJ, 525, L105
- Ungerechts et al. (1986) Ungerechts H., Winnewisser G., Walmsley C. M., 1986, A&A, 157, 207
- Urquhart et al. (2010) Urquhart J. S., et al., 2010, Publ. Astron. Soc. Australia, 27, 321
- Voisin et al. (2016) Voisin F., Rowell G., Burton M. G., Walsh A., Fukui Y., Aharonian F., 2016, MNRAS, 458, 2813
- Walmsley & Ungerechts (1983) Walmsley C. M., Ungerechts H., 1983, A&A, 122, 164
- Walsh et al. (2011) Walsh A. J., et al., 2011, MNRAS, 416, 1764
- Wardle (1999) Wardle M., 1999, ApJ, 525, L101
- Wenger et al. (2000) Wenger M., et al., 2000, A&AS, 143, 9
- Whiteoak & Green (1996) Whiteoak J. B. Z., Green A. J., 1996, A&AS, 118, 329
- Wink et al. (1982) Wink J. E., Altenhoff W. J., Mezger P. G., 1982, A&A, 108, 227
- Zirakashvili & Aharonian (2010) Zirakashvili V. N., Aharonian F. A., 2010, ApJ, 708, 965
- de Oña Wilhelmi (2009) de Oña Wilhelmi E., 2009, in Bastieri D., Rando R., eds, American Institute of Physics Conference Series Vol. 1112, American Institute of Physics Conference Series. pp 16–22, doi:10.1063/1.3125778
- de Oña-Wilhelmi et al. (2013) de Oña-Wilhelmi E., et al., 2013, Astroparticle Physics, 43, 287
- van der Hucht (2001) van der Hucht K. A., 2001, New Astron. Rev., 45, 135