copyrightbox
Leveraging Joint Interactions for
Credibility Analysis in News Communities
category
H.3.3 Information Storage and Retrieval Information Search and Retrievalcategory
I.2.7 Computing Methodologies Artificial Intelligencekeywords
Credibility; News Community; Probabilistic Graphical ModelsAbstract
Media seems to have become more partisan, often providing a biased coverage of news catering to the interest of specific groups. It is therefore essential to identify credible information content that provides an objective narrative of an event. News communities such as digg, reddit, or newstrust offer recommendations, reviews, quality ratings, and further insights on journalistic works. However, there is a complex interaction between different factors in such online communities: fairness and style of reporting, language clarity and objectivity, topical perspectives (like political viewpoint), expertise and bias of community members, and more.
This paper presents a model to systematically analyze the different interactions in a news community between users, news, and sources. We develop a probabilistic graphical model that leverages this joint interaction to identify 1) highly credible news articles, 2) trustworthy news sources, and 3) expert users who perform the role of “citizen journalists” in the community. Our method extends CRF models to incorporate real-valued ratings, as some communities have very fine-grained scales that cannot be easily discretized without losing information. To the best of our knowledge, this paper is the first full-fledged analysis of credibility, trust, and expertise in news communities.
- Information Filtering - Natural Language Processing
1 Introduction
Motivation: Media plays a crucial role in the public dissemination of information about events. Many people find online information and blogs as useful as TV or magazines. At the same time, however, people also believe that there is substantial media bias in news coverage [24, 8], especially in view of inter-dependencies and cross-ownerships of media companies and other industries (like energy).
Several factors affect the coverage and presentation of news in media incorporating potentially biased information induced via the fairness and style of reporting. News are often presented in a polarized way depending on the political viewpoint of the media source (newspapers, TV stations, etc.). In addition, other source-specific properties like viewpoint, expertise, and format of news may also be indicators of information credibility.
In this paper, we embark on an in-depth study and formal modeling of these factors and inter-dependencies within news communities for credibility analysis. A news community is a news aggregator site (e.g., reddit.com, digg.com, newstrust.net) where users can give explicit feedback (e.g., rate, review, share) on the quality of news and can interact (e.g., comment, vote) with each other. Users can rate and review news, point out differences, bias in perspectives, unverified claims etc. However, this adds user subjectivity to the evaluation process, as users incorporate their own bias and perspectives in the framework. Controversial topics create polarization among users which influence their ratings. [30, 6] state that online ratings are one of the most trusted sources of user feedback; however they are systematically biased and easily manipulated.
Problem Statement: Given a set of news sources generating news articles, and users reviewing those articles on different qualitative aspects with mutual interactions — our objective is to jointly rank the sources, articles, and users based on their trustworthiness, credibility, and expertise respectively.
In this process, we want to analyze the influence of various factors like the writing style of a news article, its topic distribution, type of media and format of news, political viewpoint and expertise, and other user traits on the credibility analysis of the community.
Our Approach: To analyze the factors and inter-dependencies in a news community, we have developed a sophisticated probabilistic graphical model, specifically a Continuous Conditional Random Field (CCRF) model, which exploits several moderate signals of interaction jointly between the following factors to derive a strong signal for information credibility (refer to Figures 1(a) and 1(b)). In particular, the model captures the following factors.
-
Language and credibility of a news article: objectivity, rationality, and general quality of language in the news article. Objectivity is the quality of the news to be free from emotion, bias and prejudice of the author. The credibility of a news article refers to presenting an unbiased, informative and balanced narrative of an event.
-
Properties and trustworthiness of a news source: trustworthiness of a news source in the sense of generating credible articles based on source properties like viewpoint, expertise and format of news.
-
Expertise of users and review ratings: expertise of a user, in the news community, in properly judging the credibility of news articles. Expert users should provide objective evaluations – by reviews and/or ratings – of news articles, corroborating with the evaluations of other expert users. This can be used to identify potential “citizen journalists” [17] in the community.
We show that the CCRF performs better than sophisticated collaborative filtering approaches based on latent factor models, and regression methods that do not consider all these interactions.
Although this work is focused on news communities, the framework can also be used for instance, in health communities (e.g. healthboards.com) where users write posts on drug usage — the objective being to jointly rank posts, drug side-effects, and users based on their quality, credibility, and trustworthiness respectively.
In this work, the attributes credibility and trustworthiness are always associated with a news article and a news source, respectively. The joint interaction between several factors also captures that a source garners trustworthiness by generating credible news articles, which are highly rated by expert users. Similarly, the likelihood of a news article being credible increases if it is generated by a trustworthy source.
Some communities offer users fine-grained scales for rating different aspects of news articles and news sources. For example, the newstrust.net community analyzes an article on aspects like insightful, fairness, style and factual. These are aggregated into an overall real-valued rating after weighing the aspects based on their importance, expertise of the user, feedback from the community, and more. This setting cannot be easily discretized without blow-up or risking to lose information. Therefore, we model ratings as real-valued variables in our CCRF.
Contributions: The paper introduces the following novel elements:
-
A continuous CRF that captures the mutual dependencies between credibility of articles, trustworthiness of sources, expertise of users, and expresses real-valued ratings.
-
An inference method for the CCRF that allows us to jointly (a) predict ratings; and (b) rank articles, sources, and users by their credibility, trustworthiness, and expertise, respectively.
-
A large experimental study with data from newstrust.net, one of the most sophisticated news communities with a focus on quality journalism.
The rest of the paper is organized as follows. Section 2 presents how we model news communities, and which factors we include in the model. Section 3 develops the CCRF that captures the interaction between all the factors. Section 4 introduces the dataset that we use for experimental evaluation and further studies. Section 5 presents our experimental results followed by discussion.
2 Modeling News Communities
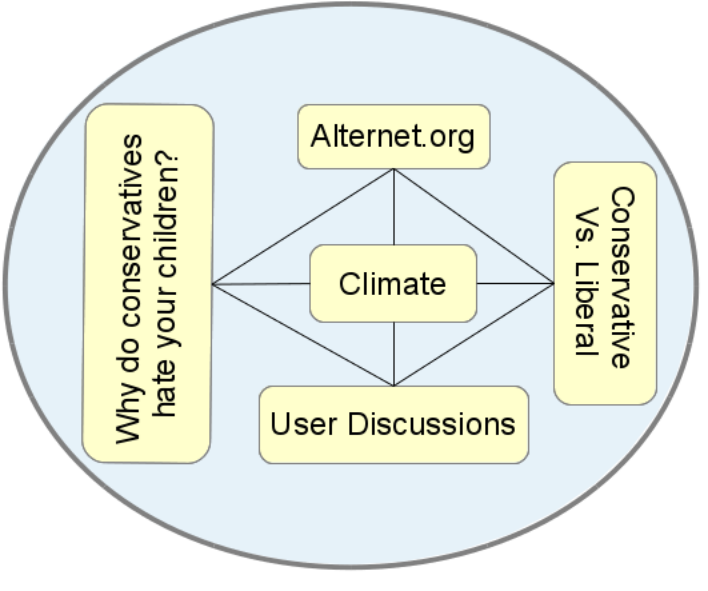

Our approach exploits the rich interaction taking place between the different factors in a news community. We propose a probabilistic graphical model that leverages the interplay between news credibility, language objectivity, source trustworthiness, and user expertise. Refer to Figure 1 for the following discussion.
Consider a set of news sources (e.g., in Figure 1(c)) generating articles which are reviewed and analyzed by users for their credibility. Consider to be the review by user on article . The overall article rating of is given by .
In our model, each news source, news article, user and her rating or review, and overall article rating is associated with a continuous random variable , that indicates its trustworthiness, objectivity, expertise, and credibility, respectively. indicates the best quality that an item can obtain, and is the worst. Discrete ratings, being a special case of this setting, can be easily handled.
Each node is associated with a set of observed features that are extracted from the news community. For example, a news source has properties like topic specific expertise, viewpoint and format of news; a news article has features like topics, and style of writing from the usage of discourse markers and subjective words in the article. For users we extract their topical perspectives and expertise, engagement features (like the number of questions, replies, reviews posted) and various interactions with other users (like upvotes/downvotes) and news sources in the community.
The objective of our model is to predict credibility ratings of news articles by exploiting the mutual interactions between different variables. The following edges between the variables capture their interplay:
-
Each news article is connected to the news source from where it is extracted (e.g., , )
-
Each news article is connected to its review or rating by a user (e.g., , , )
-
Each user is connected to all her reviews (e.g., , , )
-
Each user is connected to all news articles rated by her (e.g., , , )
-
Each source is connected to all the users who rated its articles (e.g., , )
-
Each source is connected to all the reviews of its articles (e.g., , , )
-
For each article, all the users and all their reviews on the article are inter-connected (e.g., , , ). This captures user-user interactions (e.g., upvoting/downvoting ’s rating on ) influencing the overall article rating.
Therefore, a clique (e.g., ) is formed between a news article, its source, users and their reviews on the article. Multiple such cliques (e.g., and ) share information via their common news sources (e.g., ) and users (e.g., ).
News topics play a significant role on information credibility. Individual users in community (and news sources) have their own perspectives and expertise on various topics (e.g., environmental politics). Modeling user-specific topical perspectives explicitly captures credibility judgment better than a user-independent model. However, many articles do not have explicit topic tags. Hence we use Latent Dirichlet Allocation (LDA) [1] in conjunction with Support Vector Regression (SVR) [4] to learn words associated to each (latent) topic, and user (and source) perspectives for the topics. Documents are assumed to have a distribution over topics as latent variables, with words as observables. Inference is by Gibbs sampling. This LDA model is a component of the overall model, discussed next.
We use a probabilistic graphical model, specifically a Conditional Random Field (CRF), to model all factors jointly. The modeling approach is related to the prior work of [23]. However, unlike that work and traditional CRF models, our problem setting requires a continuous version of the CRF (CCRF) to deal with real-valued ratings instead of discrete labels. In this work, we follow an approach similar to [26, 27, 32] in learning the parameters of the CCRF. We use Support Vector Regression [4] to learn the elements of the feature vector for the CCRF.
The inference is centered around cliques of the form source, article, users , reviews . An example is the two cliques and in the instance graph of Figure 1(c). This captures the “cross-talk” between different cliques sharing nodes. A news source garners trustworthiness by generating multiple credible articles. Users attain expertise by correctly identifying credible articles that corroborate with other expert users. Inability to do so brings down their expertise. Similarly, an article attains credibility if it is generated by a trustworthy source and highly rated by an expert user. The inference algorithm for the CCRF is discussed in detail in Section 3.
In the following subsections, we discuss the various feature groups that are considered in our CCRF model.
2.1 Articles and their Stylistic Features
The style in which news is presented to the reader plays a pivotal role in understanding its credibility. The desired property for news is to be objective and unbiased. In this section, we examine the different stylistic indicators of news credibility. All the lexicons used in this section are compiled from [28, 23].
Assertives: Assertive verbs (e.g., “claim”) complement and modify a proposition in a sentence. They capture the degree of certainty to which a proposition holds.
Factives: Factive verbs (e.g., “indicate”) pre-suppose the truth of a proposition in a sentence.
Hedges: These are mitigating words (e.g., “may”) to soften the degree of commitment to a proposition.
Implicatives: These words trigger pre-supposition in an utterance. For example, usage of the word complicit indicates participation in an activity in an unlawful way.
Report verbs: These verbs (e.g., “argue”) are used to indicate the attitude towards the source, or report what someone said more accurately, rather than using just say and tell.
Discourse markers: These capture the degree of confidence, perspective, and certainty in the set of propositions made. For instance, strong modals (e.g., “could”), probabilistic adverbs (e.g., “maybe”), and conditionals (e.g., “if”) depict a high degree of uncertainty and hypothetical situations, whereas weak modals (e.g., “should”) and inferential conjunctions (e.g., “therefore”) depict certainty.
Subjectivity and bias: News is supposed to be objective: writers should not convey their own opinions, feelings or prejudices in their stories. For example, a news titled ‘‘Why do conservatives hate your children?’’ is not considered objective journalism. We use a subjectivity lexicon11 1 http://mpqa.cs.pitt.edu/lexicons/subj_lexicon/, a list of positive and negative opinionated words22 2 http://www.cs.uic.edu/ liub/FBS/opinion-lexicon-English.rar, and an affective lexicon33 3 http://wndomains.fbk.eu/wnaffect.html to detect subjective clues in articles. The affective features capture the state of mind (like attitude and emotions) of the writer while writing an article or post (e.g., anxiousness, confidence, depression, favor, malice, sympathy etc.).
We additionally harness a lexicon of bias-inducing words extracted from the Wikipedia edit history from [28] exploiting its Neutral Point of View Policy to keep its articles “fairly, proportionately, and as far as possible without bias, all significant views that have been published by reliable sources on a topic”.
Feature vector construction: For each stylistic feature type and each news article , we compute the relative frequency of words of type occurring in , thus constructing a feature vector . Consider the review written by user on the article . For each such review, analogous to the per-article stylistic feature vector , we construct a per-review feature vector .
2.2 Articles and their Topics
Topic tags for news articles play an important role in user-perceived prominence, bias and credibility, in accordance to the Prominence-Interpretation theory [7]. For example, the tag Politics is often viewed as an indicator of potential bias and individual differences; whereas tags like Energy or Environment are perceived as more neutral news and therefore invoke higher agreement in the community on the associated articles’ credibility. Obviously, this can be misleading as there is a significant influence of Politics on all topics in all format of news.
Certain users have topic-specific expertise that make them rate articles on those topics better than others. News sources also have expertise on specific topics and provide a better coverage of news on those topics than others. For example, National Geographic provides a good coverage of news related to environment, whereas The Wall Street Journal provides a good coverage on economic policies.
However, many news articles do not have any explicit topic tag. In order to automatically identify the underlying theme of the article, we use Latent Dirichlet Allocation (LDA) [1] to learn the latent topic distribution in the corpus. LDA assumes a document to have a distribution over a set of topics, and each topic to have a distribution over words. Table 1 shows an excerpt of the top topic words in each topic, where we manually added illustrative labels for the topics. The latent topics also capture some subtle themes not detected by the explicit tags. For example, Amy Goodman is an American broadcast journalist, syndicated columnist and investigative reporter who is considered highly credible in the community. Also, associated with that topic cluster is Amanda Blackhorse, a Navajo activist and plaintiff in the Washington Redskins case.
Feature vector construction: For each document and each of its review , we create feature vectors and respectively, using the learned latent topic distributions, as well as the explicit topic tags. Section 3.1 discusses our method to learn the topic distributions.
| Latent Topics | Topic Words |
|---|---|
| Obama admin. | obama, republican, party, election, president, senate, gop, vote |
| Citizen journ. | cjr, jouralism, writers, cjrs, marx, hutchins, reporting, liberty, guides |
| US military | iraq, war, military, iran, china, nuclear, obama, russia, weapons |
| AmyGoodman | democracy, military, civil, activist, protests, killing, navajo, amanda |
| Alternet | media, politics, world news, activism, world, civil, visions, economy |
| Climate | energy, climate, power, water, change, global, nuclear, fuel, warming |
2.3 News Sources
A news source is considered trustworthy if it generates highly credible articles. We examine the effect of different features of a news source on its trustworthiness based on user assigned ratings in the community. We consider the following source features (summarized in Table 2): the type of media (e.g., online, newspaper, tv, blog), format of news (e.g., news analysis, opinion, special report, news report, investigative report), (political) viewpoint (e.g., left, center, right), scope (e.g., international, national, local), the top topics covered by the source, and their topic-specific expertise.
| Category | Elements |
|---|---|
| Media | newspaper, blog, radio, magazine, online |
| Format | editorial, investigative report, news, research |
| Scope | local, state, regional, national, international |
| Viewpoint | far left, left, center, right, neutral |
| Top Topics | politics, weather, war, science,, U.S. military |
| Expertise on Topics | U.S. congress, Middle East, crime, presidential election, Bush administration, global warming |
Feature vector construction: For each news source , we create a feature vector using features in Table 2. Each element is or indicating presence or absence of a feature. Note that above features include the top (explicit) topics covered by any source, and its topic-specific expertise for a subset of those topics.
2.4 Users, Ratings and Interactions
A user’s expertise in judging news credibility depends on many factors. [5] discusses the following traits for recognizing an expert.
Community Engagement of the user is an obvious measure for judging the user authority in the community. We capture this with different features: number of answers, ratings given, comments, ratings received, disagreement and number of raters.
Inter-User Agreement: Expert users typically agree on what constitutes a credible article. This is inherently captured in the proposed graphical model, where a user gains expertise by assigning credibility ratings to articles that corroborate with other expert users.
Topical Perspective and Expertise: The potential for harvesting user preference and expertise in topics for rating prediction of reviews has been demonstrated in [22, 21]. For credibility analysis the model needs to capture the user’s perspective and bias towards certain topics based on their political inclination that bias their ratings, and their topic-specific expertise that allows them to evaluate articles on certain topics better as “Subject Matter Experts”. These are captured as per-user feature weights for the stylistic indicators and topic words in the language of user-contributed reviews.
Interactions:
In a community, users can upvote (digg, like, rate) the ratings of users that they appreciate, and downvote the ones they do not agree with. High review ratings from expert users increase the value of a user; whereas low ratings bring down her expertise. Similar to this user-user interaction, there can be user-article, user-source and source-article interactions which are captured as edges in our graphical model (by construction).
Consider the following anecdotal example in the community showing an expert in nuclear energy downvoting another user’s rating on nuclear radiation:
“Non-expert: Interesting opinion about health risks of nuclear radiation, from a physicist at Oxford University. He makes some reasonable points …
Low rating by expert to above review: Is it fair to assume that you have no background in biology or anything medical? While this story is definitely very important, it contains enough inaccurate and/or misleading statements…”
Feature vector construction: For each user , we create an engagement feature vector . In order to capture user subjectivity, in terms of different stylistic indicators of credibility, we consider the per-review language feature vector of user (refer to Section 2.1). To capture user perspective and expertise on different topics, we consider the per-review topic feature vector of each user .
3 Joint Probabilistic Inference
In this section we incorporate the discussed features and insights into a joint probabilistic graphical model. The task is to identify credible news articles, trustworthy news sources, and expert users jointly in a news community. Table 3 summarizes the important notations used in this section.
| Variables | Type | Description |
|---|---|---|
| Vector | Document with sequence of words | |
| Vector | Sources | |
| Vector | Users | |
| Vector | Review by user on document | |
| with sequence of words | ||
| Real Number | Rating of | |
| Vector | Sequence of topic assignments for | |
| Real Number | SVR prediction for users, sources, | |
| [1 …5] | language, and topics | |
| Real Number | Clique potential with for clique of | |
| Vector | Combination weights for users , sources , language and topic models | |
| Vector | Credibility rating of documents | |
| Matrix | Feature matrix with | |
| Diagonal Matrix | ||
| Vector | ||
| CovarianceMatrix | ||
| Mean Vector |
3.1 Topic Model
Consider an article consisting of a sequence of words denoted by . Each word is drawn from a vocabulary having unique words indexed by . Consider a set of topic assignments for , where each topic can be from a set of possible topics.
LDA [1] assumes each document to be associated with a multinomial distribution over topics with a symmetric dirichlet prior . denotes the probability of occurrence of topic in document . Topics have a multinomial distribution over words drawn from a vocabulary with a symmetric dirichlet prior . denotes the probability of the word belonging to the topic . Exact inference is not possible due to intractable coupling between and . We use Gibbs sampling for approximate inference.
Let denote the count of the word occurring in document belonging to the topic . In the following equation, at any position in the above count indicates marginalization, i.e., summing up the counts over all values for the corresponding position in . The conditional distribution for the latent variable (with components to ) is given by:
| (1) | ||||
Let and be the set of explicit topic tags and latent topic dimensions, respectively. The topic feature vector for an article or review combines both explicit tags and latent topics and is constructed as follows:
So for any word in the document matching an explicit topic tag, the corresponding element in the feature vector is set to its occurrence count in the document. If the word belongs to any latent topic with probability greater than threshold , the probability of the word belonging to that topic () is added to the corresponding element in the feature vector, and set to otherwise.
3.2 Support Vector Regression
We use Support Vector Regression (SVR) [4] to combine the different features discussed in Section 2. SVR is an extension of the max-margin framework for SVM classification to the regression problem. It solves the following optimization problem to learn weights for features :
| (2) |
Article Stylistic Model: We learn a stylistic regression model using the per-article stylistic feature vector for article (or, for review ), with the overall article rating (or, ) as the response variable.
Article Topic Model: Similarly, we learn a topic regression model using the per-article topic feature vector for article (or, for review ), with the overall article rating (or, ) as the response variable.
Source Model: We learn a source regression model using the per-source feature vector for source , with the overall source rating as the response variable .
User Model: For each user , we learn a user regression model with her per-review stylistic and topic feature vectors
for review for article , with her overall review rating as the response variable.
Note that we use overall article rating to train article stylistic and topic models. For the user model, however, we take user assigned article ratings and per-user features. This model captures user subjectivity and topic perspective. The source models are trained on news-source specific meta-data and its ground-truth ratings.
3.3 Continuous Conditional Random Field
We model our learning task as a Conditional Random Field (CRF), where the random variables are the ratings of news articles , news sources , users , and reviews . The objective is to predict the credibility ratings of the articles .
The cliques in the CRF consist of an article , its source , set of users reviewing it, and the corresponding user reviews — where denotes the review by user on article . Different cliques are connected via the common news sources, and users. There are as many cliques as the number of news articles.
Let be a potential function for clique . Each clique has a set of associated vertex feature functions. In our problem setting, we associate features to each vertex.The features constituted by the stylistic, topic, source and user features explained in Section 2 are:
A traditional CRF model allows us to have a binary decision if a news article is credible () or not (), by estimating the conditional distribution with the probability mass function of the discrete random variable :
| (3) |
But in our problem setting, we want to estimate the credibility rating of an article. Therefore, we need to estimate the conditional distribution with the probability density function of the continuous random variable :
| (4) |
Given a news article , its source id , and a set of user ids who reviewed the article, the regression models , , , (discussed in Section 3.2) predict rating of . For notational brevity, hereafter, we drop the argument from the SVR function. These SVR predictors are for separate feature groups and independent of each other. Now we combine the different SVR models to capture mutual interactions, such that the weight for each SVR model reflects our confidence on its quality. Errors by an SVR are penalized by the squared loss between the predicted article rating and the ground-truth rating. There is an additional constraint that for any clique only the regression models corresponding to the news-source and users present in it should be activated. This can be thought of as partitioning the input feature space into subsets, with the features inside a clique capturing local interactions, and the global weights capture the overall quality of the random variables via the shared information between the cliques (in terms of common sources, users, topics and language features) — an ideal setting for using a CRF. Equation 5 shows one such linear combination. Energy function of an individual clique is given by:
| (5) |
Indicator functions and are 1 if is a reviewer and is the source of article respectively, and are otherwise.
As the output of the SVR is used as an input to the CCRF in Equation 5, each element of the input feature vector is already predicting the output variable. The learned parameters (with dimension) of the linear combination of the above features depict how much to trust individual predictors. Large on a particular predictor places large penalty on the mistakes committed by it, and therefore depicts a higher quality for that predictor. corresponding to user can be taken as a proxy for that user’s expertise, allowing us to obtain a ranked list of expert users. Similarly, corresponding to news source can be taken as a proxy for that source’s trustworthiness, allowing us to obtain a ranked list of trustworthy news sources.
Overall energy function of all cliques is given by:
We can derive:
| (6) |
Substituting in Equation 4:
| (7) |
(Substituting )
Equation 7 can be transformed into a multivariate Gaussian distribution after substituting . Therefore obtaining,
| (8) |
represents the contribution of to the covariance matrix . Each row of the vector and matrix corresponds to one training instance, representing the active contribution of features present in it. To ensure Equation 8 represents a valid Gaussian distribution, the covariance matrix needs to be positive definite for its inverse to exist. For that the diagonal matrix needs to be a positive semi-definite matrix. This can be ensured by making all the diagonal elements in greater than , by constraining .
Since this is a constrained optimization problem, gradient ascent cannot be directly used. We follow the approach similar to [27] and maximize log-likelihood with respect to , instead of as in standard gradient ascent, making the optimization problem unconstrained as:
| (9) |
Taking partial derivative of the of Equation 8 w.r.t :
| (10) |
Substituting the following in the above equation:
where, indicates the column of the feature matrix .
We can derive the gradient vector:
| (11) |
Let denote the learning rate. The update equation is given by:
| (12) |
Once the model parameters are learned using gradient ascent, the inference for the prediction of the article credibility rating is straightforward. As we assume the distribution to be Gaussian, the prediction is the expected value of the function, given by the mean of the distribution:
.
Note that and are both a function of which represents the combination weights of various factors to capture mutual interactions. The optimization problem determines the optimal for reducing the error in prediction.
4 Use Case: Newstrust
We performed experiments with data from a typical news community: newstrust.net44
4
Code and data available at
http://www.mpi-inf.mpg.de/impact/credibilityanalysis/.
This community is similar to digg.com and reddit.com, but has more refined ratings and interactions. We chose NewsTrust
because of the availability of ground-truth ratings for credibility analysis of news articles;
such ground-truth is not available for the other communities.
We collected stories from NewsTrust from May, 2006 to May, 2014. Each such story features a news article from a source (E.g. BBC, CNN, Wall Street Journal) that is posted by a member, and reviewed by other members, many of whom are professional journalists and content experts55 5 http://www.newstrust.net/help#about_newstrust. We crawled all the stories with their explicit topic tags and other associated meta-data. We crawled all the news articles from their original sources that were featured in any NewsTrust story. The earliest story dates back to May 1, 1939 and the latest one is in May 9, 2014.
We collected all member profiles containing information about the demographics, occupation and expertise of the members along with their activity in the community in terms of the posts, reviews and ratings; as well as interaction with other members. The members in the community can also rate each others’ ratings. The earliest story rating by a member dates back to May, 2006 and the most recent one is in Feb, 2014. In addition, we collected information on member evaluation of news sources, and other information (e.g., type of media, scope, viewpoint, topic specific expertise) about source from its meta data.
Crawled dataset: Table 4 shows the dataset statistics. In total K unique news articles were reviewed in NewsTrust in the given period, out of which we were able to extract K full articles from the original sources like New York Times, TruthDig, ScientificAmerican etc — a total of K distinct sources. The remaining articles were not available for crawling. There are K stories featured in NewsTrust for all the above articles, out of which stories refer to the news articles we managed to extract from their original sources. The average number of reviews per story is . For general analysis we use the entire dataset. For experimental evaluation of the CCRF and hypotheses testing, we use only those stories (K) with a minimum of reviews that refer to the news articles we were able to extract from original sources.
| Factors | Count |
| Unique news articles reviewed in NewsTrust | 62,064 |
| NewsTrust stories on news articles | 84,704 |
| NewsTrust stories with reviews | 43,107 |
| NewsTrust stories with reviews | 18,521 |
| NewsTrust member reviews of news articles | 134,407 |
| News articles extracted from original sources | 47,565 |
| NewsTrust stories on extracted news articles | 52,579 |
| News sources | 5,658 |
| Journalists who wrote news articles | 19,236 |
| Timestamps (month and year) of posted news articles | 3,122 |
| NewsTrust members who reviewed news articles | 7,114 |
| NewsTrust members who posted news articles | 1,580 |
| News sources reviewed by NewsTrust members | 668 |
| Explicit topic tags | 456 |
| Latent topics extracted | 300 |
| Factors | Count | Factors | Count |
|---|---|---|---|
| Nodes | 181,364 | No. of weakly connected components | 12 |
| Sources | 1,704 | Diameter | 8 |
| Members | 6,906 | Average path length | 47 |
| News articles | 42,204 | Average degree | 6.641 |
| Reviews | 130,550 | Average clustering coefficient | 0.884 |
| Edges | 602,239 | Modularity | 0.516 |
| Total triangles | 521,630 |
Ground-Truth for evaluation: The members in the community can rate the credibility of a news article on a scale from to regarding qualitative aspects like facts, fairness, writing style and insight, and popularity aspects like recommendation, credibility and views. Members give an overall recommendation for the article explained to them as: “… Is this quality journalism? Would you recommend this story to a friend or colleague? … This question is similar to the up and down arrows of popular social news sites like Digg and Reddit, but with a focus on quality journalism." Each article’s aspect ratings by different members are weighted (and aggregated) by NewsTrust based on findings of [16], and the member expertise and member level (described below). This overall article rating is taken as the ground-truth for the article credibility rating in our work. A user’s member level is calculated by NewsTrust based on her community engagement, experience, other users’ feedback on her ratings, profile transparency and validation by NewsTrust staff. This member level is taken as the proxy for user expertise in our work. Members rate news sources while reviewing an article. These ratings are aggregated for each source, and taken as a proxy for the source trustworthiness in our work.
Training data: We perform -fold cross-validation on the news articles. During training on any -folds of the data, the algorithm learns the user, source, language and topic models from user-assigned ratings to articles and sources present in the train split. We combine sources with less than articles and users with less than reviews into background models for sources and users, respectively. This is to avoid modeling from sparse observations, and to reduce dimensionality of the feature space. However, while testing on the remaining blind -fold we use only the ids of sources and users reviewing the article; we do not use any user-assigned ratings of sources or articles. For a new user and a new source, we draw parameters from the user or source background model. The results are averaged by -fold cross-validation, and presented in the next section.
Experimental settings: In the first two experiments we want to
find the power of the CCRF in predicting user rating behavior, and credibility
rating of articles. Therefore, the evaluation measure is taken as the
Mean Squared Error (MSE) between the prediction and the actual
ground-rating in the community. For the latter experiments in finding expert
users (and, trustworthy sources) there is no absolute measure for predicting
user (and, source) quality; it only makes sense to find the relative ranking of
users (and, sources) in terms of their expertise (and, trustworthiness).
Therefore, the evaluation measure is taken as the Normalized Discounted
Cumulative Gain (NDCG) [13] between the ranked list of users
(and, sources) obtained from CCRF and their actual ranking in the
community.
5 Experiments
| Model | Only | Title |
| Title | & Text | |
| MSE | MSE | |
| Language Model: SVR | ||
| Language (Bias and Subjectivity) | 3.89 | 0.72 |
| Explicit Topics | 1.74 | 1.74 |
| Explicit + Latent Topics | 1.68 | 1.01 |
| All Topics (Explicit + Latent) + Language | 1.57 | 0.61 |
| News Source Features and Language Model: SVR | ||
| News Source | 1.69 | 1.69 |
| News Source + All Topics + Language | 0.91 | 0.46 |
| Aggregated Model: SVR | ||
| Users + All Topics + Language + News Source | 0.43 | 0.41 |
| Our Model: CCRF+SVR | ||
| User + All Topics + Language + News Source | 0.36 | 0.33 |
5.1 Predicting User Ratings of Articles
First we evaluate how good our model can predict the credibility ratings that users assign to news articles using the Mean Squared Error (MSE) between the prediction and the actual rating.
Baselines: We consider the following baselines for comparison:
1. Latent Factor Recommendation Model (LFM) [15]: LFM considers the tuple , and models each user and item as a vector of latent factors which are learned by minimizing the MSE between the rating and the product of the user-item latent factors. In our setting, each news article is considered an item and rating refers to the credibility rating assigned by a user to an article.
2. Experience-based LFM [21]: This model incorporates experience of a user in rating an item in the LFM. The model builds on the hypothesis that users at similar levels of experience have similar rating behaviors which evolve with time. The model has an extra dimension: the time of rating an item which is not used in our SVR model. Note the analogy between the experience of a user in this model, and the notion of user expertise in the SVR model. However, these models ignore the text of the reviews.
3. Text-based LFM [20]: This model incorporates text in the LFM by combining the latent factors associated to items in LFM with latent topics in text from topic models like LDA.
4. Support Vector Regression (SVR) [4]: We train an SVR model for each user (refer to Section 3.2) based on her reviews with language and topic features , with the user’s article ratings as the response variable. We also incorporate the article language features and the topic features, as well as source-specific features to train the user model for this task. The other models ignore the stylistic features, and other fine-grained user-item interactions in the community.
Table 7 shows the MSE comparison between the different methods. Our model (User SVR) achieved the lowest MSE and thus performed best.
5.2 Finding Credible Articles
As a second part of the evaluation, we investigate the predictive power of different models in order to find credible news articles based on the
aggregated ratings from all users. The above LFM models, unaware of the user cliques, cannot be used directly for this task, as each news article has multiple reviews from different users which need to be aggregated.
We find the Mean Squared Error (MSE) between the estimated overall article rating, and the ground-truth article rating. We consider stories with at least 3 ratings about a news article.
We compare the CCRF against the following baselines:
1. Support Vector Regression (SVR) [4]: We consider an SVR model with features on language (bag-of-all-words, subjectivity, bias etc.), topics (explicit tags as well as latent dimensions), and news-source-specific features. The language model uses all the lexicons derived and used in [28, 23].
The source model also includes topic features in terms of the top topics covered by the source, and its topic-specific expertise for a subset of the topics.
2. Aggregated Model (SVR) [4]: As explained earlier, the user features cannot be directly used in the baseline model, which is agnostic of the user cliques. Therefore, we adopt a simple aggregation approach by taking the average rating of all the user ratings for an article as a feature.
Note that, in contrast to this simple average used here, our CCRF model learns the weights per-user to
combine their overall ratings for an article.
Table 7 shows the MSE comparison of the different models.
MSE Comparison: The first two models in Table 7 ignore the textual content of news articles, and reviews, and perform worse than the ones that incorporate full text. The text-based LFM considers title and text, and performs better than its predecessors. However, the User SVR model considers richer features and interactions, and attains MSE reduction over the best performing LFM baselines.
The baselines in Table 7 show the model performance after incorporating different features in two different settings: 1) with news article titles only as text, and 2) with titles and the first few paragraphs of an article. The language model, especially the bias and subjectivity features, is less effective using only the article titles due to sparseness. On the other hand, using the entire article text may lead to very noisy features. So including the first few paragraphs of an article is the “sweet spot”. For this, we made an ad-hoc decision and included the first characters of each article. With this setting, the language features made a substantial contribution to reducing the MSE.
The aggregated SVR model further brings in the user features, and achieves the lowest MSE among the baselines. This shows that a user-aware credibility model performs better than user-independent ones. Our CCRF model combines all features in a more sophisticated manner, which results in MSE reduction over the most competitive baseline (aggregated SVR). This is empirical evidence that the joint interactions between the different factors in a news community are indeed important to consider for identifying highly credible articles.
5.3 Finding Trustworthy Sources
We shift the focus to two use cases: 1) identifying the most trustworthy sources, and 2) identifying expert users in the community who can play the role of “citizen journalists”.
Using the model of Section 3, we rank all news sources in the community according to the learned in Equation 5. The baseline is taken as the PageRank scores of news sources in the Web graph. In the experience-based LFM we can consider the sources to be users, and articles generated by them to be items. This allows us to obtain a ranking of the sources based on their overall authority. This is the second baseline against which we compare the CCRF.
We measure the quality of the ranked lists in terms of NDCG using the actual ranking of the news sources in the community as ground-truth. NDCG gives geometrically decreasing weights to predictions at the various positions of the ranked list:
where
Table 9 shows the NDCG scores for the different methods.
5.4 Finding Expert Users
Similar to news sources, we rank users according to the learned in Equation 5. The baseline is the average rating received by a user from other members in the community. We compute the NDCG score for the ranked lists of users by our method. We also compare against the ranked list of users from the experience-aware LFM [21]. Table 9 shows the NDCG scores for different methods.
| Factors | Corr. |
|---|---|
| a) Stylistic Indicators Vs. Article Credibility Rating | |
| Insightful (Is it well reasoned? thoughtful?) | 0.77 |
| Fairness (Is it impartial? or biased?) | 0.75 |
| Style (Is this story clear? concise? well-written?) | 0.65 |
| Responsibility (Are claims valid, ethical, unbiased?) | 0.72 |
| Balance (Does this story represent diverse viewpoints?) | 0.49 |
| b) Influence of Politics Vs. Disagreement | 0.11 |
| c) Expertise (Moderate, High) Vs. Disagreement | -0.10, -0.31 |
| Interactions | |
| d) User Expertise Vs. User-User Rating | 0.40 |
| e) Source Trustworthiness Vs. Article Credibility Rating | 0.47 |
| f) User Expertise Vs. MSE in Article Rating Prediction | -0.29 |
5.5 Discussion
Hypothesis Testing: We test various hypotheses under the influence of the feature groups using explicit labels, and ratings available in the NewsTrust community. A summary of the tests is presented in Table 10 showing a moderate correlation between various factors which are put together in the CCRF to have a strong indicator for information credibility.
Language: The stylistic features (factor (a) in Table 10) like assertives, hedges, implicatives, factives, discourse and affective play a significant role in the credibility detection of news, in conjunction with other language features like topics.
Topics: Topics are an important indicator for news credibility. We measured the influence of the Politics tag on other topics by their co-occurrence frequency in the explicit tag sets over all the news articles. We found significant influence of Politics on all topics, with an average measure of association of to any topic, and for the overall news article. The community gets polarized due to different perspectives on topical aspects of news. A moderate correlation (factor (b) in Table 10) indicates a weak trend of disagreement, measured by the standard deviation in article credibility rating among users, increasing with its political content. In general, we find that community disagreement for different viewpoints are as follows: Right () > Left() > Center() > Neutral ().
Users: User engagement features are strong indicators of expertise. Although credibility is ultimately subjective, experts show moderate agreement (factor (c) in Table 10) on highly credible news. There is a moderate correlation (factor (d) in Table 10) between feedback received by a user on his ratings from community, and his expertise.
Sources: Various traits of a news source like viewpoint, format and topic expertise are strong indicators of trustworthiness. In general, science and technology websites (e.g., discovermagazine.com, nature.com, scientificamerican.com), investigative reporting and non-partisan sources (e.g., truthout.org, truthdig.com, cfr.org), book sites (e.g., nybooks.com, editorandpublisher.com), encyclopedia (e.g., Wikipedia) and fact checking sites (e.g., factcheck.org) rank among the top trusted sources. Table 11 shows the most and least trusted sources on four sample topics. Overall, news sources are considered trustworthy with an average rating of and variance of . Tables 12 and 13 show the most and least trusted sources on different viewpoints and media types respectively. Contents from blogs are most likely to be posted followed by newspaper, magazine and other online sources. Contents from wire service, TV and radio are deemed the most trustworthy, although they have the least subscription, followed by magazines.
| Money - Politics | War in Iraq | Media - Politics | Green Technology |
| Most Trusted | |||
| rollingstone.com | nybooks.com | consortiumnews | discovermagazine.com |
| truthdig.com | consortiumnews | thenation.com | nature.com |
| democracynow.org | truthout.org | thedailyshow.com | scientificamerican.com |
| Least Trusted | |||
| firedoglake.com | crooksandliars | rushlimbaugh.com | |
| suntimes.com | timesonline | rightwingnews.com | |
| trueslant.com | suntimes.com | foxnews.com |
| Left | Right | Center | Neutral |
|---|---|---|---|
| Most | Trusted | ||
| democracynow, truthdig.com, rollingstone.com | courant.com, opinionjournal.com, townhall.com | armedforces- journal.com, bostonreview.net | spiegel.de,cfr.org, editorandpublisher.com |
| Least | Trusted | ||
| crooksandliars, suntimes.com, washingtonmonthly.com | rightwingnews, foxnews.com, weeklystandard.com | sltrib.com, examiner.com, spectator.org | msnbc.msn.com, online.wsj.com, techcrunch.com |
| Magazine | Online | Newspaper | Blog |
|---|---|---|---|
| Most Trusted Sources | |||
| rollingstone.com | truthdig.com | nytimes.com | juancole.com |
| nybooks.com | cfr.org | nola.com | dailykos.com |
| thenation.com | consortiumnews | seattletimes | huffingtonpost |
| Least Trusted Sources | |||
| weeklystandard.com | investigativevoice | suntimes.com | rightwingnews |
| commentarymagazine | northbaltimore | nydailynews.com | firedoglake.com |
| nationalreview.com | hosted.ap.org | dailymail.co.uk | crooksandliars |
Interactions: In principle, there is a moderate correlation between trustworthy sources generating credible articles (factor (e) in Table 10) identified by expert users (factor (f) in Table 10). A negative sign of correlation indicates decrease in disagreement or MSE with increase in expertise. In a news community, we can observe moderate signals of interaction between various factors that characterize users, articles, and sources. Our CCRF model brings all these features together to build a strong signal for news credibility.
6 Related Work
Rating prediction in online communities: Collaborative filtering based approaches [15] for rating prediction exploit user and item similarities by latent factors. [21] further studies the temporal evolution of users and their rating behavior in this framework. Recent works [20, 22] also tap into user review texts to generate user-specific ratings of reviews. Other papers have studied temporal issues for anomaly detection [10].Prior work that tapped user review texts focused on other issues. Sentiment analysis over reviews aimed to learn latent topics [18], latent aspects and their ratings [35], and user-user interactions [36]. Our model unifies several dimensions to jointly study the role of language, users, topics, and interactions for information credibility.
Information credibility in social media: [3] analyzes micro-blog postings in Twitter related to trending topics, and classifies them as credible or not based on features from user posting and re-posting behavior. [14] focuses on credibility of users, harnessing the dynamics of information flow in the underlying social graph and tweet content. [2] analyzes both topical content of information sources and social network structure to find credible information sources in social networks. Information credibility in tweets has been studied in [11]. [33] conducts a user study to analyze various factors like contrasting viewpoints and expertise affecting the truthfulness of controversial claims. However, none of these prior works analyze the interplay between sources, language, topics, and users.
The works closest to our problem and approach are [34, 23]. [34] presents an algorithm for propagating trust scores in a heterogeneous network of claims, sources, and documents. [23] proposes a method to jointly learn user trustworthiness, statement credibility, and language objectivity in online health communities. However, these works do not analyze the role of topics, language bias, user perspective, expertise, and fine-grained interactions in community.
Bias in social communities and media: The use of biased language in Wikipedia and similar collaborative communities has been studied in [9, 28]. Even more broadly, the task of characterizing subjective language has been addressed, among others, in [37, 19]. The influence of different kinds of bias in online user ratings has been studied in [30, 6]. [6] proposes an approach to handle users who might be subjectively different or strategically dishonest.
Citizen journalism: [29] defines citizen journalism as “the act of a citizen or group of citizens playing an active role in the process of collecting, reporting, analyzing and dissemination of news and information to provide independent, reliable, accurate, wide-ranging and relevant information that a democracy requires.” [31] focuses on user activities like blogging in community news websites. Although the potential of citizen journalism is greatly highlighted in the recent Arab Spring [12], misinformation can be quite dangerous when relying on users as news sources (e.g., the reporting of the Boston Bombings in 2013 [25]).
7 Conclusions
In this work, we analyzed the effect of different factors like language, topics and perspectives on the credibility rating of articles in a news community. These factors and their mutual interactions are the features of a novel model for jointly capturing credibility of news articles, trustworthiness of news sources and expertise of users. From an application perspective, we demonstrated that our method can reliably identify credible articles, trustworthy sources and expert users in the community.
As future work, we plan to model and analyze the temporal evolution of the factors associated with each of the components in our model. We have a strong intuition that time has a significant influence on the trustworthiness of sources and credibility of news.
References
- [1] D. M. Blei, A. Y. Ng, and M. I. Jordan. Latent dirichlet allocation. J. Mach. Learn. Res., 3, 2003.
- [2] K. R. Canini, B. Suh, and P. Pirolli. Finding credible information sources in social networks based on content and social structure. In PASSAT, 2011.
- [3] C. Castillo, M. Mendoza, and B. Poblete. Information credibility on twitter. In WWW, 2011.
- [4] H. Drucker, C. J. C. Burges, L. Kaufman, A. J. Smola, and V. Vapnik. Support vector regression machines. In NIPS, 1996.
- [5] H. J. Einhorn, R. M. Hogarth, and E. Klempner. Quality of group judgment. Psychological Bulletin, 1977.
- [6] H. Fang, J. Zhang, and N. Magnenat Thalmann. Subjectivity grouping: Learning from users’ rating behavior. In AAMAS, 2014.
- [7] B. J. Fogg. Prominence-interpretation theory: explaining how people assess credibility online. In CHI, 2003.
- [8] Gallup.com. Americans’ confidence in newspapers continues to erode. http://www.gallup.com/poll/163097/americans-confidence- newspapers-continues-erode.aspx. Accessed: 2015-05-07.
- [9] S. Greene and P. Resnik. More than words: Syntactic packaging and implicit sentiment. In NAACL, 2009.
- [10] S. Günnemann, N. Günnemann, and C. Faloutsos. Detecting anomalies in dynamic rating data: A robust probabilistic model for rating evolution. KDD, 2014.
- [11] A. Gupta and P. Kumaraguru. Credibility ranking of tweets during high impact events. In PSOSM, 2012.
- [12] P. N. Howard, A. Duffy, D. Freelon, M. Hussain, W. Mari, and M. Mazaid. Opening closed regimes: What was the role of social media during the arab spring? 2011.
- [13] K. Järvelin and J. Kekäläinen. Cumulated gain-based evaluation of IR techniques. ACM Trans. Inf. Syst., 20(4), 2002.
- [14] B. Kang, J. O’Donovan, and T. Höllerer. Modeling topic specific credibility on twitter. In IUI, 2012.
- [15] Y. Koren. Factorization meets the neighborhood: A multifaceted collaborative filtering model. KDD, 2008.
- [16] C. Lampe and R. K. Garrett. It’s all news to me: The effect of instruments on ratings provision. In HICSS, 2007.
- [17] S. C. Lewis, K. Kaufhold, and D. L. Lasorsa. Thinking about citizen journalism: The philosophical and practical challenges of user-generated content for community newspapers. Journalism Practice, 4(2), 2010.
- [18] C. Lin and Y. He. Joint sentiment/topic model for sentiment analysis. CIKM, 2009.
- [19] C. Lin, Y. He, and R. Everson. Sentence subjectivity detection with weakly-supervised learning. In IJCNLP, 2011.
- [20] J. McAuley and J. Leskovec. Hidden factors and hidden topics: Understanding rating dimensions with review text. RecSys, 2013.
- [21] J. J. McAuley and J. Leskovec. From amateurs to connoisseurs: modeling the evolution of user expertise through online reviews. In WWW, 2013.
- [22] S. Mukherjee, G. Basu, and S. Joshi. Joint author sentiment topic model. In SDM, 2014.
- [23] S. Mukherjee, G. Weikum, and C. Danescu-Niculescu-Mizil. People on drugs: Credibility of user statements in health communities. KDD, 2014.
- [24] Nber.org. Media bias and voting. http://www.nber.org/digest/oct06/w12169.html. Accessed: 2015-05-07.
- [25] Nytimes.com. Should reddit be blamed for the spreading of a smear? http://www.nytimes.com/2013/07/28/magazine/should-reddit-be- blamed-for-the-spreading-of-a-smear.html. Accessed: 2015-05-07.
- [26] T. Qin, T. Liu, X. Zhang, D. Wang, and H. Li. Global ranking using continuous conditional random fields. NIPS, 2008.
- [27] V. Radosavljevic, S. Vucetic, and Z. Obradovic. Continuous conditional random fields for regression in remote sensing. ECAI, 2010.
- [28] M. Recasens, C. Danescu-Niculescu-Mizil, and D. Jurafsky. Linguistic models for analyzing and detecting biased language. In ACL, 2013.
- [29] B. Shayne and W. Chris. We media: How audiences are shaping the future of news and information. 2003.
- [30] Sloanreview.mit.edu. The problem with online ratings. http://sloanreview.mit.edu/article/the-problem-with-online-ratings-2/ . Accessed: 2015-05-07.
- [31] A. Stuart. Citizen journalism and the rise of ‘mass self-communication’: Reporting the london bombings. Global Media, 1(1), 2007.
- [32] B. Tadas, P. Robinson, and L. Morency. Continuous conditional neural fields for structured regression. In ECCV, 2014.
- [33] V. Vydiswaran et al. BiasTrust: Teaching biased users about controversial topics. CIKM, 2012.
- [34] V. V. Vydiswaran, C. Zhai, and D. Roth. Content-driven trust propagation framework. In KDD, 2011.
- [35] H. Wang et al. Latent aspect rating analysis without aspect keyword supervision. KDD, 2011.
- [36] R. West, H. S. Paskov, J. Leskovec, and C. Potts. Exploiting social network structure for person-to-person sentiment analysis. TACL, 2(2), 2014.
- [37] J. Wiebe and E. Riloff. Creating subjective and objective sentence classifiers from unannotated texts. In CICLing, 2005.