Critical Role of the Exchange Interaction for the Electronic Structure and Charge-Density-Wave Formation in TiSe2
Abstract
We show that the inclusion of screened exchange via hybrid functionals provides a unified description of the electronic and vibrational properties of TiSe2. In contrast to local approximations in density functional theory, the explicit inclusion of exact, non-local exchange captures the effects of the electron-electron interaction needed to both separate the Ti- states from the Se- states and stabilize the charge-density-wave (CDW) (or low-T) phase through the formation of a hybridized state. We further show that this leads to an enhanced electron-phonon coupling that can drive the transition even if a small gap opens in the high-T phase. Finally, we demonstrate that the hybrid functionals can generate a CDW phase where the electronic bands, the geometry, and the phonon frequencies are in agreement with experiments.
The charge density wave (CDW) instability is a common phenomenon in layered semi-metallic transition metal dichalcogenides (TMDs) [1] and has attracted considerable interest over the years, from both the experimental and the theoretical side. The CDW phase is often found to compete with superconductivity and thus plays a similar role as the anti-ferromagnetic phase in strongly correlated heavy fermion systems or in high-Tc cuprates [2, 3, 4, 5]. This intriguing similarity has stimulated the search for a better understanding of the physical mechanism behind the CDW instability in TMDs [6].
The CDW instability in TiSe2 is one of the most studied and debated. On the experimental side, neutron diffraction [7] and X-ray scattering [8] have established the existence of a commensurate structural transition at 200 K. This is confirmed by angle resolved photo emission spectroscopy (ARPES) as well as by transport measurements [7], where an abrupt increase in resistivity is found at the same temperature. However, upon further cooling the resistivity reaches an anomalous maximum [7], after which a weak metallic behaviour is observed. By contrast, ARPES finds an insulating low-T phase, with a gap of approximately 0.15 eV [9, 10, 11, 12, 13, 14]. In the high-T phase ARPES has not been able to conclude whether the system is semi-metallic or semi-conducting due to the very small indirect (possibly negative) gap. Theoretically, this fact makes TiSe2 an ideal candidate to exhibit an excitonic insulator phase [15, 9, 16, 17] for which the CDW transition is driven by a purely electronic instability. Some recent experiments [18] partly support this scenario. On the other hand, excitonic correlations alone are insufficient as demonstrated in Ref. 19.
Additional experimental evidence for the CDW instability has been provided by vibrational spectra as a function of temperature. A complete softening of an optical phonon at the -point has been observed in inelastic X-ray scattering experiments [20]. In Raman and infrared (IR) spectroscopy the transition is detected by the appearance of a large number of new modes [21, 22], some of which can be related to the CDW transition due to their strong temperature dependence.
On the theoretical side, density functional theory (DFT) within the standard local density approximation (LDA) or the semi-local PBE approximation predicts a structural instability at the correct wave vector [23, 20, 24] emphasising the role of the lattice distortion. However, orbital occupations obtained from the electronic band structure are in disagreement with ARPES measurements and CDW phonon frequencies strongly deviate from experiments. This suggests that a proper inclusion of exchange and correlations effects may be crucial to describe the CDW instability. It has been shown that the inclusion of nonlocal exchange already gives a much better description of the electronic bands in both the high- and low-T phase [25, 26, 13, 14, 27]. In Ref. 24 it was further shown that also the DFT+U approach improves the electronic band structure, bringing it into good agreement with ARPES spectra. This seeming improvement, however, was accompanied by a complete loss of the CDW instability.
In this work we provide a unified description of both the electronic band structure and the lattice dynamics of TiSe2, and give a physical explanation for the CDW instability based on first-principle calculations. By an inclusion of exact-exchange within the hybrid functionals we capture the strong Coulomb repulsion due to the localised Ti--states, thus correcting the orbital occupations. We also capture the long-range exchange interaction which enhances the electron-phonon coupling (EPC) and stabilizes the CDW phase through the formation of a Ti--Se- hybridized state.
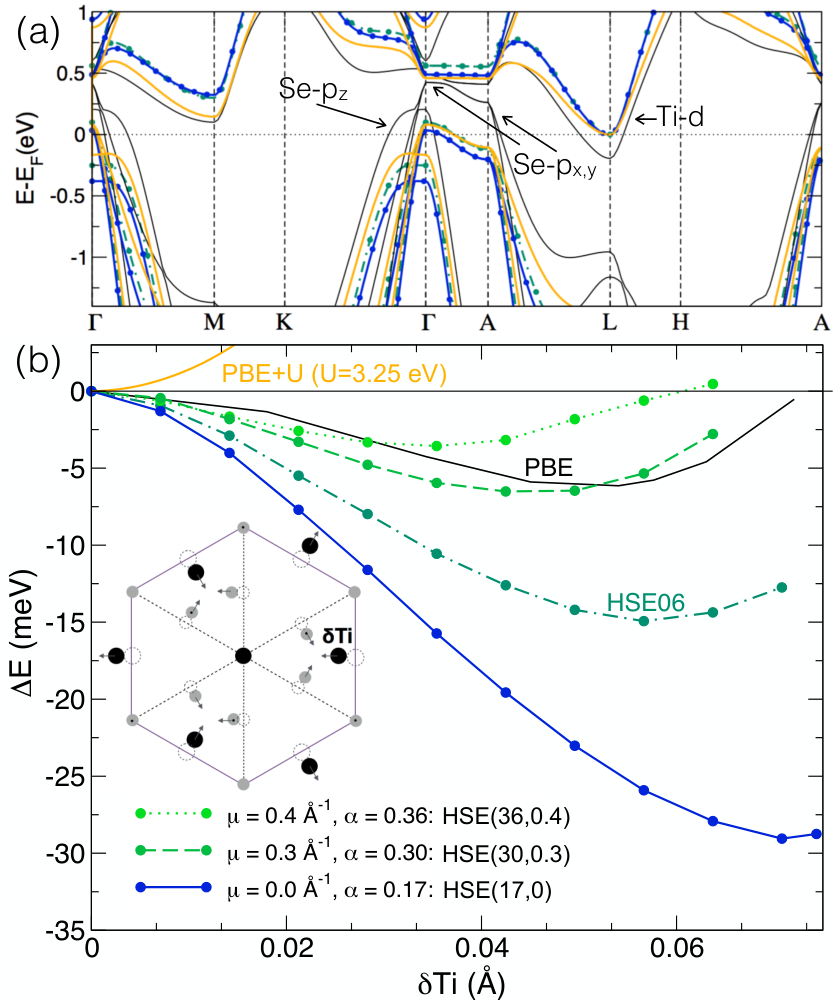
TiSe2 is a layered material which in the high-T phase (200 K) crystallises in the space group . The CDW phase is characterised by a 222 superstructure with a different space group . The PBE phonon dispersion of the high-T phase was analysed in Refs. 23 and 24. The distortion pattern (see Eq. 9 in Ref. 24) associated with the imaginary phonon frequencies at the three equivalent points is of Au symmetry and its projection on a single TiSe2 layer is shown in the inset of Fig. 1(b). It is completely identified by its symmetry, the magnitude of the displacement and the ratio . The layers are held together by van der Waals (vdW) forces and in the CDW phase adjacent layers are rotated by 60 degrees. We verified that the vdW forces [28] do not play a role in the CDW distortion and by using the experimentally determined and lattice parameters [29], we indirectly account for the vdW contribution to the structure (see also Refs. [24, 30]). Although the spin-orbit coupling (SOC) splits the Se- energy levels [26] it only gives a small contribution to the energetics [30]. Due to the increased computational cost we have therefore omitted SOC in the calculations presented here. Local functionals in DFT such as PBE give rise to an excess of electron occupation on the Ti--states compared to ARPES, mainly due to the large band overlap but also due to the overestimated band overlap (see black curve in Fig. 1 (a)). To cure this problem it is necessary to include the Coulomb repulsion or ’U’ due to the localised Ti- states. A simple corrective procedure to incorporate this effect is the DFT+U approach [31]. Indeed, in Ref. 24 it was shown that the band overlap reduced significantly (see orange curve Fig. 1 (a)). However, it was also found that the energy gain in the distortion decreases by increasing ’U’ [30]. The hybrid functionals contain a fraction of exact-exchange and therefore naturally incorporate the repulsive ’U’ interaction [32]. In addition, they exhibit the long-range exchange interaction, which generates the attractive electron-hole interaction at the linear response level [33, 34]. The description of screening is rather simplified using a pre-factor and a range-separated Coulomb potential defined by . These parameters can be fitted in various ways but often the HSE06 parameters () give good results [35]. In this work we have used the freedom of varying () to reveal the critical role played by exchange, and to shed light on the mechanism that drives the CDW transition in TiSe2.
In Fig. 1 (a) we plot the results for the band structure in the high-T phase with PBE, PBE+U and HSE06 [30, 37, 38, 39, 40, 41]. In Fig. 1 (b) we plot the corresponding energy gain as a function of by displacing the atoms according to the CDW pattern (using the experimentally determined ratio [7]). We found HSE06 to give an enhanced negative curvature and energy gain of approximately a factor of 2 compared to PBE. This difference is mainly attributed to an overscreening at the PBE level, i.e., due to the overestimation of the metallicity of the system. However, this is not the complete picture. We see that PBE+U and HSE06 have almost identical orbital occupations and gaps - both in rather good agreement with experiment [13, 14, 30] - but in PBE+U the instability is absent. This suggest that the long-range (or nonlocal) Coulomb exchange interaction is important for the formation of the CDW phase, as demonstrated explicitly in Figure 1 (b). We have calculated the energy gain using a set of () parameters all tuned to give similar band-structures to HSE06 and PBE+U. By reducing the range, i.e., by increasing , thus approaching the PBE+U limit, the instability quickly vanishes (green curves). Instead, with an infinite range (HSE(17,0)) the energy gain increases substantially as does the amplitude of the distortion. After relaxing the atomic positions in the CDW phase, we find with PBE, HSE06 and HSE(17,0) respectively. In experiment, [7], thus suggesting a long-range (or unscreened) Coulomb interaction. Based on the above analysis, we will continue to discuss the mechanism for the CDW transition, but first we analyze the properties of the CDW phase.
The electronic band structure in comparison with ARPES suggests that the CDW phase is accurately captured with hybrid functionals [30, 14]. However, as seen above, a good description of the band structure alone is insufficient. The vibrational frequencies are proportional to the second derivative of the energy and thus provide an additional stringent test for the validity of different approximations. We have calculated the harmonic Raman and IR active phonon frequencies in the CDW phase within both HSE06 and the infinite range HSE(17,0) using a finite difference approach as implemented in the CRYSTAL code [42].
In Fig. 2 we compare the theoretical frequencies with low-T experimental Raman [36] and IR [21] frequencies (at 11 K and 20 K, respectively). We analyze the spectra of the CDW phase by back-folding of the phonons at , and of the high-T phase Brillouin zone (see HSE06 phonon dispersion 11 1 The phonon dispersion is approximated on a 222 q-grid. in Fig. 2 (a)) onto the point of the low-T phase Brillouin zone [30]. In the following, the high-symmetry points of the 222 supercell are marked with a bar. For all three approximations, we find an overall good agreement with the experimental results [44, 36, 21, 45, 46, 47]. However, there are three notable exceptions of particular interest for this work: these are the modes related to the instabilities of the high-T structure (marked by vertical dashed lines). The three-fold degenerate imaginary phonon frequency at splits into one A1g and a two-fold degenerate Eg mode, which are both Raman active. These have been previously identified as being related to the CDW transition from their experimental temperature dependence [21, 22]. In fact, the A1g (amplitude) mode corresponds to the oscillations of the CDW order parameter. The imaginary phonon frequency at similarly gives rise to an Eu IR active phonon and to one A1u inactive mode. The frequencies of the CDW modes are systematically underestimated by PBE (20% and 30% for the A1g and Eg modes, respectively). HSE06 brings these frequencies in much better agreement with experiment (now underestimated by 4% and 7%, respectively). HSE(17,0), which gave the best geometry, also gives excellent CDW mode frequencies (overestimated by 5% and 2%, respectively). Since the frequencies of these modes depend very sensitively on the CDW potential energy surface (compare Fig. 1 (b)), they represent an important confirmation that the hybrid functionals reliably reproduce the electronic structure of TiSe2.
With a reliable description of the vibrational and electronic properties, we can now analyze in detail the physical mechanism that is responsible for the CDW instability in TiSe2. Figure 3 (a) shows the HSE06 band structure in both the low-T and high-T phase (the latter one is back-folded into the Brillouin zone that corresponds to the 222 supercell of the low-T phase). At the CDW distortion, the three-fold degenerate Ti- band splits into a band with dominant character derived from the Ti atom in the supercell that does not move with the distortion, and a two-fold degenerate band with Ti- and Se- hybridization in a small region around due to the interaction between the and states. Similarly, the Se- bands move to lower energy and hybridize with Ti- states around . Such hybridization, discussed also in Refs. 48, 11, 49, is observed by studying the site-projected orbitals onto spherical harmonics before and after the transition. Panel (b) presents a zoom of the region around , showing the effect of a small distortion on the electronic structure. We see that the distortion only changes the gap while leaving the rest of the electronic structure almost unaffected. We can therefore assume that it is mainly the states around which are involved in the transition and extract the EPC, or, more precisely, the deformation potential for the different approximations. The deformation potential is defined as , where the variation of the total self-consistent potential is taken with respect to the magnitude of the distortion. The states and with energy difference are obtained from the Ti- and Se- states at and in the undistorted unit cell by back-folding them onto in the supercell. Without loss of generality, all quantities can be taken as real in the supercell. The and states are superimposed and illustrated in Fig. 3 (c) together with the hybridized state in the CDW phase. We also note from first order perturbation theory that and hence (at fixed ) measures the overlap between the variation of the state with the distortion and the undistorted state. We then obtain using a finite difference approach [50]. At small but finite we construct the submatrix of the Hamiltonian : , and and diagonalize it to obtain , where is the gap upon the distortion and we have discarded the higher order terms in . The results obtained from this procedure can be found in Fig. 3 (d). Although some coupling already exists between and states at the PBE level, the deformation potential (and so the EPC) is strongly enhanced via the nonlocal exchange potential in provided by the inclusion of long-range exchange. Indeed, a comparison between PBE and PBE+U shows that U has no effect on the EPC. For the approximations with the same band structure we see the same trend in Figs. 1 (b) and 3 (d) and hence we conclude that it is the nonlocal exchange interaction that determines the strength of the instability. The inclusion of SOC splits and slightly changes the dispersion of the Se- bands close to the Fermi level but has only a small quantitative effect on the EPC [51, 30].

Our result goes in line with some previous findings that the EPC can be strongly enhanced by nonlocal exchange, notably in weakly doped 2D materials [50, 53, 54, 55] and some high-Tc superconductors [56]. Although the band structure in HSE06, which we used as a reference, has a small negative gap (-0.1 eV) in the high-T phase, the instability does not crucially depend on the existence of a Fermi surface. In fact, due to the enhanced EPC, the CDW phase can exist even if the gap in the high-T phase is positive. This is easily demonstrated by increasing the amount of exact-exchange (). With fixed, the instability persists up to when the gap is as large as 0.2 eV. At larger values of the gap (or ) the hybridization of Ti- -and Se- bands is suppressed and the instability disappears. If we instead decrease the energy gain reaches a maximum around . At smaller values of the CDW phase becomes metallic and the energy gain drops. This unusual behaviour as a function of (or the gap) shares some features with the excitonic insulator transition (EIT) of Kohn et al.[15, 57]. The EIT arises in a two band model (similar to the and bands in TiSe2) when tuned until the value of the gap is smaller than the exciton binding energy. As a result, and orbitals mix and form a new ground state with lower symmetry. Since the symmetry of the lattice is kept fixed, the EIT is a purely electronic effect. In our calculations it was not possible to generate a symmetry lowering of the electronic density alone. The mechanism that we found relies on the simultaneous lattice distortion and strong EPC, enhanced by the exchange interaction. Whether the system is still influenced by excitonic effects can be determined by studying the excitation spectrum, but this we leave for future work.
M.H. and L.W. gratefully acknowledge financial support from the FNR (projects RPA-phonon and INTER/ANR/13/20/NANOTMD). The authors acknowledge support from the European Union Horizon 2020 research and innovation programme under Grant agreement No. 696656-GrapheneCore1. and by Agence Nationale de la Recherche under the reference n. ANR-13-IS10-0003-01 and by Prace. Calculations were performed at IDRIS, CINES, CEA and BSC TGCC. The authors are grateful to K. Rossnagel, for having supplied to them the image data of ARPES experiment.
References
- [1] J. A. Wilson, F. J. D. Salvo, and S. Mahajan, Advances in Physics 24, 117 (1975).
- [2] S. Y. Li, G. Wu, X. H. Chen, and L. Taillefer, Phys. Rev. Lett. 99, 107001 (2007).
- [3] A. F. Kusmartseva, B. Sipos, H. Berger, L. Forró, and E. Tutiš, Phys. Rev. Lett. 103, 236401 (2009).
- [4] E. Morosan, H. W. Zandbergen, B. S. Dennis, J. W. G. Bos, Y. Onose, T. Klimczuk, A. P. Ramirez, N. P. Ong, and R. J. Cava, Nat Phys 2, 544 (2006).
- [5] D. Qian, D. Hsieh, L. Wray, E. Morosan, N. L. Wang, Y. Xia, R. J. Cava, and M. Z. Hasan, Phys. Rev. Lett. 98, 117007 (2007).
- [6] K. Rossnagel, J. Phys.: Condens. Matter 23, 213001 (2011).
- [7] F. J. Di Salvo, D. E. Moncton, and J. V. Waszczak, Phys. Rev. B 14, 4321 (1976).
- [8] Y. I. Joe, X. M. Chen, P. Ghaemi, K. D. Finkelstein, G. A. de la Pena, Y. Gan, J. C. T. Lee, S. Yuan, J. Geck, G. J. MacDougall, T. C. Chiang, S. L. Cooper, E. Fradkin, and P. Abbamonte, Nat Phys 10, 421 (2014).
- [9] T. Pillo, J. Hayoz, H. Berger, F. Lévy, L. Schlapbach, and P. Aebi, Phys. Rev. B 61, 16213 (2000).
- [10] T. E. Kidd, T. Miller, M. Y. Chou, and T.-C. Chiang, Phys. Rev. Lett. 88, 226402 (2002).
- [11] K. Rossnagel, L. Kipp, and M. Skibowski, Phys. Rev. B 65, 235101 (2002).
- [12] H. Cercellier, C. Monney, F. Clerc, C. Battaglia, L. Despont, M. G. Garnier, H. Beck, P. Aebi, L. Patthey, H. Berger, and L. Forró, Phys. Rev. Lett. 99, 146403 (2007).
- [13] P. Chen, Y. H. Chan, X. Y. Fang, Y. Zhang, M. Y. Chou, S. K. Mo, Z. Hussain, A. V. Fedorov, and T. C. Chiang, Nature Commun. 6, 8943 (2015).
- [14] Y.-H. P. Chen, X. Chan, S. Fang, Z. Mo, Z. Hussain, A. V. Fedorov, M. Chou, and T. C. Chiang, Scientific Reports 6, 37910 (2016).
- [15] D. Jérome, T. M. Rice, and W. Kohn, Phys. Rev. 158, 462 (1967).
- [16] C. Monney, H. Cercellier, F. Clerc, C. Battaglia, E. F. Schwier, C. Didiot, M. G. Garnier, H. Beck, P. Aebi, H. Berger, L. Forró, and L. Patthey, Phys. Rev. B 79, 045116 (2009).
- [17] C. Monney, C. Battaglia, H. Cercellier, P. Aebi, and H. Beck, Phys. Rev. Lett. 106, 106404 (2011).
- [18] T. Rohwer, S. Hellmann, M. Wiesenmayer, C. Sohrt, A. Stange, B. Slomski, A. Carr, Y. Liu, L. M. Avila, M. Kallane, S. Mathias, L. Kipp, K. Rossnagel, and M. Bauer, Nature 471, 490 (2011).
- [19] M. Porer, U. Leierseder, J. M. Ménard, H. Dachraoui, L. Mouchliadis, I. E. Perakis, U. Heinzmann, J. Demsar, K. Rossnagel, and R. Huber, Nat Mater 13, 857 (2014).
- [20] F. Weber, S. Rosenkranz, J.-P. Castellan, R. Osborn, G. Karapetrov, R. Hott, R. Heid, K.-P. Bohnen, and A. Alatas, Phys. Rev. Lett. 107, 266401 (2011).
- [21] J. A. Holy, K. C. Woo, M. V. Klein, and F. C. Brown, Phys. Rev. B 16, 3628 (1977).
- [22] C. S. Snow, J. F. Karpus, S. L. Cooper, T. E. Kidd, and T.-C. Chiang, Phys. Rev. Lett. 91, 136402 (2003).
- [23] M. Calandra and F. Mauri, Phys. Rev. Lett. 106, 196406 (2011).
- [24] R. Bianco, M. Calandra, and F. Mauri, Phys. Rev. B 92, 094107 (2015).
- [25] M. Cazzaniga, H. Cercellier, M. Holzmann, C. Monney, P. Aebi, G. Onida, and V. Olevano, Phys. Rev. B 85, 195111 (2012).
- [26] Z. Vydrova, E. F. Schwier, G. Monney, T. Jaouen, E. Razzoli, C. Monney, B. Hildebrand, C. Didiot, H. Berger, T. Schmitt, V. N. Strocov, F. Vanini, and P. Aebi, Phys. Rev. B 91, 235129 (2015).
- [27] Z. Zhu, Y. Cheng, and U. Schwingenschlögl, Phys. Rev. B 85, 245133 (2012).
- [28] S. Grimme, Journal of Computational Chemistry 27, 1787 (2006).
- [29] C. Riekel, Journal of Solid State Chemistry 17, 389 (1976).
- [30] See Supplemental Material for further details.
- [31] V. I. Anisimov, J. Zaanen, and O. K. Andersen, Phys. Rev. B 44, 943 (1991).
- [32] B. Himmetoglu, A. Floris, S. de Gironcoli, and M. Cococcioni, International Journal of Quantum Chemistry 114, 14 (2014).
- [33] J. Paier, M. Marsman, and G. Kresse, Phys. Rev. B 78, 121201 (2008).
- [34] A.-M. Ferrari, R. Orlando, and M. Rerat, J. Chem. Theory and Comput. 11, 3245 (2015).
- [35] J. Heyd, G. E. Scuseria, and M. Ernzerhof, The Journal of Chemical Physics 118, 8207 (2003).
- [36] S. Sugai, K. Murase, S. Uchida, and S. Tanaka, Solid State Communications 35, 433 (1980).
- [37] P. Giannozzi et al, J. Phys.: Condens. Matter 21, 395502 (2009).
- [38] R. Dovesi, R. Orlando, A. Erba, C. M. Zicovich-Wilson, B. Civalleri, S. Casassa, L. Maschio, M. Ferrabone, M. D. L. Pierre, P. Darco, Y. Noel, M. Causa, M. Rerat, and B. Kirtman, Int. J. Quantum Chem. 114, 1287 (2014).
- [39] G. Kresse and J. Furthmüller, Phys. Rev. B 54, 11169 (1996a).
- [40] G. Kresse and J. Furthmüller, Comput. Mater. Sci. 6, 15 (1996b).
- [41] G. Kresse and D. Joubert, Phys. Rev. B 59, 1758 (1999).
- [42] F. Pascale, C. Zicovich-Wilson, F. Lopez, B. Civalleri, R. Orlando, and R. Dovesi, J. Comput. Chem. 25, 888 (2004).
- [43] The phonon dispersion is approximated on a 222 q-grid.
- [44] S. Uchida and S. Sugai, Physica B+C 105, 393 (1981).
- [45] W. Y. Liang, G. Lucovsky, J. C. Mikkelsen, and R. H. Friend, Philosophical Magazine Part B 39, 133 (1979).
- [46] J. A. Wilson, physica status solidi (b) 86, 11 (1978).
- [47] D. L. Duong, G. Ryu, A. Hoyer, C. Lin, M. Burghard, and K. Kern, ACS Nano 11, 1034 (2017).
- [48] N. G. Stoffel, S. D. Kevan, and N. V. Smith, Phys. Rev. B 31, 8049 (1985).
- [49] J. van Wezel, P. Nahai-Williamson, and S. S. Saxena, Phys. Rev. B 81, 165109 (2010).
- [50] M. Lazzeri, C. Attaccalite, L. Wirtz, and F. Mauri, Phys. Rev. B 78, 081406 (2008).
- [51] M. J. Verstraete, M. Torrent, F. Jollet, G. Zérah, and X. Gonze, Phys. Rev. B 78, 045119 (2008).
- [52] The iso-surface of the square of the Bloch orbitals were obtained within HSE06 using VASP and VESTA (K. Momma and F. Izumi, J. Appl. Crystallogr., 44, 1272 (2011)).
- [53] C. Attaccalite, L. Wirtz, M. Lazzeri, F. Mauri, and A. Rubio, Nano Letters 10, 1172 (2010).
- [54] M. Calandra, P. Zoccante, and F. Mauri, Phys. Rev. Lett. 114, 077001 (2015).
- [55] B. Pamuk, J. Baima, R. Dovesi, M. Calandra, and F. Mauri, Phys. Rev. B 94, 035101 (2016).
- [56] Z. P. Yin, A. Kutepov, and G. Kotliar, Phys. Rev. X 3, 021011 (2013).
- [57] W. Kohn, Phys. Rev. Lett. 19, 439 (1967).
I Supplemental material for:
Critical Role of the Exchange Interaction for the Electronic Structure and Charge-Density-Wave Formation in TiSe2
Below we present further details on the computational procedures, high-T phase crystal structure, phonon frequencies, PBE+U calculations, spin-orbit coupling and electronic structure compared to ARPES.
II Computational details
Results with PBE and PBE+U were obtained with Quantum ESPRESSO [37] and results with HSE06 with VASP [39, 40] within the projector-augmented-wave (PAW) method. [41] A plane-wave cut-off of 320 eV was used and semi-core electrons were included in the Ti PAW potential. Results were converged with a -point mesh in the high-T cell. For most calculations presented in the manuscript we used the all-electron CRYSTAL code [38] with an adapted molecular def2-TZVP basis set for solid state calculations. The results for the energy gain in HSE06 was within 1 meV/supercell in agreement between VASP and CRYSTAL (see Fig. 6 below).
III High-T phase crystal structure
In Table 1 we present the experimental and theoretical lattice parameters and Se--positions of the high-T phase structure. The parameter is the in-plane hexagonal lattice constant, is the distance between layers and is the distance between the Ti and Se layers. The hybrid functionals in combination with a simple Grimme D2[28] van der Waals correction give lattice parameters in good agreement with experiments. In our calculations we have, however, consistently used the experimental lattice parameters but relaxed atomic positions. Only the energy gain curves in Fig. 1 (b) of the manuscript were obtained with fixed Se--positions and fixed ratio. At the minimum the atomic positions were again relaxed as described in the manuscript. In Fig. 1 we show the in-plane crystal structure in the high -and low-T phases. Big blue dots signifies Ti atoms and small green dots Se atoms. A dot on the Se atom indicates that the atom is on the opposite side of the Ti layer as compared to the Se atom without the dot. We have also replotted in a larger scale the , and -hybridized orbitals of Fig. 3 (c) in the manuscript.
| Exp.[29] | PBE | HSE06 | HSE(17,0) | |
| a() | 3.540 | 3.519 | 3.528 | 3.531 |
| c() | 6.007 | 6.130 | 6.104 | 6.113 |
| h() | 1.532 | 1.555 | 1.522 | 1.527 |

IV Phonon frequencies in the high-T phase
The phonon frequencies in the high-T phase are reported in Table 2. In the high-T phase the phonons are measured at room temperature and thus cannot be calculated exactly within the harmonic approximation. Indeed, the two Raman active phonons at 200 cm-1(A1g) and at 136 cm-1 (Eg) are overestimated by hybrid functionals. It is expected that thermal effects would soften these values, and this trend was seen in experiment at least for the Eg mode in the high-T phase.[47] On the contrary, the IR active mode around 140 cm-1 is underestimated, with both HSE06 and HSE(17,0). This mode belongs to the same phonon branch as the soft mode at which drives the instability and should thus harden significantly with temperature. Such behaviour can also be seen in experiment.[44]
| Symm. | Exp. | PBE | HSE06 | HSE(17,0) |
|---|---|---|---|---|
| Eg (R) | 136[36] (273 K) / 134[21] (300 K) | 136.9 | 147.5 | 147.3 |
| Eu (I) | 143[45] (300 K) /137[21] (300 K) | 141.5 | 124.8 | 101.1 |
| A1g (R) | 200[36] (273 K) /194[21] (300 K) | 195.6 | 209.5 | 207.9 |
| A2u | - | 292.7 | 323.8 | 314.4 |
V Phonon frequencies in the low-T phase
Tables 3, 4 and 5 report the computed Raman and infrared active frequencies in the CDW phase, comparing them to the peaks identified in several experimental spectra. They also contain an analysis of the CDW spectra in terms of back-folding of phonon modes from the Brillouin zone of the high-T phase. The -points of the original lattice folded onto in the supercell are and with weights 1, plus and with weights 3. By applying crystalline translations, all the phonon eigenvectors at of the undistorted supercell are obtained from the phonon eigenvectors at the previously mentioned -points of the unit cell. The degeneracy between frequencies at symmetry equivalent points is broken by the distortion, so that, e.g., the three degenerate modes from , and split into an and an representation.
We label the phonon eigenvectors at of the high-T phase. labels the -point the mode is back-folded from. We then label the eigenvectors of the distorted low-T phase. We define the decomposition of a mode as the square overlap with the eigenvectors of the undistorted supercell , and then sum over degenerate frequencies in the undistorted supercell. For any given we report in the tables the largest square overlaps as a function of (the ones larger than 10%), the frequency and the point .
| Symmetry | Exp. | Comment | Calc. | q | ||||
|---|---|---|---|---|---|---|---|---|
| 53 K [21] | 11K [36] | HSE(17,0) | HSE06 | PBE | HSE06 | |||
| Eg | 30 | 31 | 28 | A | 28.3 (100) | |||
| Eg | 74 | 78 | CDW | 80.3 | 72.6 | 55.9 | L | -126 (95) |
| Eg | 93 | 94 | 94.4 | 97.0 | 93.7 | L | 94.7 (97) | |
| A1g | 116 | 119 | CDW | 126 | 114 | 96.8 | L | -126 (75) + 117 (17) |
| Eg | 114 | 115 | 115 | 118 | 111 | L | 117 (100) | |
| A1g | 115 | 114 | 119 | 112 | L | 117 (83) + -126 (16) | ||
| Eg | 136 | 138 | 136,139 | 141,144 | 132,135 | A+M, | 133 (41)+152 (41) and 151 (50) +147 (35) | |
| Eg | 148 | weak | ||||||
| Eg | 154 | 155 | 144 | M+A | 150 (53) + 133 (34) | |||
| Eg | 154 | 157 | 148 | + L | 147 (54) + 152 (39) | |||
| A1g | 151,158,163 | weak | ||||||
| A1g | 173 | 176 | 180 | 180 | 166 | M | 177.1 (94) | |
| Eg | 179 | 179 | 168 | M+L+A | 177 (72) + 205 (15) + 133 (10) | |||
| A1g | 187 | 195 | 200 | 202 | 187 | M | 204 (93) | |
| Eg | 201 | 203 | 189 | M | 204 (83) + 205 (12) | |||
| A1g | 204 | 206 | 215 | 214 | 199 | 210 (92) | ||
| Eg | 212 | 217 | 215 | 202 | L +M | 207 (70) + 207 (12) | ||
| Eg | 314 | 317 | 327 | 328 | 297 | L | 320 (99) | |
| Exp. ref. | Exp. tr. | Comment | Calc. | q | |||||
|---|---|---|---|---|---|---|---|---|---|
| 18 K[45] | 20 K[21] | 28 K [44] | 4 K [46] | HSE(17,0) | HSE06 | PBE | |||
| 42 | 40 | 37 | weak | ||||||
| 52 | 47 | 49 | weak | ||||||
| 64 | 64 | 64 | weak | ||||||
| 76 | 74 | 72 | CDW | 73.3 | 67.5 | 66 | M | ||
| 90 | 88 | 100 | weak | 102 | 105 | 100 | M | ||
| 118.2 | 118 | 118 | 118 | weak | 119 | 123 | 115 | M | |
| 139.5 | 137 | 139 | 140 | 137,138 | 141,143 | 132,137 | +L,A+M | ||
| 151.3 | 152 | 152 | 153 | 152,155 | 154,156 | 143,150 | M+A,L+ | ||
| 162 | 166 | 164 | weak | ||||||
| 171.9 | 175 | 176 | 173 | 176 | 177 | 167 | L+M | ||
| 178 | 186 | weak | |||||||
| 196.9 | 198 | 198 | 198 | 203 | 205 | 192 | L+M | ||
| 213.0 | 214 | 211 | 219 | 217 | 205 | M+L | |||
| 222 | |||||||||
| 230 | 234 | ||||||||
| 280 | |||||||||
| 315 | 330 | 333 | 305 | M | |||||
| Symmetry | HSE(17,0) | PBE | HSE06 | q | HSE06 |
|---|---|---|---|---|---|
| Eu | 73.3 | 66.1 | 78.9 | M | -100 (96) |
| A2u | 101 | 99.7 | 105 | M | 102 (92) |
| Eu | 102 | 100 | 106 | M | 102 (96) |
| Eu | 119 | 115 | 123 | M | 122 (99) |
| Eu | 137 | 132 | 141 | +L | 124 (60) + 152 (30) |
| Eu | 138 | 136 | 143 | A+M | 149 (60) + 147 (30) |
| A2u | 143 | 137 | 150 | L+M | 152 (74) + 147 (25) |
| A2u | 146 | 139 | 151 | M+L | 147 (71) + 152 (26) |
| Eu | 152 | 143 | 155 | M+A | 147 (62) + 149 (33) |
| Eu | 155 | 150 | 158 | L+ | 152 (68) +124 (24) |
| Eu | 176 | 167 | 177 | L+M | 176 (75) + 207 (12) |
| Eu | 203 | 192 | 206 | L+M | 207 (78) + 207 (16) |
| A2u | 202 | 197 | 208 | M | 207 (98) |
| Eu | 219 | 205 | 218 | M+L | 207 (76) + 207 (15) |
| A2u | 320 | 296 | 328 | M | 323 (69) + 329 (30) |
| A2u | 326 | 301 | 332 | M | 329 (69) + 323 (30) |
| Eu | 330 | 305 | 334 | M | 329 (99) |
VI CDW instability as a function of U
In Fig. 5 we present the energy gain in the CDW distortion obtained with the PBE+U method for values of U between 0 to 2 eV. We see that the energy gain reduces monotonically with U and vanishes at 1.5 eV. This can be compared to the LDA+U result of U=2.5 eV in Ref. 24. The PBE+U band-structure agrees well with HSE06 at U=3.25 eV. The corresponding value in LDA+U is 3.5 eV.
VII Spin-orbit coupling
The calculations presented in the main paper were obtained without spin-orbit coupling (SOC). We did, however, also perform calculations including SOC (using VASP since SOC is not an available option in CRYSTAL). We verified that SOC only added a minor quantitative correction and did not change the qualitative analysis. Including SOC increases the computational cost substantially and we could therefore only carry out a limited number of calculations. Furthermore, to make the calculations feasible we had to omit the semi-core electrons in the Ti pseudo potential. This increases the energy gain but is not expected to change the effect of SOC, since SOC influences mainly the Se bands. The semi-core electrons are also not expected to largely influence the electron-phonon coupling (EPC) of the high-T phase. Indeed, we found a difference in the EPC of only 4%. In Fig. 6 we have summarised our analysis using HSE06. At large displacement Ti, the energy gain is around twice as large when omitting semi-core electrons. The effect is smaller, the smaller is the distortion, consistent with the fact that both the band structure and the EPC are very similar with and without semi-core electrons.
Including SOC we find only a very small change, the maximum being 2 meV at the minimum of the curve. At small distortion the difference is vanishingly small. The effect of SOC reduces the EPC in HSE06 from to , which is compensated by the change in band structure. Apart from the indirect effect of SOC on the orbitals and the self-consistent potential there is a direct effect due to extra SOC terms in the Hamiltonian.[51] Since these terms are semi-local and density independent, we expect them to give only a small contribution to the non-local EPC and to be the same for all HSE functionals having the same band structure. The indirect effect is also expected to be small and similar for all HSE functionals. Indeed, similarly to HSE06, a reduction of approximately is found for HSE(30,0.3), which is accompanied by an identical change in band structure, and no difference in energy gain. We therefore expect that the relative EPC strengths with SOC and non local functionals are qualitatively the same as those found without SOC.
VIII Electronic structure compared to ARPES
In order to compare the band structure with experiment it is important to take into account the Se- band splitting around in the high-T phase which is due to SOC. [26] In Fig. 7 we report calculated band structures in the high (a) -and low-T (b) phases superimposed on ARPES measurements by Rohwer et al.. [18] In the high-T phase we calculated the bands along (black), (orange) and along a line in between with (red). The band dispersions are well-reproduced and the band overlap () is only slightly overestimated with HSE06. The bands in the CDW phase are calculated at the minimum of the curve in Fig. 1b of the manuscript and we note that band gap is indirect between and . The gaps in HSE06 and HSE(17,0) are 0.21 eV and 0.35 eV, respectively. Both are somewhat overestimated compared to the experimental value which has been estimated to 0.15 eV.
