Prospects for Cherenkov Telescope Array Observations of the Young Supernova Remnant RX J1713.73946
Abstract
We perform simulations for future Cherenkov Telescope Array (CTA) observations of RX J1713.73946, a young supernova remnant (SNR) and one of the brightest sources ever discovered in very-high-energy (VHE) gamma rays. Special attention is paid to explore possible spatial (anti-)correlations of gamma rays with emission at other wavelengths, in particular X-rays and CO/Hi emission. We present a series of simulated images of RX J1713.73946 for CTA based on a set of observationally motivated models for the gamma-ray emission. In these models, VHE gamma rays produced by high-energy electrons are assumed to trace the non-thermal X-ray emission observed by XMM-Newton, whereas those originating from relativistic protons delineate the local gas distributions. The local atomic and molecular gas distributions are deduced by the NANTEN team from CO and Hi observations. Our primary goal is to show how one can distinguish the emission mechanism(s) of the gamma rays (i.e., hadronic vs leptonic, or a mixture of the two) through information provided by their spatial distribution, spectra, and time variation. This work is the first attempt to quantitatively evaluate the capabilities of CTA to achieve various proposed scientific goals by observing this important cosmic particle accelerator.
Keywords:
acceleration of particles — supernova remnants, RX J1713.73946, G347.30.5I Introduction
I.1 Origin of Galactic cosmic rays
The origin of Galactic cosmic rays (CRs) protons with energies up to eV (the so-called “knee”), has been one of the long-standing problems in astrophysics [36, 30, 22, e.g.,]. At present, young SNRs are the most probable candidates for being the major accelerators of CRs, which are sometimes also thought to have been potential “PeVatrons” (i.e., accelerators capable of producing charged particles at PeV scale). CRs of heavier species like iron may reach energies near the “second knee” at around eV. The detections of synchrotron X-rays in some SNRs have already shown evidence for the acceleration of electrons to ultra-relativistic energies at SNR shocks [65]. On the other hand, there remains the unresolved issue as to how efficiently SNRs are accelerating high-energy protons compared to electrons.
So far, VHE gamma-ray observations have revealed the existence of high-energy particles at the shock of young SNRs [e.g., 40, 14, 15, 60, 16, 17, 20, 18, 19, 7, 3, 5, see also Ferrand & Safi-Harb 2012]. Although the gamma rays are suggested to originate from either leptonic (low-energy photons up-scattered by high-energy electrons) or hadronic (-decay photons generated by accelerated protons colliding with surrounding gas) processes, it is generally a non-trivial task to distinguish these processes despite abundant multi-wavelength studies. As a result, we cannot yet provide an unequivocal proof for the paradigm that Galactic CRs are predominantly produced by young SNRs. It has been shown that the gamma-ray spectra of the middle-aged SNRs IC 443 and W44 have a sharp cutoff at low energies ( MeV), reminiscent of the bump that provides a direct proof for a hadronic origin of the gamma rays [54, 11]. However, the maximum CR energies inferred from the gamma rays detected in these SNRs are much lower than the “knee”, and their gamma-ray fluxes at VHE energies are very low [see e.g., 101, 70, for detailed emission models]. We hence expect that the younger SNR population is more qualified to be PeVatron candidates.
The acceleration mechanisms of CRs have also been studied for a long time. As of today, the most plausible physical process is suggested to be the diffusive shock acceleration (DSA) mechanism [28]. This is supported by the observational fact that some young SNRs are found to be gamma-ray bright around their shock fronts. Recent development of the DSA theory has revealed that the back-reaction of the accelerated CRs, that is their pressure against the incoming super-Alfvén gas flow in the shock frame, cannot be neglected if a large number of nuclear particles are accelerated to relativistic energies [35, 27, 73, e.g.,]. This can lead to strong modifications of the shock structure and a nonlinear coupling between the shock flow and CR acceleration. Some observational results are consistent with the predictions of such nonlinear DSA (NLDSA) models [102, 23, 24, 25, 105, 100, 55]. However, whether these models can fully explain all aspects revealed by the accumulating multi-wavelength observations still remains in doubt. For example, NLDSA models often predict a “concave” curvature in the CR spectrum in which the photon index decreases as CR energy increases. In such a case, the spectral index, , of the accelerated particles around the shock can be harder than 2.0 near the maximum energy if the acceleration is highly efficient 11 1 We consider a CR energy spectrum in the form of , where is the CR energy. [72, 27, 58]. This prediction appears to contradict the CR spectral indices of inferred from recent gamma-ray observations, radio spectral indices, and the CR spectrum at Earth. Recent modifications of the NLDSA theory did manage to reproduce indices softer than by, for example, invoking feedback effects from the self-generated magnetic turbulence in the shock precursor [33, 44, e.g.,]. Shock obliqueness and momentum dependence of the diffusion coefficient might be important for producing a softer index [43, e.g.,]. Another possible scenario is to consider the presence of neutral hydrogen in the acceleration region [82, 85, 29, 79] But the story is obviously far from complete before we reach an entire understanding of the plasma physics around strong collisionless shocks.
Furthermore, the important process of CR escape into the interstellar medium (ISM) is also uncertain. In general, the gamma-ray spectrum of young SNRs starts to decline around 10 TeV, so that the maximum energy of CRs is around 30–100 TeV. This is approximately two orders-of-magnitude lower than the knee energy. Therefore, to explain the knee feature in the CR spectrum at Earth, very young SNRs of ages yr are anticipated to experience a “PeVatron phase” [51] during which the highest-energy CRs are generated under strong magnetic fields associated with high-velocity shocks [103] and released into the ISM. However, we do not yet understand in detail when and how these high-energy particles escape from their acceleration sites to become Galactic CRs.
I.2 Origin of gamma rays from SNR RX J1713.73946
RX J1713.73946 (also known as a radio SNR G347.30.5 [95]), one of the brightest VHE gamma-ray sources ever detected [81, 40, 14, 16, 17], is an ideal target to study these unresolved mysteries. The distance and age of RX J1713.73946 are estimated to be 0.9–1.3 kpc and yrs, respectively [46, 80], which is consistent with its connection with the guest star AD393 [104, e.g.,]. This age estimate is supported by its fast shock velocity [59] and the similarities of its other observed properties to other young SNRs. So far, in comparison with other young shell-type SNRs, the VHE gamma-ray spectrum of RX J1713.73946 is the most precisely measured over a wide energy band (from 0.3 to 100 TeV) thanks to its high brightness. In addition to VHE gamma rays, observations in other wavebands are also available. These include lower-energy gamma rays detected by the Fermi Large Area Telescope (Fermi/LAT), synchrotron radio emission and X-rays, and radio line emission from CO molecules and Hi gas. Although weak thermal X-ray emission has recently been detected from the SNR interior [59], the X-ray emission is still dominated by synchrotron radiation, which links directly to the existence of high-energy electrons. Radio observations of CO and Hi gas have revealed a highly inhomogeneous medium surrounding the SNR, such as clumpy molecular clouds [46, 47, 48, 80, 92, 93, 94]. Another radio observation of CS also confirmed the existence of very dense ( cm-3) ISM core towards the SNR [77]. We are also aware that some of these characteristics are common among several other young SNRs, including RX J0852.04622 [60, 15, 18], RCW 86 [19], and HESS J1731347 [3]. It is noteworthy that no thermal X-ray emission has been firmly detected in these SNRs [66, 98, 26, e.g.,].
Prior to the Fermi era, the VHE gamma-ray spectrum of RX J1713.73946 above 300 GeV measured by H.E.S.S. was often suggested to be best explained by a hadronic model [16, 17] in which the gamma rays originate from the decay of mesons produced by CR protons interacting with the local gas. However, as Fermi/LAT measured the gamma-ray spectrum of RX J1713.73946 in the 3–300 GeV energy range, it turned out that the photon index () is one more typically expected from leptonic (i.e., inverse-Compton) emission from high-energy electrons with a spectral index of [2]. Fermi also reported a smooth connection between the hard GeV spectrum and the TeV domain with a spectral index of for GeV up to 1 TeV [12]. The conclusion on the leptonic origin of the gamma rays from this remnant has been reached by recent theoretical modelings [38, 68, e.g.,]. In this case, the flux ratio between synchrotron X-rays and inverse-Compton gamma rays suggests a magnetic field strength of –20 G. At first sight, this kind of value is inconsistent with the simple interpretation for the observed time variability [100] and thin filamentary structures [24, 87] of synchrotron X-rays through a fast energy loss of high-energy electrons, which typically requires G. Recent X-ray observations of the SNR RX J0852.04622, which show very similar features as RX J1713.73946, have however recovered a shallow steepening of the synchrotron index behind the shock as a function of radius, suggesting an average magnetic field near the shock of only a few G [62]. This has been shown to be consistent with theoretical models [69]. It has also been proposed that a fast X-ray time variability does not necessarily require high magnetic fields in extended regions behind the shock, For example Bykov [32] has shown that a steeply falling electron distribution in a turbulent magnetic field can produce intermittent synchrotron emission consistent with the observations. The thin filament of synchrotron X-rays might be explained if the downstream magnetohydrodynamic turbulence damps exponentially [88], although a critical assessment has been given for the case of RX J1713.73946 [75]. It is worth noticing that in the framework of one-zone leptonic model the IC emission on CMB photons only cannot explain the observed gamma-ray flux which, on the contrary, requires a high level of IR background radiation about 20 times larger than the Galactic average at the position of RXJ 1713.73946 (see Morlino et al. [78] These seemingly contradictory observational facts and competing interpretations have led to much uncertainty in the quest to unravel the true origin of the gamma-ray emission from non-thermal SNRs like RX J1713.73946. This age-old issue awaits a final resolution by the utilization of observatories with higher performance in the near future.
Alternatively, there are possibilities that a hadronic model for the gamma-ray emission of RX J1713.73946 remains viable despite its hard spectrum. For example, in extreme cases, NLDSA models can produce a proton index of 1.5 [107], resulting in a hard slope of the hadronic gamma rays consistent with the Fermi observation. Another plausible scenario can be pictured by considering the effect of shock-cloud interaction which is strongly suggested by recent results of CO and Hi observations towards RX J1713.73946 [47]. The higher is the energy of the CR protons, the deeper they can penetrate into the central (i.e., high-density) part of the dense cloud cores inside a highly inhomogeneous gas environment. Depending on the total mass fraction and the energy dependence of the CR penetration depth in such dense cores in a clumpy medium interacting with the shock, an overall hard gamma-ray spectrum consistent with the Fermi/LAT and H.E.S.S. data can be realized [109, 57, 53]. On the other hand, it has been argued that since a hadronic model requires a high ambient gas density in order for the gamma-ray emission to be dominated by the -decay component, bright thermal X-ray emission should be expected from the shocked gas which is nevertheless not detected so far [39, e.g.,]. In a shock-cloud interaction scenario, however, it is quite possible that the dense clumps of gas swept up by the blastwave can remain “intact” and stay at a low average ionization state and temperature. If these dense clumps bear a significant mass fraction behind the shock, faint thermal X-rays can be naturally explained [57].
Furthermore, a strong magnetic field (–1 mG) can be automatically generated by the turbulent dynamo downstream of the shock that is interacting with a clumpy medium, even without considering the amplification of turbulent magnetic field driven by the streaming CR protons in the shock precursor. A potential difficulty one can face is that, if and the gamma-ray emission is mostly hadronic, to explain the measured flux of radio synchrotron emitted by electrons, the primary electron-to-proton ratio at the SNR should be anomalously small, i.e., [99, 31]. This is far below the observed value at Earth and the typical estimated values in the nearby galaxies [61]. This might be resolved if the electrons are accelerated in the later stages of SNR evolution relative to the protons so that can be different from the present value [97], although this is still highly speculative and further discussions are necessary.
Another possibility that may offer an explanation to the gamma-ray spectrum is that the gamma rays are contributed by a roughly comparable mixture of leptonic and hadronic components. However, this scenario seems unlikely because of the apparently energy-independent gamma-ray morphology [16]. The smooth, single-peak spectral shape without any features would require fine-tuning of model parameters describing the two populations. We should also note that the accurate determination of the mix of leptonic and hadronic components is made difficult by the H.E.S.S. point spread function (PSF).
Our best hope to make progress on our understanding of this very important CR accelerator relies upon better data from powerful future telescopes. The Cherenkov Telescope Array (CTA) is a next-generation observatory of imaging air Cherenkov telescopes (IACTs), which consists of an array of large, medium, and small-sized IACTs distributed over a km2 area [13, 9]. The CTA will achieve better angular resolution and higher sensitivity in a wider energy range than the current IACT generation (see the following section). It is expected that we can obtain the most stringent constraints on theoretical models through their comparison with CTA data on RX J1713.73946 and multi-wavelength observations of this intriguing object.
In this paper, we study prospects for CTA observations of RX J1713.73946. In section 2, we summarize the scientific objectives related to the capabilities of CTA . In section 3, we describe in depth our simulation models and the results. Discussions and summary can be found in section 4.
II Linking CTA capabilities with key scientific goals
The identification of the emission mechanism of gamma rays from non-thermal SNRs like RX J1713.73946 is of utmost importance for advancing cosmic-ray physics. We will evaluate the capabilities of CTA on serving this purpose as follows. First we perform morphological studies in order to assess the possibility of using spatial information to pin down the major component of the VHE gamma-ray emission from leptonic and hadronic origins. In the case where the leptonic component is dominant, we can proceed to check the capability of CTA to search for a possible ‘additional’ hadronic component using spectral analyses. We will also evaluate the prospect of detecting a time variation of the spectral cutoff energy over a relatively long time scale, which we believe is a very useful and unique approach for identifying the VHE emission mechanism.
- •
Imaging with good spatial resolution
CTA is designed to reach angular resolutions of arcminute scale at TeV energies, which is at least a factor of three better than H.E.S.S. [13]. This improvement is critical in our present study because the resolution of CTA will catch up with that of current CO and Hi gas observations in the radio waveband and also get closer to that of X-ray images such as those obtained by XMM-Newton. Synchrotron X-rays are enhanced around the CO and Hi clumps on a length scale of a few pc,22 2 deg at a distance of 1 kpc. but are relatively faint inside the clumps on a sub-pc scale. In other words, the peaks in X-ray brightness are offset from those of the CO/Hi gas distribution [93]. Indeed, there exist many gas clumps whose associated X-ray peaks are located more than 0.05 deg away from their centers. If the gamma rays are leptonic in origin and if the energy spectrum of the CR protons are spatially uniform, we expect that the gamma rays possess brightness peaks coincident with the CO/Hi gas clumps and show similar spatial offsets to the X-rays. - •
Broadband gamma-ray spectrum
CTA will cover photon energies from 20 GeV to 100 TeV with a sensitivity about 10 times better than H.E.S.S. [13]. The spectrum of RX J1713.73946 measured by H.E.S.S. is well described by a single smooth component. However, it is possible that there exists another dimmer, and harder, component at the high-energy end of the spectrum that H.E.S.S. cannot discern due to its insufficient effective area. More specifically, if the gamma-ray spectrum is described by an inverse-Compton component with a primary electron index , which has been inferred from the Fermi/LAT observation [2], there can exist an accompanying hadronic component from the CR protons with the same spectral index. This hadronic component should appear flat in space, and its expected flux is(1) where we have assumed the distance to RX J1713.73946 to be 1 kpc. The quantities and are the total CR proton energy in the emission sites and the average target gas density, respectively. By adopting the values ergs and cm-3 as in Equation (1), this flux is about 10 % of the presently observed spectral peak at a photon energy of ; such a hard component can dominate at the high-energy end of the gamma-ray spectrum and will be discernible as a spectral hardening feature by CTA.
Note that a dim hadronic component can be dominant at the highest gamma-ray energies only if the maximum energy of the parent CR proton spectrum is not lower than TeV, and that such a high value of is not guaranteed. In particular, if we assume the simplest one-zone model with the diffusive shock acceleration around the shock of RX J1713.73946 as well as an inverse Compton origin for the gamma rays, then the maximum electron energy, TeV, is not limited by energy loss but by the SNR age or CR escape to far upstream because of the weak average magnetic field strength of G required for a leptonic scenario, so that the maximum proton energy is basically similar to that of electrons. However, the emergence of a dim hadronic emission component with a maximum energy of more than 50 TeV is still possible if we consider a multi-zone model. Multi-zone models may be motivated by the observational results referred in section 1.2, which seem to be inconsistent with each other 33 3 For instance, if the gamma-ray emission is leptonic, the magnetic field is weaker than those suggested by rapid variability and thin filaments of synchrotron X-rays (if their origins are associated to fast electron cooling near the cutoff which may or may not be the case). Another example is that the number density of the local gas should be small to explain the non-detection of thermal X-ray lines. This situation may be unlikely if we take into account the fact that this SNR is apparently interacting with dense molecular clouds, although it depends much on the timing of the shock-cloud interaction.. For example, a small amount of protons, which were accelerated when the SNR was younger and the magnetic field was stronger, could have escaped the acceleration region and are hitting the surrounding molecular clouds now to produce dim hadronic gamma-ray emission, while most of the gamma rays are produced by either electrons or protons which are currently being accelerated. Assuming a Bohm-like diffusion in magnetic turbulence with an average strength of mG, the propagation length of PeV protons within yr is estimated to be pc, so that a non-negligible fraction of such high-energy protons can exist inside and around the SNR to interact with dense targets. Spatially-resolved spectroscopy with the better angular resolution of CTA will help us investigate such ‘multi-zone’ structures. Another possible scenario is the following. Both protons and electrons are currently being accelerated, but protons are accelerated in regions with stronger magnetic fields, while electrons are accelerated in regions with weaker magnetic fields. In the strong magnetic field regions, electrons are less efficiently accelerated, because the Alfven Mach number is small due to the strong upstream magnetic field, resulting in a small injection rate of electrons [56]. Generally speaking, if a young SNR is producing CRs up to the knee energy, we naturally expect a dim hadronic component with gamma-ray energy more than 100 TeV unless the hadrons have escaped into the ISM during an earlier phase. Note that this statement is independent from the detailed acceleration mechanism. Therefore, if such dim and hard hadronic component will be detected, it will provide evidence for proton acceleration up to the knee energy.
- •
Time variation of maximum CR energies
The CTA observatory will last for more than ten years. This motivates us to measure any possible time variation of the gamma-ray spectrum over long time-scales. It has been shown that the maximum energy of CRs confined in SNRs depends on the SNR age during the Sedov phase [90, 86, e.g.]. Since the downstream magnetic field strength around the shock decays with the shock velocity, as the SNR ages it becomes harder to confine high energy CRs through pitch-angle scatterings near the shock. Accordingly, the maximum energy of CR protons should also decrease with time44 4 In the Sedov phase, the maximum energy of CR protons should no longer be constrained by the acceleration time-scale but rather by the CR escape process.. The overall normalization of the gamma-ray spectrum may also change with time although its behavior is highly uncertain. Assuming that the energy in cosmic-ray protons is proportional to the integration of the kinetic energy flux of upstream matter passing through the shock front, Dwarkadas [37] derived a simple scaling of hadronic gamma-ray luminosity which can be written as , where the SNR radius evolves as and the surrounding medium has a power-law profile in density . Then, for a uniform surrounding medium (), we obtain for (free expansion), and for (adiabatic expansion). In the case of (an isotropic wind), we find for (free expansion), and for (adiabatic expansion). Another model predicts a secular flux increase at a few hundred GeV at a level around 15% over 10 years [41]In the following, we consider the simplest case in which only the cutoff energy of the gamma-ray spectrum changes with time. The cutoff energy may vary % in 10–20 years. To demonstrate this, we consider a power-law behavior for the time evolution of the escape-limited maximum energy, i.e., . The value of is important for understanding the average source spectrum of Galactic CRs which should be steeper than [83]. Although there are theoretical studies on [90, 108, e.g.,], its precise value has not yet been determined observationally nor theoretically. To reproduce the spectrum of Galactic CRs, we can phenomenologically assume that eV at the beginning of the Sedov phase (), and that at the end of the Sedov phase (), from which we can obtain [83]. The age of RX J1713.73946 is around (section 1.2). Then, the expected evolution rate of the maximum energy at this age is estimated as . This implies a decay of the maximum energy of about over a period of . If the observed gamma rays are produced by CR protons, the cutoff energy of the gamma rays is proportional to . On the other hand, the leptonic gamma-ray scenario predicts the cutoff energy to be proportional to . Therefore, the time variation of the cutoff energy of gamma rays over yrs is expected to be about and for CR protons and electrons, respectively. These estimations are based on the assumption of a smooth transition of or with a power-law scaling. However, RX J1713.73946 is thought to be currently interacting with dense regions. If so, a collision between the SNR shock and density bumps causes a sudden deceleration of the shock, which results in a variability of and/or on shorter timescales.
For the CR electrons, if their maximum energy, , is also limited by their escape from the SNR, its time evolution should be the same as that of the CR protons. On the other hand, if it is limited by synchrotron cooling, its evolution should differ from that of the CR protons. A cooling-limited near the shock can either decrease or increase with time depending on the evolution of the amplified magnetic field [86], for which shock-cloud interactions can play a significant role.
III Simulations
In this section, we evaluate the feasibility of achieving the scientific objectives discussed above using a series of observation simulations for CTA. The simulation software package ctools 55 5 version 00-07-01. See also http://ascl.net/1601.005 (ascl.1601.005) [63, 64] that we use in this study is developed as an open source project aiming at a versatile analysis tool for the broader gamma-ray astronomy community, and is very similar to the Science Tools66 6 http://fermi.gsfc.nasa.gov/ssc/data/analysis/software/ developed for the Fermi/LAT data analysis. ctobssim is an observation simulator which generates event files containing the reconstructed incident photon direction in sky coordinates, reconstructed energy, and arrival time for each VHE photon detected in the field-of-view. Simulated VHE sky images are produced by ctskymap using the simulated event files. Event selection based on these parameters can be applied by ctselect and event binning is performed by ctbin. Unbinned or binned likelihood model fitting is executed through ctlike.
III.1 Input data
III.1.1 Instrumental information and backgrounds
To conduct CTA simulations and analyses, we used a set of instrument response functions (IRFs) equivalent to those for the public ”2Q” array configuration available at the CTA website77 7 https://portal.cta-observatory.org/Pages/CTA-Performance.aspx. (version 2015-05-05). 50-hr point source observations at a zenith angle of 20∘ are assumed to generate the IRFs. We assumed here observations pointing towards the centre of the remnant.
We modeled the spatial distribution of the isotropic background, which originates from gamma-like charged cosmic-ray events, as a two-dimensional Gaussian in the field-of-view (due to the radial dependence of acceptance) with a standard deviation of 3∘ throughout these studies. Since RX J1713.73946 is located on the Galactic Plane, we also took into account the Galactic diffuse background (GDBG). We conservatively assumed that the GDBG has a power-law spectrum without a cutoff and estimated it by extrapolating the GDBD model gll_iem_v05_rev1.fit88 8 available at http://fermi.gsfc.nasa.gov/ssc/data/access/lat/BackgroundModels.html provided by the Fermi/LAT team [8]. Using only 6 data points above 0.1 TeV in the Fermi/LAT data up to GeV, we derived a net GDBG flux within 1 degree around RX J1713.73946 of ph cm-2s-1TeV-1, which is also roughly consistent with previous TeV observations [4]. With these assumptions, the GDBG exceeds the isotropic cosmic-ray background above a few TeV.
III.1.2 Gamma rays from RX J1713.73946
Here we assume that the gamma-ray spectrum is dominated by a leptonic component. As discussed in the previous section, an additional hadronic component should exist. By combining these two components, we made templates for our gamma-ray simulations as follows.
- 1.
Leptonic component
We used the X-ray image of RX J1713.73946 as a template that traces the leptonic gamma-ray morphology. The X-ray image is extracted from the XMM-Newton archival data consisting of multiple pointing observations to cover the entirety of this remnant. The energy band of this image is restricted to 0.5–8.0 keV. The Non X-ray background is subtracted, and vignetting and exposure corrections are applied. The pixel scale is 5′′ and the image is smoothed with a Gaussian function with a of 3 pixels. Apparent point sources, likely foreground stars or background extragalactic objects, as well as the central compact object (CCO) known as the neutron star candidate 1WGA J1713.43949 [67], the brightest point source in this field, are excluded.
We consider a simplified case where the gamma-ray spectral shape is spatially invariant over the two-dimensional image. The spectrum we adopt is based on the fitting results from H.E.S.S. data and can be written as
(2) where is a normalization constant, is the photon index () and is the cutoff energy (17.9 TeV) [17, see Table 4 of].
- 2.
Hadronic component
Based on CO and Hi observations, we obtain the total target gas column density (atomic molecular) [47] and use it as a template that is assumed to trace the hadronic gamma-ray morphology. The spatial boundary of the total target gas is defined using the apparent edge of the VHE gamma-ray emission shown in Aharonian et al. (2007). Additionally, we assumed that the spatial distribution of CR protons is homogeneous within the shell of the SNR. Again, the gamma-ray spectral shape is assumed to be spatially invariant. In this case the spectrum is written in a parametric form, i.e.,(3) where , , and are the normalization constant, photon index, and cutoff energy, respectively.
We adopt and TeV as our fiducial parameters to picture a possible PeVatron accelerator. In the following, we consider several cases with different values of . The absolute values of and are determined by requiring that the integration of the sum is equal to the total photon flux between 1 and 10 TeV measured by H.E.S.S..
We generated gamma rays with energies between 0.3 and 100 TeV, which is narrower than the designed energy range of CTA in full-array configurations. Since the spectral shape is concave below a few hundred of GeV [2], we restricted the simulation and analysis to above 0.3 TeV for simplicity. On the other hand, setting a high enough upper energy bound is extremely important with the aforementioned scientific goals in mind. Unfortunately, however, the IRF currently available supports simulations only up to TeV, so that we simply cut our event generations at 100 TeV in this pilot simulation study. In the near future the IRF will be updated and the energy coverage will be extended to 300 TeV and beyond. Working with such IRF and more detailed emission models are reserved for future work.
III.2 Results and analysis
III.2.1 Gamma-ray image
We first look at the simulated images for CTA and study the possibility of using morphological information to determine the major component of the VHE gamma-ray emission. Different gamma-ray images in the energy range of 1–100 TeV are generated by changing , the ratio between the hadronic and leptonic contributions. Figures 1a and 1b show the images for (lepton dominated; e.g., Abdo et al. [2]) and 100 (hadron dominated; e.g., Fukui et al. [47]), respectively. Each image corresponds to 50 hr of observations with CTA. As per our assumptions described above for the underlying templates, the lepton-dominated model (Figure 1a) shows a gamma-ray image that resembles the X-rays, and the hadron-dominated case (Figure 1b) delineates the ISM proton distribution including both CO and Hi. The difference between them (Figure 1c) is significant as is evident from the subtraction between the two images.
To perform a quantitative evaluation, we employ the method of likelihood fitting (e.g., Matox et al. [76], Cowan [34], Feigelson & Babu [42]). We focus here on the ability of CTA to determine the dominant emission component from the prospectively observed morphology. We calculated the maximum log-likelihood, and , by fitting the simulated images with the leptonic and hadronic spatial template, respectively. We note that the templates used during the fits are the same as those used in the simulations, meaning that a rather idealistic case is assumed. To determine the log-likelihoods and individually, we employ either the hadronic or leptonic template at a time in each fitting model (regardless of the intrinsic ratio in the simulation data being fitted). We keep the normalization, photon index, and cutoff energy of the power-law as free parameters during the fitting process. We also fit the data with the composite model containing both the leptonic and hadronic components in order to obtain the log-likelihood . Then we calculated the differences and for various , as summarized in Table 1. These differences in log-likelihood are large when the composite model is a significant improvement over the leptonic or hadronic models, and the difference is intended to be distributed approximately as a variable with 3 degrees of freedom (for the extra parameters in the composite model). However this is only a rough indication as the conditions of Wilks’ theorem are violated because the simple model is on the physical boundary of allowed parameters of the composite model [106]. Table 1 indicates that the composite model is strongly favored over the simple models and that we can easily find the dominant component when the contribution of the second component is small. For example, when , is very different from but nearly the same as . On the other hand, in the case where there is a more-or-less equal contribution from both particle populations (i.e., ), we found that the fitting tends to be biased toward the hadronic component. When in our model, the total number of hadronic photons is larger than that of the leptonic photons due to the differences in , especially at higher energies. Since the angular resolution becomes better at such higher energy range, the likelihood result expectedly favors a hadron-dominated scenario. Nevertheless, we note that the case of (hadron-dominated) shows a more spread-out structure in gamma rays than that of (lepton-dominated). This trend is consistent with the latest H.E.S.S. results Abdalla et al. [1]. We conclude that CTA observations will be able to distinguish between hadronic and leptonic gamma rays based on morphological characterizations.

| aa and are normalization constants for the leptonic and hadronic component, respectively. The details are described in the text. | bb, and are the maximum log-likelihoods for the leptonic, hadronic and composite templates, respectively | bb, and are the maximum log-likelihoods for the leptonic, hadronic and composite templates, respectively |
|---|---|---|
| 0.01 | ||
| 0.1 | ||
| 1.0 | ||
| 10.0 | ||
| 100 |
III.2.2 Spectrum
In the case where the leptonic component is dominant, we can subsequently attempt to search for the “hidden” hard component with a hadronic origin as discussed above. In order to evaluate the capability of CTA to achieve this interesting task, we further perform likelihood analyses over the wider energy band of TeV using 50 hr of simulation data with various assumed ratios. The spatial templates and the spectral shapes in the fitting models are the same as those used originally for the simulation. The fitting results are summarized in Table 2. We can significantly detect the hadronic component even for a small . However, the best-fit spectral shape for the hadronic component is generally slightly harder than the true input value of 2.0 for the cases with smaller ratios. This is probably because the dimmer and widely extended hadronic component is more easily confused with the background photons, especially at lower energies. Indeed, when we simulated and analyzed without the GDBG nor the cosmic-ray background, the best-fit photon indices were converged consistent with the input value of . We thus refrain from drawing any strong conclusion on the detectability of the ratio at this point.
| aa and are normalization constants for the leptonic and hadronic component, respectively. The details are described in the text. | bb and are the maximum log-likelihoods for the model with/without the hadronic component, respectively. | cc is a photon index for the gamma-ray spectrum of the leptonic component. | dd is a cutoff energy for the gamma-ray spectrum of the leptonic component. | ee is a photon index for the gamma-ray spectrum of the hadronic component. |
|---|---|---|---|---|
| 0.01 | 9.2 | |||
| 0.02 | 41.9 | |||
| 0.06 | 346.5 | |||
| 0.10 | 998.0 |
We proceed to perform maximum likelihood fits for the simulation data (with a ratio ) for 18 logarithmically spaced energy bands spanning from 0.3 TeV to 100 TeV. Unlike our analysis above where we have to specify spectral shapes for the hadronic and leptonic components, in this way we can measure the spectrum independently of any spectral model assumption. Figure 2 shows the resulting spectrum from our “bin-by-bin” analysis of the same 50 hr simulation data. For each spatial template, it is clear that our likelihood fits satisfactorily reproduce the simulated spectrum above 0.3 TeV. The data in each energy bin were fit by power-laws with a fixed index of 2.0. As a final check, we compared the total gamma-ray flux points from the likelihood fit over the 18 energy bins with our simulation model in which the emission is purely leptonic (see Figure 3). Although it depends on the energy binning, in the case of and 50 hr of observation, we can obtain the flux points above 30 TeV deviating from the purely leptonic model with a statistical significance level of 3. Thus, we reach the conclusion that 50 hrs CTA observation could detect at above the hard hadronic component with a ratio , under the idealistic conditions assumed here.


III.2.3 Time variation of cutoff energy
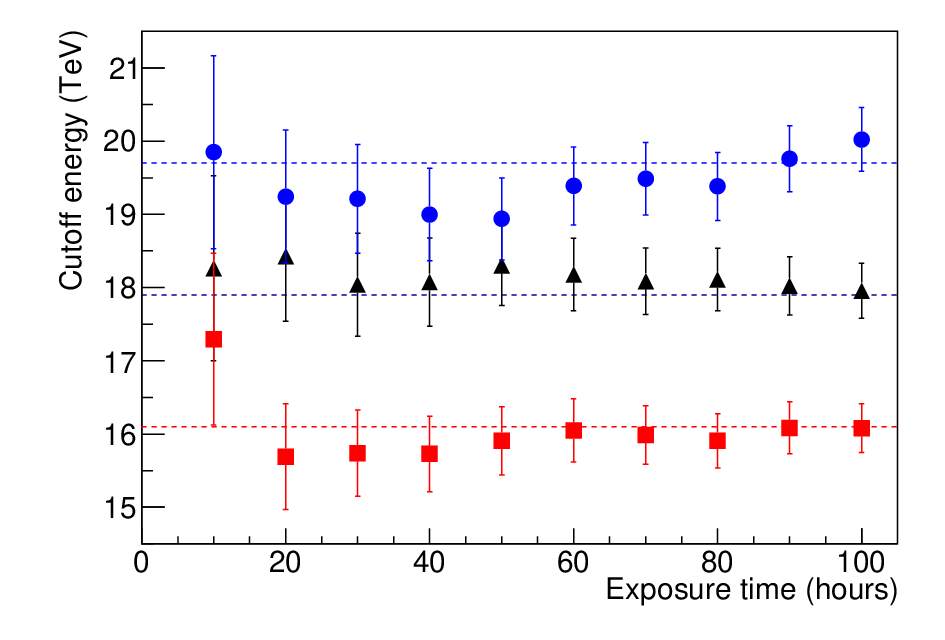
Detecting the time variation of the cutoff energy of the gamma-ray spectrum provides a clue to distinguish between different emission scenarios and CR acceleration theories. We start off with the generation of simulated photons for a 100-hr observation of RX J1713.73946. The simulations are performed for three sets of intrinsic cutoff energies at 17.9, 19.7 and 16.1 TeV each. The first set with TeV is tagged as our nominal case based on the current best-fit value suggested by H.E.S.S. data. The other two cases represent the possibility of a varying in the coming years within the CTA mission lifetime. As a start, we consider a variation of to obtain an initial impression on how sensitive CTA will be to such fractional changes in the spectral cutoff. Roughly yrs could be expected for % variation as discussed in Section 2. Here we consider the purely leptonic scenario as an example (see Section 3.1 for details).
For each case, we explore how the detectability depends on the total exposure time by extracting subsets from the full dataset with different exposures shorter than 100 hrs. This is achieved by applying a time-based cut using ctselect. We then perform unbinned likelihood fitting for each of these subsets to derive the corresponding best-fit cutoff energies. In the fitting, the normalization, photon index and are all free parameters and are fitted simultaneously. Figure 4 shows the best-fit and their associated errors from our likelihood analyses. As expected, the fitted are closer to their true values with smaller uncertainties for longer exposures in all cases.
We then proceed to define a significance, , for any observed variation as
| (4) |
where and are the best fit for the cases with the nominal value and variation, respectively. and are the corresponding errors. To suppress statistical fluctuations, we repeat all of our simulations for 100 times and take the average of the calculated from all runs. In Figure 5 (Top left), our result indicates that a decrease in with time is slightly easier to identify than an increase, which can be understood as follows. In the energy range of ( TeV), the sensitivity of CTA begins to drop with energy. As a result, a lower cutoff energy can actually be measured more easily and precisely for a given exposure. Our result is hence consistent with expectations. We perform a simple fit to the points by a function , where is the exposure. If we observe hrs in the two epochs, we are able to achieve a detection for the case, whereas hrs are necessary for the case.
We can also estimate from another point-of-view by considering the following observation scenario. Suppose we will observe RX J1713.73946 with different exposures during the first and the second epochs, how does the detection significance of a variation in depend on the observation time in each epoch? In this case, we can calculate
| (5) |
where and are the exposure time for the first and second epoch, respectively. Our result is presented in Figure 5 (top right and bottom left panels). Here we again arrive at the conclusion that an increase of is harder to detect. A longer exposure in the first year apparently makes it easier for us to detect the variation with a shorter observation in the next epoch. Although several combinations of observation time are available for the 3 detection, 50-hr is the minimum required for the first observation period.
Since the full operation of CTA will begin roughly 10 years after the H.E.S.S. observations, it is also of interest to know whether it is possible to detect any variation of by comparing previous H.E.S.S. results and the upcoming CTA observations. In this context, we can calculate again by Equation (4) fixing TeV and TeV [17] and repeat the same procedure described above. The result is plotted in Figure 5 (bottom right panel). Owing to the large uncertainty of the H.E.S.S. results, however, the expected significance remains low and unmeaningful even with long CTA exposures up to 100 hrs. This result consolidates the necessity of performing CTA observations of RX J1713.73946 in at least two epochs separated by a 10-yr time interval.

IV Summary and discussion
In this paper, we have studied the feasibility and prospects for achieving a set of key scientific goals through CTA observations of RX J1713.73946, based on simulations with exposures of 50-hrs or above . We showed that a 50-hr observation is adequate to identify the dominant gamma-ray emission component, namely leptonic or hadronic, from the morphology of the SNR that is going to be revealed by CTA. And we should be able not only to quantify both the leptonic and hadronic components but also to detect a possible hidden hard component at level through spectral analyses if they are mixed with a ratio of . Interestingly, we also found that CTA will be able to reveal fractional variations of the spectral cutoff energy over a timescale of yrs, for the very first time. A variation of is found to be detectable provided that an exposure time longer than 50 hr can be secured for the first epoch. The result may indicate that the detection would be a tough task, but at the same time the achievable science convinces us that it is worth the challenge.
The uncertainties of our results presented above are purely statistical. The energy dispersion and uncertainty in the measured energy scale can affect the fidelity of the spectral analyses especially in the measurement of . We confirmed that the significance of the variations due to the predicted energy dispersion would be negligible, while the expected energy scale uncertainty would cause deviations, respectively. We also confirmed that the contamination of the very faint thermal X-ray to the leptonic template and variations of the hadronic template due to the uncertainty of the radio observations are both negligible to the results. Katsuda et al. [59] reported the detection of very faint thermal components but their spectral analysis region is limited only in the very center of this SNR with the radius of . They also presented the softness map and the analysis is performed on one of the softest region where the thermal component is brighter than other area. Even such region, the flux of the thermal emission is far less than 10% of the synchrotron. Concerning the radio map, the uncertainty of the intensity is estimated as less than 10%. When we modified the hadronic image template by multiplying a random factor conservatively between % to every image pixel, the results are very similar and differences are typically less than . Estimating other systematic uncertainties for our analysis is not trivial and can be highly model-dependent. Possible effects due to a deviation from the actual PSF profile with a tail99 9 as presented and discussed in Aleksić et al. [21] for the case of MAGIC telescopes. may exist, since the PSF was assumed simply as a Gaussian in our simulations. Since RX J1713.73946 is located at the Galactic Plane, the source is expected to be contaminated by the Galactic diffuse gamma-ray emission which constitutes the majority of the background events (i.e., “noise” for our purpose). Possible existence of currently unknown TeV sources nearby, such as the CCO 1WGA J1713.43939 for instance, can contribute to the systematic errors in such a crowded region on the Galactic Plane.
On the other hand, CTA will measure gamma rays with energies far below 0.3 TeV, where the Fermi/LAT and H.E.S.S. data points connect. If the gamma rays are mostly of a leptonic origin and the magnetic field strength is around 10 or a few tens of G, which has been inferred from theoretical studies [107, 38, 68, e.g.,], we expect that the electron spectrum possesses a cooling break [71] at TeV , where is the age of RX J1713.73946. In this case the gamma-ray spectrum must also exhibit a corresponding break at TeV (since for inverse-Compton emission in the Thompson regime), if the particle injection is impulsive. Future identification of such a cooling break feature in the gamma-ray spectrum by CTA will equip us with a powerful and independent tool to measure the value of , which would bring important constraints on the particle acceleration mechanism at high Mach-number collisionless shocks.
Our present study is based on a fairly simplified input model, but can be extended to include more physics motivated by theoretical models. Some possibilities are listed in the following, and their incorporation in our model is reserved for future works.
(1) Hadronic model based on MHD simulations: The shock interaction with dense clouds excites turbulence, which amplifies the magnetic field up to the mG order [57, 93, 94]. These results may be crucial for our better understanding of the gamma ray and X-ray images of SNRs. Under these circumstances, the CR electrons will be significantly affected via synchrotron cooling for magnetic fields greater than 100 G, and the gamma ray image will follow if the leptonic gamma-ray production is important. In order to fully understand such effects on the gamma-ray images, we need to incorporate the shock-cloud interaction by utilizing the ISM distribution with a reasonably high angular resolution as well as detailed numerical simulations. Using the full performance of CTA by lowering the energy threshold could be essential in these studies, since more apparent differences between the leptonic and hadronic scenarios are expected. (2) Highest energy CRs from SNRs: Accelerated particles eventually escape from the SNR forward shock to become Galactic CRs. According to recent studies, the highest energy CRs start to escape from the SNR at the beginning of the Sedov phase [91, 83, 85]. The escaped CRs make a gamma-ray halo, which is more extended than the SNR shell [52, 49, 84]. Spectral measurements of gamma-ray halos will provide information on the highest energy CRs accelerated in the SNR in the past. Observed profiles of the gamma-ray halo will also constrain the diffusion coefficient of CRs and density structure in the ambient medium [50, 74]. (3) Hydrodynamical models and spectral modifications via nonlinear effects: More sophisticated models taking into account nonlinear DSA processes predict realistic CR proton electron spectra [109, 68, e.g.], both trapped and escaped, with a full treatment of their time evolution and spatial distribution in a hydrodynamic calculation for RX J1713.73946. The comparison of these models with CTA results will provide important new insights on the very complex nonlinear DSA mechanism at young SNRs.
References
- [1] Abdalla, H., et al. (H.E.S.S. collaboration), 2016, A&A, in press (arXiv:1609.08671)
- [2] Abdo, A. A. et al., 2011, ApJ, 734, 28
- [3] Abramowski, A. et al. 2011, A&A, 531, A81
- [4] Abramowski, A. et al., 2014, Phys. Rev. D, 90, 122007
- [5] Acciari V. A. et al., 2011, ApJ, 730, L20
- [6] Acero, F., Ballet, J., Decourchelle, A., et al. 2009, A&A, 505, 157
- [7] Acero, F. et al. 2010, A&A, 516, A62
- [8] Acero, F., et al. 2016, ApJS, in press. [arXiv:1602.07246]
- [9] Acharya, B. S. et al. 2013, Astropart. Phys., 43, 3
- [10] Ackermann, M. et al. 2012, ApJ, 750, 3
- [11] Ackermann, M. et al. 2013, Science, 339, 807
- [12] Ackermann, M. et al. 2016, ApJS, 222, 5
- [13] Actis, M. et al. 2011, Experimental Astronomy, 32, 193
- [14] Aharonian, F. et al., 2004, Nature, 432, 75
- [15] Aharonian, F. et al., 2005, A&A, 437, L7
- [16] Aharonian, F. et al., 2006, A&A, 449, 223
- [17] Aharonian, F. et al., 2007a, A&A, 464, 235
- [18] Aharonian, F. et al., 2007b, ApJ, 661, 236
- [19] Aharonian, F. et al., 2009, ApJ, 692, 1500
- [20] Albert, J. et al. 2007, A&A, 474, 937
- [21] Aleksić, J., et al. 2016, Astropart. Phys., 72, 76
- [22] Amato, E., 2014, International Journal of Modern Physics D, 23, 1430013
- [23] Bamba, A. et al. 2003, ApJ, 589, 827
- [24] Bamba, A. et al. 2005a, ApJ, 621, 793
- [25] Bamba, A. et al. 2005b, ApJ, 632, 294
- [26] Bamba, A., Pühlhofer, G., Acero, F., et al. 2012, ApJ, 756, 149
- [27] Berezhko, E. G. & Ellison, D. C. 1999, ApJ, 526, 385
- [28] Blandford, R.D., & Eichler, D. 1987, Phys. Rep., 154,1
- [29] Blasi, P., Morlino, G., Bandiera, R., Amato, E., & Caprioli, D., 2012, ApJ, 755, 121
- [30] Blasi, P., 2012, A&A Review, 21, 70
- [31] Butt, Y. 2008, MNRAS, 386, L20
- [32] Bykov, A. M. 2008, ApJ, 689, 133
- [33] Caprioli, D. et al. 2009, MNRAS, 395, 895
- [34] Cowan, G., 1998, Statistical Data Analysis, Oxford Science Publications
- [35] Drury, L.O.’C. 1983, Rep. Prog. Phys, 46, 973
- [36] Drury, L.O.’C., 2012, Astropart. Phys., 39, 52
- [37] Dwarkadas, V. V. 2013, MNRAS, 434, 3368
- [38] Ellison, D. C. et al. 2010, ApJ, 712, 287
- [39] Ellison, D. C. et al. 2012, ApJ, 744, 39
- [40] Enomoto, R. et al. 2002, Nature, 416, 823
- [41] Federici, S., Pohl, M., Telezhinsky, I., Wilhelm, A., Dwarkadas, V. V. 2015, A&A, 577, A12
- [42] Feigelson, E. D. and Babu, G. J., 2012, Modern Statistical Methods for Astronomy, Cambridge University Press
- [43] Ferrand, G., et al., 2014a, ApJ, 792, 133
- [44] Ferrand, G., Decourchelle, A., & Safi-Harb, S., 2014b, ApJ, 789, 49
- [45] Ferrand, G., & Safi-Harb, S., 2012, Adv. Sp. Res., 49, 1313
- [46] Fukui, Y. et al. 2003, PASJ, 55, L61
- [47] Fukui, Y. et al. 2012, ApJ, 746, 82
- [48] Fukui, Y. 2013, Cosmic Rays in Star-Forming Environments, 34, 249
- [49] Fujita, Y., Ohira, Y., & Takahara, F., 2010, ApJL, 712, L153
- [50] Fujita, Y. et al., 2011, MNRAS, 415, 3434
- [51] Gabici, S., & Aharonian, F. A., 2007, ApJ, 665, 131
- [52] Gabici, S., Aharonian, F. A., & Casanova, S., 2009, MNRAS, 396, 1629
- [53] Gabici, S. & Aharonian, F. A., 2014, arXiv:1406.2322
- [54] Giuliani, A., Cardillo, M., Tavani, M., et al. 2011, ApJ, 742, L30
- [55] Helder, E. A. et al. 2009, Science, 325, 719
- [56] Hoshino, M. & Shimada, N. 2002, ApJ, 572, 880
- [57] Inoue, T., Yamazaki, R., Inutsuka, S.-i., & Fukui, Y. 2012, ApJ, 744, 71
- [58] Kang, H. et al. 2001, ApJ, 550, 737
- [59] Katsuda, S., et al. 2015, ApJ, 814, 29
- [60] Katagiri, H. et al. 2005, ApJ, 619, L163
- [61] Katz, B. & Waxman, E. 2008, JCAP, 01, 018
- [62] Kishishita, T. et al. 2013, A&A, 551, 132
- [63] Knödolseder, J. et al. 2013, in Proc of 33th ICRC (arXiv:1307.2232)
- [64] Knödolseder, J. et al. 2016, A&A, in press
- [65] Koyama, K. et al. 1995, Nature, 378, 255
- [66] Koyama, K., Kinugasa, K., Matsuzaki, K., et al. 1997, PASJ, 49, L7
- [67] Lazendic, J. S. et al. 2003, ApJ, 593, L27
- [68] Lee, S.-H. et al. 2012, ApJ, 750, 156
- [69] Lee, S.-H. et al. 2013, ApJ, 767, 20
- [70] Lee, S.-H. et al. 2015, ApJ, 806, 71
- [71] Longair, M. S. 1994, High Energy Astrophysics, 2, Stars, the Galaxy and the interstellar medium (Cambridge: Cambridge University Press)
- [72] Malkov, M. A. 1997, ApJ, 485, 638
- [73] Malkov, E., & Drury, L.O’C. 2001, Rep. Prog. Phys., 64, 429
- [74] Malkov, M. A. et al., 2013, ApJ, 768, 73
- [75] Marcowith, A. & Casse, F. 2010, A&A, 515, A90
- [76] Mattox, J. R., et al., 1996, ApJ, 461, 396
- [77] Maxted, N. I., et al., 2012, MNRAS, 422, 2230
- [78] Morlino, G., Amato, E., & Blasi, P., 2009, MNRAS, 392, 240
- [79] Morlino, G., Blasi, P., Bandiera, R., Amato, E., Caprioli, D., 2013, ApJ, 768, 148
- [80] Moriguchi, Y. et al. 2005, ApJ, 631, 947
- [81] Muraishi, H., et al. 2000, A&A, 354, L57
- [82] Ohira, Y., Terasawa, T., & Takahara, F., 2009, ApJL, 703, L59
- [83] Ohira, Y., Murase, K., & Yamazaki, R., 2010, A&A, 513, A17
- [84] Ohira, Y., Murase, K., & Yamazaki, R., 2011, MNRAS, 410, 1577
- [85] Ohira, Y., 2012, ApJ, 758, 97
- [86] Ohira, Y., Yamazaki, R., Kawanaka, N., & Ioka, K., 2012, MNRAS, 427, 91
- [87] Parizot, E. et al. 2006, A&A, 453, 387
- [88] Pohl, M. et al. 2005, ApJ, 626, L101
- [89] Protassov, R. et al. 2002, ApJ, 571, 545
- [90] Ptuskin, V. S. & Zirakashvili, V. N., 2003, ApJ, 403, 1
- [91] Ptuskin,V. S. & Zirakashvili, V. N., 2005, A&A, 429, 755
- [92] Sano, H., Sato, J., Horachi, H., et al. 2010, ApJ, 724, 59
- [93] Sano, H. et al. 2013, ApJ, 778, 59
- [94] Sano, H., Fukuda, T., Yoshiike, S., et al. 2015, ApJ, 799, 175
- [95] Slane, P., et al., 1999, ApJ, 525, 357
- [96] Takahashi, T. et al. 2014, Proc. of SPIE, 9144, id.914425
- [97] Tanaka, T. et al. 2008, ApJ, 685, 988
- [98] Tsunemi, H., Miyata, E., Aschenbach, B., Hiraga, J., & Akutsu, D. 2000, PASJ, 52, 887
- [99] Uchiyama, Y. et al. 2003, A&A, 400, 567
- [100] Uchiyama, Y. et al. 2007, Nature 449, 576
- [101] Uchiyama, Y. et al. 2010, ApJL 723, L122
- [102] Vink, J. & Laming, J. M. 2003, ApJ, 584, 758
- [103] Völk, H. J., Berezhko, E. G., & Ksenofontov, L. T., 2005, A&A, 433, 229
- [104] Wang, Z. R. et al. 1997, A&A, 318, L59
- [105] Warren, J. S. et al. 2005, ApJ, 634, 376
- [106] Wilks, S. S., 1938, Ann. Math. Statist., 9, 60
- [107] Yamazaki, R. et al. 2009, A&A, 495, 9
- [108] Yan, H., Lazarian, A., & Schlickeiser, R., 2012, ApJ, 745, 140
- [109] Zirakashvili, V. N. & Aharonian, F. A., 2010, ApJ, 708, 965