Measurements of jet quenching with semi-inclusive hadron+jet distributions in Au+Au collisions at = 200 GeV
Abstract
The STAR Collaboration reports the measurement of semi-inclusive distributions of charged-particle jets recoiling from a high transverse momentum hadron trigger, in central and peripheral Au+Au collisions at = 200 GeV. Charged jets are reconstructed with the anti- algorithm for jet radii between 0.2 and 0.5 and with low infrared cutoff of track constituents ( ). A novel mixed-event technique is used to correct the large uncorrelated background present in heavy ion collisions. Corrected recoil jet distributions are reported at mid-rapidity, for charged-jet transverse momentum . Comparison is made to similar measurements for Pb+Pb collisions at = 2.76 TeV, to calculations for p+p collisions at = 200 GeV based on the PYTHIA Monte Carlo generator and on a Next-to-Leading Order perturbative QCD approach, and to theoretical calculations incorporating jet quenching. The recoil jet yield is suppressed in central relative to peripheral collisions, with the magnitude of the suppression corresponding to medium-induced charged energy transport out of the jet cone of , for and = 0.5. No medium-induced change in jet shape is observed for . The azimuthal distribution of low- recoil jets may be enhanced at large azimuthal angles to the trigger axis, due to scattering off quasi-particles in the hot QCD medium. Measurement of this distribution gives a 90% statistical confidence upper limit to the yield enhancement at large deflection angles in central Au+Au collisions of of the large-angle yield in p+p collisions predicted by PYTHIA.
pacs
25.75.Bh, 13.87.-a, 12.38.MhI Introduction
The interaction of energetic jets with hot QCD matter provides unique probes of the Quark-Gluon Plasma (QGP) generated in high-energy collisions of heavy nuclei (“jet quenching”, [1] and references therein). Jet quenching was first observed experimentally as the suppression of inclusive hadron production and hadron correlations at high transverse momentum (high ) [2, 3, 4, 5, 6, 7, 8, 9, 10, 11, 12, 13, 14]. Jet quenching is calculable theoretically, using approaches based on perturbative QCD and on strong coupling. Comparison of theoretical calculations with measurements of inclusive hadron suppression at the Relativistic Heavy Ion Collider (RHIC) and Large Hadron Collider (LHC) has been used to constrain the jet transport parameter in the QGP [15].
Measurements based on high- hadrons, which are leading fragments of jets, bias towards jets that have lost relatively little energy in the medium [16]. These are therefore disappearance measurements, in which the contribution of jets that interact most strongly in the medium is suppressed. Such measurements have limited sensitivity to the detailed dynamics of parton shower modification and the response of the medium to the passage of the jet. Comprehensive exploration of jet quenching therefore requires measurements of reconstructed jets and their correlations. Jet measurements in the high-multiplicity environment of heavy ion collisions are challenging, however, because of the large and dynamically fluctuating backgrounds in such events.
Heavy ion jet measurements at the LHC have reported medium-induced suppression in inclusive jet production [17, 18, 19, 20], as well as modification of di-jet and -jet correlations [21, 22, 23]. These measurements suppress the contribution of uncorrelated background to the jet signal by rejecting reconstructed jets on a jet-by-jet basis based on measured jet adjusted by an estimate of the uncorrelated background contribution, which may induce bias in the accepted jet population. The ALICE Collaboration at the LHC has measured jet quenching in central Pb+Pb collisions at = 2.76 TeV with a different approach to the suppression of uncorrelated background, using the semi-inclusive distribution of reconstructed jets recoiling from a high- trigger hadron [24]. In the ALICE approach, correction for large uncorrelated jet background is carried out at the level of ensemble-averaged distributions, without discrimination on a jet-by-jet basis of correlated jet signal from uncorrelated background jets. This background suppression procedure, which does not impose bias on the reported jet population, enables heavy ion jet measurements over a broad kinematic range, including large jet radius and low .
This manuscript reports new measurements of jet quenching in central and peripheral Au+Au collisions at = 200 GeV, by the STAR Collaboration at RHIC. These measurements are also based on the semi-inclusive distribution of reconstructed charged-particle jets recoiling from a high- trigger hadron. We apply a novel mixed-event technique for correcting uncorrelated jet background, and compare it to the approach used in the ALICE measurement [24]. Distributions of charged particle recoil jets with and jet resolution parameters (or jet radius) = 0.2, 0.3, 0.4 and 0.5 are reported as a function of and , the azimuthal angle of the jet centroid relative to that of the trigger axis.
These measurements probe medium-induced modification of jet production and internal jet structure in several ways. Suppression of jet yield in central compared to the yield in peripheral collisions with the same jet cone radius measures the energy transported to angles larger than . Comparison of recoil jet yield at different measures medium-induced modification of jet shape (intra-jet broadening [25, 26, 27]). The distribution of measures medium-induced acoplanarity (inter-jet broadening). Yield enhancement in the tail of the distribution could indicate medium-induced Molière scattering off quasi-particles in the hot QCD medium [28, 25]. The acoplanarity distribution of low energy jets is sensitive to , where is the jet transport parameter and is the in-medium path length [29].
We compare these results with those from ALICE [24], providing a direct comparison of jet quenching measured by reconstructed jets at RHIC and the LHC. Comparison of these measurements to distributions from p+p collisions at = 200 GeV can be used to identify nuclear effects that are present in peripheral Au+Au collisions. However, due to the lack of a measured reference distribution for p+p collisions at present, we compare the Au+Au measurements to expectations for p+p collisions at = 200 GeV from the PYTHIA Monte Carlo event generator, tune A [30], and from a perturbative QCD calculation at Next-to-Leading Order (NLO) [31].
The paper is organized as follows: Sect. II, experiment, dataset, and offline analysis; Sect. III, jet reconstruction; Sect. IV, semi-inclusive hadron+jet distributions; Sect. V, uncorrelated background and event mixing; Sect. VI, raw distributions; Sect. VII, corrections; Sect. VIII, systematic uncertainties; Sect. IX, closure test; Sect. X, perturbative QCD calculation; Sect. XI, results; and Sect. XII, summary.
II Experiment, Dataset, and Offline Analysis
STAR is a large, multi-purpose experiment at RHIC, consisting of a solenoidal magnet and detectors for triggering, tracking, particle identification, calorimetry, and event categorization [32].
The data used in this analysis were recorded during the 2011 RHIC run with Au+Au collisions at = 200 GeV. Events were accepted online with a minimum-bias trigger requiring the coincidence of signals from the Zero Degree Calorimeters (ZDC) and the Vertex Position Detectors (VPD) [33]. The trigger included the requirement that the -position of the primary vertex of the event () was within 30 cm of the nominal center of the STAR detector.
Offline analysis was carried out using charged tracks measured by the STAR Time Projection Chamber (TPC) [34]. The TPC has inner radius of 50 cm and outer radius of 200 cm, with acceptance over the full azimuth. The TPC registers a maximum of 45 independent points for a charged track. The primary vertex is defined using global tracks, based on fitting of TPC clusters. The vertex position resolution in the beam direction is for the highest multiplicity events in the analysis, which contain around 1000 primary tracks.
The analysis utilizes primary tracks, which are global tracks whose distance of closest approach to the primary vertex in the transverse plane () is less than 1 cm. The primary track momentum is determined by a fit that includes the primary vertex. Primary tracks with are accepted for further analysis.
The primary charged track transverse momentum resolution is []. The STAR tracking system momentum resolution at high has been verified by matching tracks to a shower in the Barrel Electromagnetic Calorimeter (BEMC) for electrons from W-decay in p+p collisions [35]. Tracks with primary larger than 30 are excluded from the analysis. The probability for an event to have both a track with and a track with is negligible.
Tracking efficiency is determined by embedding simulated tracks into real Au+Au events. Primary track efficiency for charged pions is 48% at = 0.2 , 67% at = 0.4 , and 73% at = 20 for central Au+Au collisions; and 66% at = 0.2 , 86% at = 0.4 , and 89% at = 20 for peripheral Au+Au collisions. At high transverse momentum the tracking efficiency of charged pions, kaons, and protons is similar, while the efficiency of protons and kaons is significantly lower than that of pions for .
Pile-up events, due to high instantaneous luminosity, are excluded offline by requiring at least two tracks from the primary vertex to be matched to cells of the Time-of-Flight (TOF) detector, which is a fast detector that can identify out-of-time tracks. Quality assurance is carried out on a run-wise basis, with a run corresponding to several hours of online data-taking. A run was rejected if its deviation from global mean values exceeded for mean transverse momenta or for multiplicity , measured using uncorrected charged track distributions in ; or for the interaction rate measured in the forward scintillator Beam-Beam Counters, .
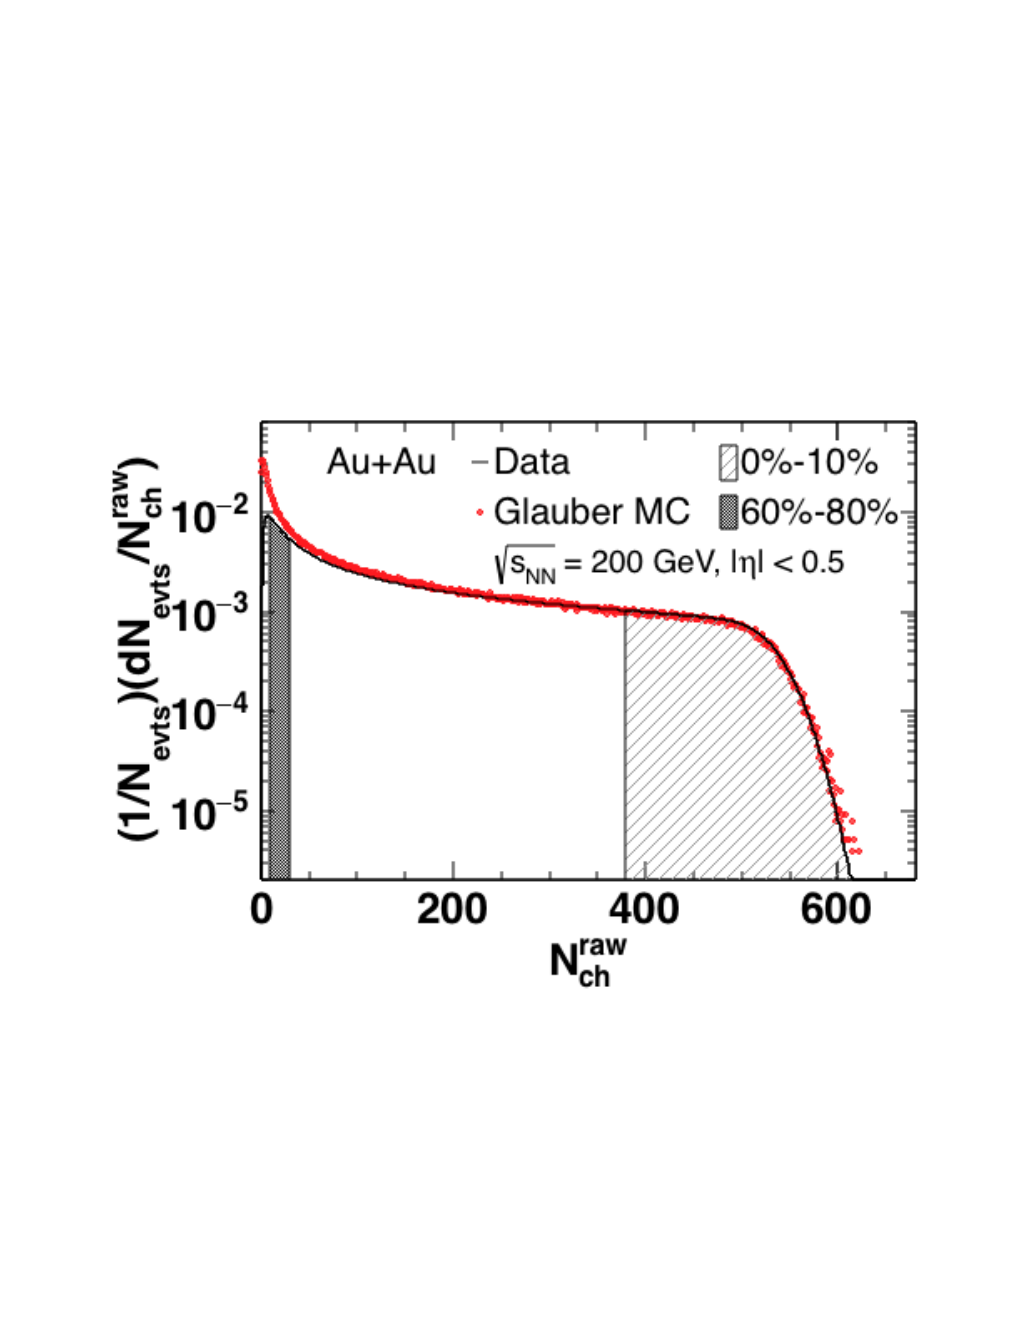
Figure 1 shows the distribution of uncorrected multiplicity of charged particle tracks within 0.5. Events are classified offline using percentile intervals of this distribution, with the 0%–10% (“central”) and 60%–80% (“peripheral”) intervals shown in the figure. The figure also shows the charged particle multiplicity distribution from a Monte Carlo Glauber calculation [36]. Comparison of the distributions from the Monte Carlo calculation and data gives an online trigger efficiency of 100% for central collisions and 70% for peripheral collisions.
After event selection cuts, the data set consists of 56.5 M central (0%–10%) and 106.7 M peripheral (60%–80%) events. The effect of trigger inefficiency in peripheral collisions is accounted for by a multiplicity-dependent weighting of events.
Simulated events are generated using PYTHIA 6.416 tune A [30] folded with a detector response based on GEANT3 [37]. Distributions calculated without incorporating detector response are denoted “particle level”, while distributions that include detector response are denoted “detector level.” Fast generation of detector-level events from particle-level PYTHIA simulations is carried out by random rejection of charged tracks to model tracking efficiency, and smearing of track to model momentum resolution, with -dependent efficiency and resolution.
Hybrid events for embedding studies are constructed by generating PYTHIA events for p+p collisions at = 200 GeV, selecting events containing a high- hadron in the trigger acceptance (Sect. IV), and applying the “fast generation” detector-level effects. Each simulated event is combined with a real Au+Au event at the track level from the central or peripheral population, without requiring a track in the trigger acceptance in the real event. Since embedding is carried out at the track level, tracks are specified in terms of , with no need to specify a vertex position. The hybrid events are analyzed using the same procedure used for real data analysis.
III Jet reconstruction
The analysis utilizes charged jets, which are composed of charged tracks. Jet reconstruction is carried out with the [38] and anti- [39] algorithms applied to all accepted charged tracks using the E-recombination scheme [38]. Jet distributions are corrected to the charged particle level for the effects of uncorrelated background and instrumental response.
Jet area is determined using the Fastjet area algorithm [40] with ghost particle area of 0.01. Ghost particles are randomly generated particles with negligible that are distributed uniformly in the acceptance with known density, and are clustered during jet reconstruction together with real tracks. The number of ghost particles in a jet thereby provides an infrared and collinear-safe (IRC-safe) measurement of jet area, for jets of arbitrary shape [40].
We utilize the following notation to distinguish of various types of jet in the analysis: is of jets generated by the jet reconstruction algorithm; is adjusted by an estimate of the uncorrelated background contribution; and is of jets after full correction for the effects of instrumental response and background fluctuations. For the simulation of p+p collisions, is the reconstructed jet energy at the particle-level and is at the detector-level, with no correction for uncorrelated background considered; i.e. these are equivalent to at the two levels of simulation.
Discrimination of correlated jet signal from uncorrelated background in this analysis is carried out at the level of ensemble-averaged distributions. Specifically, we do not discriminate the individual objects generated by the jet reconstruction algorithm based on features that may indicate contribution from high-Q2 partonic scattering processes. We therefore refer to all such objects as “jet candidates”, rather than simply as “jets”, to denote that a significant fraction of such objects are purely combinatoric in origin; i.e. without a component arising from a high-Q2 scattering process, in contrast to what is conventionally meant by the term “jet” in QCD.
Jet reconstruction is carried out multiple times for each event. The first jet reconstruction pass uses the algorithm with = 0.3 to estimate the background transverse energy density in the event [41],
| (1) |
where i labels the jet candidates in the event, and and are the transverse momentum and area of jet candidate i. The median is calculated by excluding the two hardest jets in the event for peripheral Au+Au collisions, and the three hardest jets for central Au+Au collisions.

Figure 2 shows the distribution of for central and peripheral Au+Au collisions. Distributions are shown for STAR data (SE) and for mixed events (ME, see Sect. V). The term SE refers to ”same events”, in contrast to mixed events. The value of varies event-to-event due to variation in gross event features within each centrality class, in particular multiplicity and transverse energy. There are peripheral Au+Au events with , which can occur for low multiplicity events since is calculated as the median of the jet energy density distribution.
Successive jet reconstruction passes are then carried out using the anti- algorithm, with = 0.2, 0.3, 0.4, and 0.5. For each jet candidate generated in these passes, the value of is adjusted by the estimated background energy density scaled by jet area [41],
| (2) |
The jet candidate acceptance is , where is the pseudo-rapidity of the jet centroid. A jet area cut suppresses jets comprising uncorrelated background, while preserving high efficiency for jet candidates containing a true jet. Jet candidates are rejected if for = 0.2; for = 0.3; for = 0.4; and for = 0.5. The jet area cut is discussed further in Sect. V.
Figure 3 shows the distribution of jets simulated by PYTHIA for fixed values of particle-level , as a function of detector-level . The detector-level effects correspond to conditions in central Au+Au collisions. These distributions represent the instrumental response to charged jets, and are non-Gaussian. Correction for these instrumental effects is carried out by an unfolding procedure [42, 43] utilizing an instrumental response matrix. It is nevertheless illustrative to quantify the main features of the instrumental response. For charged jets in the range , jet energy resolution (JER) due to instrumental effects has a peak with and tail to low jet energy, . The complete JER distribution has RMS = 25%, with negligible dependence of the JER on . The jet energy scale (JES) uncertainty due to instrumental effects, which arises predominantly from uncertainty in tracking efficiency, is 5%, likewise with negligible -dependence.

There is no absolute definition of uncorrelated background energy density in an event. The definition of outlined above is not unique; different choices of reconstruction algorithm, jet radius , and number of excluded jets, provide equally valid background estimates. As discussed below, the jet-wise adjustment in Eq. 2 is the first step in a multi-step process in which full correction for uncorrelated background utilizes an instrumental response matrix incorporating the same choice of . Since no jet candidates are excluded based on their value of in this analysis, the final corrected spectrum is independent of the specific choices made in the definition of . The above choices for are made for technical reasons, to ensure numerical stability of the unfolding procedures.
IV Semi-inclusive hadron+jet distributions
IV.1 Specification of observables
The analysis is based on the semi-inclusive distribution of charged jets recoiling from a high- trigger hadron (“h+jet”) [31, 44, 24]. The trigger hadron is a charged particle with within a specified interval. The interval for the primary analysis is , while lower is used for systematic studies.
The trigger hadron is selected inclusively: if there is a charged hadron observed within the interval the event is accepted, otherwise it is rejected. The probability per central Au+Au collision to find a hadron within the interval is about 0.1%, while the probability to observe multiple trigger hadron candidates is negligible. The resulting -distribution of trigger hadrons is therefore the same as that of the inclusive charged hadron distribution. The trigger hadron is not necessarily the highest- hadron in the event, because neutral hadrons are not considered in the analysis.
Figure 4 is an event display for an Au+Au collision in the central event population, showing charged tracks, ghost particles, and reconstructed jet candidates. The acceptance is densely populated with tracks, and all tracks shown are associated with an accepted jet candidate. Voids in the track distribution occur near the edges of the jet fiducial acceptance, where the region occupied by a jet candidate lies partially within the tracking acceptance but its centroid lies outside the jet acceptance. The most energetic jet in this event happens to contain the trigger hadron, but that is not required. The recoil acceptance contains two jets with .
The measured observable is the number of recoil jets observed in a phase space bin, normalized by the number of trigger hadrons. Because the trigger hadron is chosen inclusively, the resulting distribution is semi-inclusive and is equivalent to the ratio of production cross sections,
| (3) |
where AA denotes p+p or Au+Au collisions; is the number of trigger hadrons; is the cross section to generate a hadron within the interval; is the differential cross section for coincidence production of a trigger hadron and recoil jet; and are the charged jet transverse momentum and pseudo-rapidity; and is the azimuthal separation between trigger hadron and recoil jet.
We report two projections of Eq. 3: the jet yield integrated over a recoil region in azimuth relative to the trigger hadron direction,
| (4) |
and the azimuthal distribution of recoil jets in an interval of ,
| (5) |
IV.2 Discussion of observables
The semi-inclusive observable defined in Eq. 3 isolates a single high- process in each event by the requirement of a high- hadron, and then measures the distribution of correlated recoil jets. The main considerations for this choice of observable are as follows (see also [24]).
The observable in Eq. 3 is equivalent to the ratio of inclusive cross sections, which we first discuss from a theoretical perspective. Inclusive high- hadron production in p+p collisions at = 200 GeV is well-described by pQCD calculations at NLO [45, 46], and the h+jet cross section in p+p collisions at = 200 GeV has also been calculated in pQCD at NLO [31]. For p+p collisions at = 200 GeV, the observable in Eq. 3 is therefore calculable in pQCD at NLO (Sect. X). In Au+Au collisions at = 200 GeV, hadrons with are expected to arise predominantly from jet fragmentation [47], and pQCD calculations incorporating medium-evolved fragmentation functions and other techniques are in good agreement with measurements of inclusive hadron suppression at high [48, 49, 15]. Inclusive hadron production in Au+Au collisions is therefore well-understood in the trigger interval of this analysis, using perturbative approaches.
Any procedure to accept a subset of events from the Minimum Bias distribution imposes bias on the accepted event population. Event selection in this analysis is simple, requiring only the presence of a high- charged hadron in the event, with no requirement that a jet satisfying certain criteria be found in the recoil acceptance. Specifically, no rejection of jet candidates is carried out based on , and discrimination of correlated from uncorrelated yield is carried out at the level of ensemble-averaged distributions. All jet candidates in the recoil acceptance therefore contribute to the recoil jet distribution, and no selection bias is imposed on the correlated recoil jet population by the procedure to discriminate correlated jet signal from background.
Trigger hadron selection is carried out inclusively, resulting in the same -distribution as that of inclusive hadron production [5, 9]. Although the same kinematic selection is used for central and peripheral Au+Au collisions ( ), the selected distribution of underlying hard processes may differ between collision centralities because of jet quenching effects on high- hadron production, resulting in different trigger bias. However, selection of high- hadrons is expected from model studies to bias towards leading fragments of jets that have experienced little quenching, due to the interplay of jet energy loss, the shape of the jet production spectrum, and jet fragmentation [16], and thereby limiting the effects of quenching on the trigger bias.
Insight into the centrality dependence of the trigger bias can be obtained from measurements of inclusive high- hadron production, whose yield is strongly suppressed in central Au+Au collisions at = 200 GeV [9, 5]. Yield suppression of production, measured by the ratio of the inclusive yield in Au+Au to that in p+p collisions (), has a rate of change with in central Au+Au collisions (0%-5%) of , over the range [9]. Similar -dependence is observed for peripheral collisions, though with larger uncertainty. In other words, while inclusive hadron production is strongly suppressed in central relative to peripheral Au+Au collisions, the shape of the inclusive -distribution is the same within uncertainties for the two centralities. This supports the conjecture of high- trigger hadrons being generated preferentially by non-interacting jets, thereby selecting a similar distribution of hard processes for peripheral and central collisions, though at a suppressed rate for central collisions.
Further exploration of the trigger bias in this measurement requires theoretical calculations that incorporate jet quenching. Since inclusive hadron is modeled accurately by such calculations ([15] and references therein), they will likewise model the trigger bias accurately by including effects of jet quenching on the generation of trigger hadrons.
IV.3 Interpretation of distributions
For jets in vacuum, a pQCD description is thought to be applicable for , where jets are interpreted in terms of fragmentation of quarks and gluons. In this analysis, in contrast, the terms “jet” and “jet candidate” refer generically to objects reconstructed by the anti- algorithm with specified , without regard to the interpretability of such objects in terms of quark or gluon fragmentation. The raw spectrum is measured as a function of , with contribution to each bin in from a broad range in due predominantly to large -smearing by background fluctuations. No cuts are applied on , in order not to bias the measured distributions.
The corrected recoil jet distributions therefore contain entries for the entire range that is formally allowed, , and represent the distribution in of all jet-like objects that are correlated with the trigger. The per-trigger rate of such objects is finite for , since jet-like objects with subtend finite area, and a finite number of such objects fill the experimental acceptance.
The corrected recoil jet distributions are presented in Sect. XI over their full measured range, . However, for interpretation of these distributions in terms of parton showers and their modification in-medium, we restrict consideration to , the range over which a perturbative description of jets is commonly thought to be applicable in vacuum.
V Uncorrelated background and event mixing
Jet production in collisions of heavy nuclei occurs in a more complex environment than in p+p collisions, due to the high multiplicity of hadrons arising from copious soft interactions ( few GeV2) and the high rate of multiple, incoherently generated jets. Collective effects in the evolution of the system also shape the event structure. Hadrons from these various sources will contribute to the population within each phase-space region of dimension that is characteristic of jet reconstruction. This renders jet measurements in nuclear collisions especially complex, necessitating precise definition of jet signal and uncorrelated background.
In this analysis, the raw jet yield distribution as a function of requires correction for the large yield of background jets that are uncorrelated with the trigger hadron, and for the -smearing of correlated jets by the background. The uncorrelated background jet yield is subtracted at the level of ensemble-averaged distributions using mixed events (ME), described below. Correction for -smearing due to background fluctuations is carried out by the unfolding of ensemble-averaged distributions.
In the ME procedure, real events from the population without high- trigger bias are assigned to exclusive classes, with each class corresponding to a narrow bin in , the uncorrected charged particle multiplicity; , the -position of reconstructed vertex; and , the azimuthal orientation of the event plane (EP) in the laboratory frame. The EP orientation is an approximation of the reaction plane orientation, defined by the collision impact parameter and the beam axis. Event plane reconstruction is described in [50].
There are 8 bins in , 20 bins in , and 4 bins in , corresponding to 640 distinct event mixing classes. Within each multiplicity bin the distribution of track multiplicity is sampled from the SE data set, to accurately reproduce the multiplicity distribution of real events. This procedure accounts for the multiplicity bias in events containing a high- trigger hadron, relative to the MB population.
Each mixed event with tracks is generated by drawing one track from each of different events in a mixing class. For efficient construction of ME events, the event mixing algorithm draws from a buffer of about 1000 real events, with the algorithm terminating when any event in the buffer has had all its tracks used. All unused tracks remaining in the buffer are discarded, the event buffer is refilled, and the procedure is repeated. Tracks are therefore used at most once in the mixing procedure.
The ME procedure generates an event population without multi-hadron correlations, but with the detailed features of real data in terms of non-uniformity in instrumental response and variation in detector acceptance due to the distribution. Incorporation of such detector effects in the ME population is required for accurate determination of the uncorrelated background distribution in the recoil jet population.

Figure 5 shows the distribution of tracks with for central Au+Au data, for SE events and for ME events from one mixing class. The bottom panel shows the projection of the two distributions onto . The periodic structure in the projection is due to reduced tracking efficiency near TPC sector boundaries, while the broad dip in the region is due to reduced overall efficiency in two TPC sectors in this dataset. As noted above, only a subset of tracks from real events is used in the ME population. Nevertheless, the SE and ME projections agree in detail. Similar agreement is seen for all other ME mixing classes. This level of agreement is likewise stable throughout the data-taking period, with negligible time dependence.
The jet distribution due to uncorrelated background is determined by carrying out the same jet reconstruction procedure on the ME events as is used for the real data. However, no high- trigger hadron is required for the ME analysis; rather, the trigger axis for ME events is chosen by selecting a random track, resulting in a similar azimuthal distribution to that in analysis of the SE population.
No jet candidates are excluded in the calculation of for ME events, in contrast to the calculation of for SE events (Sect. III). This choice is motivated by fact that all multi-hadron correlations, including those due to jets, are suppressed in ME events. Figure 2 shows the distribution of in one event-mixing class, for both SE and ME events. The SE and ME distributions are in good agreement for both peripheral and central collisions, thereby validating the jet exclusion choices made for the various event populations. The fit of a Gaussian function to the central peak of the SE distribution gives . Looking in detail at the tails of the distribution, the SE/ME ratio for central Au+Au collisions (lower panel, blue points) shows an excess in SE relative to ME of about 50% in the left tail (smaller ), where the rate is a factor smaller than at the peak of the distribution. This small relative change suggests that the ME distribution is slightly narrower than the SE distribution. In order to quantify this effect, the ME distribution is shifted towards smaller by 60 MeV/( sr) (red points), where a similar increase in SE/ME ratio is now seen instead in the right tail at larger . The width in the far tails of the ME distribution is therefore smaller than the SE width by less than 60 MeV/( sr). We discuss this effect below, in the context of Fig. 9.

Figure 6 shows the distribution of jet candidates as a function of and for one event-mixing class, for SE events (top panel); ME events (middle panel); and the projection of both distributions onto (bottom panel). The SE and ME distributions in Fig. 6 agree in detail, with a peak in centered near . The bottom panel also shows the distribution from a PYTHIA particle-level simulation of p+p collisions at = 200 GeV, for all reconstructed jets and for jets with recoiling from a trigger hadron with . The area distribution for coincides with the main peak, without the tail to smaller area.
The detailed agreement of the distributions for SE and ME events seen in Fig. 6, lower panel, shows that the distribution for high-multiplicity events is driven predominantly by geometric factors, specifically the experimental acceptance and , together with response of the anti- algorithm to the high-multiplicity environment. The correlated structure of true jets plays a less significant role. We note in addition that for true jets reconstructed with the anti- algorithm is insensitive to the presence of uncorrelated background [39]. Reduction in the uncorrelated background jet yield can therefore be carried out by a cut on , as indicated by the vertical dashed line. Based on the PYTHIA particle-level simulation, this cut suppresses about 15% of the yield of correlated jets for , with negligible suppression for .
VI Raw distributions
Figures 7 and 8 show distributions of the uncorrected recoil jet yield in Au+Au collisions projected onto , for between 0.2 and 0.5. The upper sub-panels show the distributions separately for data (red points) and mixed-event background (shaded histogram). The lower sub-panels are discussed below.
The number of jet candidates found in an event is necessarily bounded, due to the area subtended by each jet candidate and by the total experimental acceptance. Table 1 shows the integral over for the SE and ME distributions shown in Figs. 7 and 8. The integral is the average number of observed recoil jet candidates per trigger hadron, including both correlated and uncorrelated. The integrals decrease with increasing , as expected since jets with larger subtend larger area. The integral values are larger for central than for peripheral Au+Au collisions at the same , corresponding to larger jet density for central collisions, which is expected since peripheral collisions are more sparsely populated.
The integrals of the SE and ME distributions in central Au+Au collisions agree to better than 1% for each value of . Invariance of such integrals for event classes with differing jet-like correlations has also been observed for high-multiplicity events in model studies [44], and in the analysis of Pb+Pb collisions at 2.76 TeV [24]. At high multiplicity this integral, like the distribution, is evidently driven predominantly by geometric factors, specifically the experimental acceptance, characteristic jet size , and the robustness of the shape of anti- jets in the presence of background [39], but not by the presence of multi-hadron correlations, whose contribution is different in different event classes and is absent entirely in the ME population.
| Au+Au centrality | Integral | |||
| SE | ME | |||
| peripheral (60%-80%) | 0.2 | 0.446 | 0.397 | |
| 0.3 | 0.269 | 0.252 | ||
| 0.4 | 0.184 | 0.175 | ||
| 0.5 | 0.094 | 0.089 | ||
| central (0%-10%) | 0.2 | 1.26 | 1.26 | |
| 0.3 | 0.392 | 0.391 | ||
| 0.4 | 0.228 | 0.227 | ||
| 0.5 | 0.119 | 0.119 | ||
In each panel of Figs. 7 and 8, the shape of the ME distribution is very similar to that of the SE distribution in the region , where the yield is expected to arise predominantly from uncorrelated background. The shapes differ significantly at large positive , where an appreciable contribution from correlated true jets is expected. Additionally, the absolutely normalized ME distributions are observed to have larger yield than the SE distributions in the region , consistent with the smaller yield in ME at large positive and agreement of the SE and ME integrals within better than 1% for central collisions and within about 10% for peripheral collisions. These features have also been observed for high-multiplicity events in model studies [44] and in analysis of LHC data for Pb+Pb collisions [24].
In order to utilize the ME distribution to determine the contribution of uncorrelated background in the SE distribution, the absolutely normalized ME distribution is therefore scaled downwards by a scalar factor , determined by a fit in the blue shaded regions in the upper sub-panels. The range in for determining the central value of is chosen as the left-most region of the spectrum in which the SE/ME yield ratio is uniform within 10%. The lower sub-panels show the SE/ME yield ratio after normalization by , while the inserts show the ratio in the fit region, also after normalization. Tab. 1 gives the values of . The systematic uncertainty of in Tab. 1 is determined by varying the normalization region.
For jets in central collisions and = 0.5, the ratio of normalized ME and SE distributions is within 10% of unity in the region , over which the distributions themselves vary by two orders of magnitude (Fig. 8, lower left). Similarly good agreement of the shapes of the SE and ME distributions over a significant range in is observed for the other values . This good agreement indicates that the normalized ME distributions represent the uncorrelated background accurately, and can therefore be used over the full range of for correction of uncorrelated background in the SE distribution.
For peripheral collisions, the SE distributions fall more rapidly in the region and the ME distributions are overall much narrower than for central collisions, as expected since the uncorrelated background level is much lower. The width of the normalization region is correspondingly much narrower than for central collisions, with a weaker constraint imposed on . However, the precision required for is much reduced for perpheral collisions, precisely because of the much smaller uncorrelated background contribution.
Figure 9 shows the uncorrected recoil jet distribution for central Au+Au collisions and = 0.3, for two different ranges in , and . The SE distribution for the higher- interval and the ME distribution are the same as in Fig. 7, lower left. Lower values of are expected to select processes with smaller on average, and indeed are observed to generate a lower rate of correlated recoil jets in both p+p and Pb+Pb collisions at LHC energies [24]. By measuring the SE distribution for different ranges of , as in Fig. 9, we therefore vary the rate of correlated jet yield in the recoil jet candidate population, while keeping the distribution of uncorrelated jet candidates unchanged.
In Fig. 9, upper panel, the ME distribution and the SE distribution with are very similar in the range , over which the distributions themselves vary by more than five orders of magnitude. It is only in the region that this SE distribution exceeds the ME distribution by a significant factor, indicative of a correlated recoil jet component with relative yield compared to all jet candidates of less than .
The SE distributions with different lower bound for are likewise similar in the region , but differ for larger , as expected. The good agreement of the ME distribution and both SE distributions for negative and small positive confirms that the yield in this region is dominated strongly by uncorrelated background. Their ordering in magnitude at larger also shows that the SE distribution approaches the ME distribution as the lower bound of is reduced towards zero.
Figure 9, lower panel, shows ratios of the SE and ME distributions for the two different trigger hadron ranges. The distributions utilize the primary analysis approach described in Sect. III, including the choices specified there for determining the background density (Eq. 1). The ratios exhibit a variation of 20%-30% in the region . While the distributions themselves vary by several orders of magnitude over this range and this variation is small in relative terms, it is nevertheless observable.
Variation in the ratio is related to the ambiguity in defining for the SE and ME populations. In Sect. V we noted that the tails of the distribution are slightly narrower for the ME than the SE population, by less than 60 MeV/( sr). To assess the influence of this difference, the red dashed line in Fig. 9, lower panel, shows the ratio of the SE and ME recoil jet distributions for , but with the value of for each event shifted systematically by 60 MeV/( sr) as in Fig. 2. In this case, variation in the SE/ME recoil jet yield ratio is reduced to less than 5% for . The ratio increases rapidly at larger , due to significant correlated yield in the SE distribution.
The influence of the slightly narrower distribution in the ME population on correction of the recoil jet spectra was assessed by carrying out the full analysis (described in the following sections) for representative cases, with and without a 60 MeV/( sr) shift in . The resulting change in the fully corrected recoil jet yield is significantly smaller than its systematic uncertainties due to other sources. An effective shift in can also arise from azimuthal anisotropy () of the trigger, which is considered below. We therefore do not consider the effect of the narrower distribution in the ME population further in the analysis.
The ALICE Collaboration has measured semi-inclusive h+jet distributions for Pb+Pb collisions at = 2.76 TeV with a correction procedure for uncorrelated background that utilizes the difference between normalized recoil jet distributions for exclusive ranges of [44, 24]. Compared to the current analysis, the ALICE analysis differs in its use of an SE jet distribution recoiling from lower to measure uncorrelated background, rather than the ME distribution. This approach results in a different observable, [24], in which the small correlated component of the lower threshold SE distribution is also removed by the subtraction. However, the low-threshold SE and ME distributions in Fig. 9 are similar in the current analysis, so that the difference between calculated with this choice of kinematics for the low-threshold SE and is expected to be negligible. Direct comparison of these related correction procedures will be explored in future analysis, with larger data sets.
We note in addition that these two approaches differ in their treatment of multiple partonic interactions (MPI). Background due to MPI arises when a trigger hadron and a jet in the recoil acceptance are generated by two different, incoherent high- processes in the same collision. This background is expected to be independent of , and to be larger in heavy ion than in p+p collisions. Since is the difference of two SE distributions, which have the same MPI background by definition [24], the MPI background is removed from by construction. In contrast, in the current analysis the event mixing procedure destroys all jet-like correlations, and the ME distribution does not contain an MPI component. However, comparison of the SE and the ME distribution in Fig. 9 shows that their difference, which contains the MPI background component, is negligible compared to the correlated yield for the SE distribution. Background due to MPI is therefore negligible in this measurement, and no correction for it is warranted in the analysis.

Figure 10, upper panels, show distributions of the background-subtracted recoil jet yield for = 0.3 in peripheral Au+Au collisions at = 200 GeV from STAR data, and in p+p events at = 200 GeV simulated with PYTHIA at the detector level. The middle and lower panels show the projection onto for selected intervals in . Correction of for uncorrelated background by subtraction of the ME distribution is discussed in Sect. XI.3. No correction is carried out for the effects of underlying event in the PYTHIA-generated p+p collision events.

Figure 11 shows the same distributions as in Fig. 10, but for central Au+Au STAR data with background subtraction, and for PYTHIA-generated events at the detector level for = 200 GeV p+p collisions embedded into central Au+Au STAR data at the track level.
The middle and lower panels of Figs. 10 and 11 show fits to the distributions with a function that is the sum of two Gaussian distributions, both centered on , with fitted widths and . The values of and are correlated. The fit provides a qualitative characterization of the azimuthal distributions. The widths of the central peaks are seen to be similar in the peripheral data and PYTHIA distributions, and in the central data and PYTHIA embedded in central events. The recoil yield is suppressed for both peripheral and central collisions relative to the yield predicted by the PYTHIA calculation, with greater suppression for central collisions. Quantitative analyses of these features is presented in Sect. XI.
VII Corrections
Figure 12 shows the raw correlated recoil jet yield distributions for = 0.2 and = 0.5 in central and peripheral Au+Au collisions, determined by subtracting the -normalized ME distribution from the SE distribution. The SE-ME distributions for = 0.3 and = 0.4 (not shown) are similar, with features that interpolate between the distributions in the figure.
In the region where the SE and ME distributions have similar magnitude, their difference can be negative due to statistical fluctuations. However, the vertical axis of Fig. 12 is logarithmic, and negative entries are not displayed. Negative values only occur in the region for peripheral Au+Au collisions, and in to (-dependent) in central Au+Au collisions. The negative values after subtraction are consistent with zero within statistical uncertainty in all cases, and carry negligible weight in the correction and unfolding procedures discussed below. All negative entries are therefore set to zero, to simplify the unfolding procedure.
These distributions must still be corrected for the effects of local fluctuations in background energy density and for instrumental response. The corrections are carried out using regularized unfolding methods [42, 43]. In this approach, the measured jet distribution and true jet distribution are related by a response matrix,
| (6) |
where the square brackets express the cumulative response matrix as the product of matrices separately encoding background and instrumental response effects; is the particle-level charged jet ; is the detector-level charged jet ; and the reconstructed jet at the detector level, including -smearing due to uncorrelated background. Factorization of the response into two separate matrices was studied in simulations and found to have negligible influence on the corrected distributions.
The corrected spectrum, which is a measurement of , is determined by inverting Eq. 6. However, exact inversion of Eq. 6 can result in a solution which has large fluctuations in central values and large variance, due to statistical noise in [42]. A physically interpretable solution can be obtained by regularized unfolding, which imposes an additional smoothness constraint on the solution.
VII.1 Uncorrelated background response matrix
Central Au+Au collisions have large uncorrelated background energy density, with significant local fluctuations. While the scalar quantity accounts approximately for the event-to-event variation of uncorrelated background energy, it does not account for local background fluctuations that smear . Full background correction requires unfolding of these fluctuations.
The response matrix for fluctuations in uncorrelated energy density is calculated by embedding detector-level simulated jets into real events at the track level, reconstructing the hybrid events, and matching each embedded jet with a reconstructed jet. The matching is carried out in the same way as for , described below. The response matrix elements are the probability distribution of , the -shift from the embedding procedure:
| (7) |
High- hadrons can be correlated in azimuth with the EP orientation. The strength of this correlation is characterized by , the second-order coefficient of the Fourier expansion of the azimuthal distribution between the hadron and the EP [51]. If is non-zero for , selection of a trigger hadron will bias the EP orientation in the accepted event population, thereby biasing the level of uncorrelated background in the recoil acceptance opposite to the trigger. This bias is taken into account in the calculation of the probability distribution by weighting the relative orientation of the trigger axis and EP orientation according to .
Observables based on reconstructed jets measure energy flow associated with a high- process, independent of the specific distribution of hadrons arising from jet fragmentation. For accurate correction of local background fluctuations, the background response matrix should likewise depend only on the energy of the embedded object, and be independent of its specific distribution of hadrons. To explore this variation we use two different jet models for embedding: charged jets generated by PYTHIA, and single tracks carrying the entire jet energy . Models with softer fragmentation than PYTHIA have likewise been explored in simulations, giving similar results [52].
Figure 13, upper panel shows the probability distribution for different values of the embedded track, in central Au+Au collisions. Negligible dependence on is observed. The lower panel shows the probability distribution for = 20 with three different models for the embedded jet: PYTHIA-generated with no EP-bias; single particles with no EP-bias; and single particles with EP-bias corresponding to = 0.04 for the trigger hadron, which is the largest value for hadrons with that is compatible with the uncertainty band measured in [51]. The three distributions are similar, supporting this approach to correction for background fluctuations. Unfolding is carried out using all three distributions, with the variation between them contributing to the systematic uncertainty. Measurements of and higher harmonics for high- hadrons are not presently available at RHIC energies. However, non-zero for the trigger hadron would only offset the influence in the recoil direction of trigger hadron .
Figure 14, upper panel, shows the full background response matrix , calculated by embedding single tracks.


VII.2 Instrumental response matrix
The largest contribution to the instrumental response matrix is from tracking efficiency, which shifts the spectrum lower in . There is a smaller contribution from track momentum resolution, which smears .
The matrix is determined using PYTHIA-generated events for p+p collisions at = 200 GeV. Jet reconstruction is carried out at the particle level with the anti- algorithm. Detector-level jets are generated by fast simulation, applying the effects of tracking efficiency and track resolution on the constituents of each particle-level jet. Jet reconstruction is then carried out on the detector-level event. Jets from this procedure are rejected if they lie outside the experimental acceptance, for both the particle-level and detector-level populations.
Tracks in particle-level jets are matched to detector-level tracks. For each particle-level jet, the detector-level jet with the largest fraction of the particle-level jet energy is matched to it, with the additional requirement that the fraction be greater than 15%. The elements of are the probability for a particle-level jet with to have matched detector-level partner with . Elements of are normalized such that, for each bin in , the sum over all bins in is unity. The inefficiency arising from particle-level jets without a detector-level match is corrected on a statistical basis (Sect. VII.4), in a separate correction step.
As discussed in Sect. IV.3, the approach of this analysis results in corrected distributions for , while interpretation of such distributions in terms of parton showers and their modification in-medium is restricted to . In order to avoid the introduction of arbitrary cuts, is constructed as described above for , though jet-like objects with should be interpreted with caution in terms of the fragmentation of quarks and gluons.
The contribution of secondary decays was determined using PYTHIA. The effect of feed-down from weak decays is negligible compared to other systematic uncertainties, and no correction for this effect is applied.
Figure 14, lower panel, shows the matrix for central Au+Au collisions. Matrix elements with arise largely due to tracking efficiency, which causes tracks to be lost from the jet. Matrix elements with , which is less probable, arise from the effect of momentum resolution, for cases in which -loss due to tracking efficiency is small.
VII.3 Unfolding
Unfolding is carried out using two different methods: an iterative method based on Bayes’s Theorem [53], and a method based on Singular Value Decomposition (SVD) [43]. For iterative Bayesian unfolding, regularization is imposed by limiting the number of iterations, while for SVD unfolding, regularization is imposed by truncating the expansion to terms.
The unfolding procedure requires specification of a prior distribution. In order to assess the dependence of the unfolded solution on the choice of prior, several different prior distributions were used for both the Bayesian and SVD methods (see Sect. VIII.4).
VII.4 Jet reconstruction efficiency
The matching procedure between particle-level and detector-level jets in Sect. VII.2 does not generate a match for every particle-level jet. The corresponding detector-level jet can be lost due to fiducial cuts and instrumental response, most notably tracking efficiency: especially for low- jets containing few tracks, there is a non-zero probability that none of the tracks will be detected due to tracking efficiency less than unity. In addition, the jet area cut generates a small inefficiency for , with negligible inefficiency at larger (Sect. V).

Figure 15 shows the jet reconstruction efficiency for central and peripheral Au+Au collisions, defined as the matching efficiency between particle-level and detector-level jets. The efficiency is calculated for particle-level jets whose centroid is within the experimental acceptance, . The systematic uncertainty in efficiency, indicated by the bands, is due predominantly to uncertainty in the tracking efficiency. The correction for inefficiency is applied bin-by-bin to ensemble-averaged distributions, after the unfolding step.
VII.5 Estimated magnitude of corrections

We conclude this section by estimating the magnitude of corrections. The estimate, shown in Fig, 16, is based on the recoil jet distribution ( = 0.3) for p+p collisions at = 200 GeV calculated by PYTHIA at the particle level (blue stars), which is then modified by the inverse of the corrections discussed above. The effects correspond to a measurement in central Au+Au collisions. Instrumental effects, which are dominated by tracking efficiency, shift the distribution to lower (blue stars green dashed). Fluctuations due to uncorrelated background, as characterized by the distribution, smear but do not change the integrated yield of the distribution (green dashed grey solid). Finally, the large population of uncorrelated background jet candidates in central Au+Au collisions modifies the spectrum significantly for (grey solid red circles). The cumulative correction for instrumental response and uncorrelated background therefore corresponds to the transformation from red circles to blue stars. If considered on a bin-by-bin basis, the cumulative correction modifies the magnitude of the distribution by a factor less than two for .
VIII Systematic Uncertainties
Systematic uncertainties arise from the corrections for instrumental response and uncorrelated background, and from the different algorithmic choices in the unfolding procedure. This section discusses the significant systematic uncertainties, with representative values given in Tab. 2.
VIII.1 Instrumental response
The systematic uncertainty due to track reconstruction efficiency is determined by varying the efficiency by 5% relative to its central value (Sect. VII.2). This variation generates a shift in , corresponding to variation in yield at fixed of less than 10% for all , in both central and peripheral Au+Au collisions. Variation of other instrumental response corrections, including track resolution and the contribution of secondary decays, generate smaller systematic uncertainties. The systematic uncertainty due to instrumental effects is labeled “Instr” in Tab. 2.
VIII.2 Mixed events
Correction for uncorrelated background by subtraction of the ME from the SE distribution requires normalization of the ME distribution by the factor (Tab. 1). Variation of the normalization region for determining results in a systematic uncertainty in corrected recoil jet yield of less than 10% (“ME norm” in Tab. 2).
The track population used to generate the ME data set includes high- tracks that arise predominantly from the fragmentation of jets, and their inclusion means that not all jet-specific structure has been removed from the ME distributions. In order to assess the importance of this contribution, the ME events were modified to remove all tracks with and the analysis was repeated. No significant change in the distribution of reconstructed jets was observed from this modification.
VIII.3
The probability distribution of , which represents the fluctuations in uncorrelated background energy, was varied by using different models for embedded jets: single hadrons with the full jet energy, distributed either uniformly in azimuth or with anisotropic azimuthal distribution relative to the EP corresponding to of the trigger hadron [51], or PYTHIA-simulated jets at the particle level with uniform azimuthal distribution. This variation of the distribution generates a systematic uncertainty in corrected jet yield of up to 19% for central Au+Au collisions (“” in Tab. 2).
VIII.4 Unfolding
Systematic uncertainty due to the unfolding procedure was determined by varying the choice of unfolding algorithm, choice of prior, and regularization cutoff. Two different unfolding algorithms were used: iterative Bayesian and SVD. Two different functional forms of the prior were used: the recoil jet distribution for p+p collisions at = 200 GeV, calculated by PYTHIA, and a parameterized Levy distribution,
| (8) |
The parameters and , which determine the spectrum shape at low and high respectively, were varied independently but constrained to GeV and . These parameter ranges generate priors whose shapes bracket the resulting unfolded solutions, indicating convergence of the unfolding procedure.
For iterative Bayesian unfolding, the regularization limit on the number of iterations is varied between 1 to 5. For SVD unfolding, regularization is imposed by truncating the number of terms in the series expansion between 2 to 5.
The systematic uncertainty in corrected recoil jet yield resulting from these variations in unfolding procedure is -dependent, and is labeled “Unfold” in Tab. 2.
VIII.5 Cumulative uncertainties
There is a complex interplay between the various components of the correction procedure. To determine the cumulative systematic uncertainty, each of the components was varied independently, thereby sampling the parameter space of corrections. The unfolding process was carried out multiple times, varying the choices for tracking efficiency, ME normalization, algorithm, unfolding algorithm, prior, and regularization cutoff.
For each specific set of choices, convergence of the unfolded distribution was evaluated by convoluting it with the same set of corrections (“backfolding”) and comparing the result to the initial raw distribution using a test. The errors used to calculate are the diagonal elements of the covariance matrix from the unfolding procedure. The off-diagonal covariance elements, representing the correlation between bins, were not considered in this test. A set of choices was accepted if the comparison had less than a threshold which varied between 1.8 and 6.5, depending upon jet radius and collision centrality. For SVD unfolding, if an unfolded spectrum with regularization parameter was accepted, variations with the same prior but larger value of were rejected.
| Systematic uncertainty (%) | |||||||
|---|---|---|---|---|---|---|---|
| range [] | centrality | Instr | ME norm | Unfold | Cumulative | ||
| 0.2 | [5,10] | peripheral (60%-80%) | 4 | 2 | 1 | 6 | 10 |
| central (0%-10%) | 7 | 10 | 19 | 41 | 47 | ||
| [10,20] | peripheral (60%-80%) | 6 | 2 | 2 | 12 | 18 | |
| central (0%-10%) | 7 | 5 | 10 | 31 | 36 | ||
| [20,25] | peripheral (60%-80%) | 11 | 8 | 6 | 25 | 33 | |
| central (0%-10%) | 10 | 7 | 16 | 47 | 49 | ||
| 0.5 | [5,10] | peripheral (60%-80%) | 4 | 3 | 4 | 22 | 23 |
| central (0%-10%) | 6 | 5 | 3 | 21 | 27 | ||
| [10,20] | peripheral (60%-80%) | 7 | 1 | 4 | 31 | 35 | |
| central (0%-10%) | 4 | 2 | 7 | 28 | 34 | ||
| [20,25] | peripheral (60%-80%) | 9 | 3 | 5 | 29 | 35 | |
| central (0%-10%) | 8 | 1 | 10 | 30 | 39 | ||
Due to the interplay between various components of the correction procedure, the contribution of each component to the cumulative systematic uncertainty of the recoil jet yield cannot be uniquely specified. Nevertheless, it is instructive to identify the principal factors that drive the cumulative systematic uncertainty. Table 2 shows representative values of each uncertainty component, for = 0.2 and 0.5 in central and peripheral Au+Au collisions. These values are calculated by varying only the specified component, and keeping all other components in the correction procedure fixed. The uncertainties are averaged over three different ranges of , weighted by the spectrum shape. It is seen that the unfolding procedure generates the largest systematic uncertainty in the recoil jet yield.
The rightmost column of Tab. 2 shows the cumulative systematic uncertainty in recoil jet yield. However, the unfolding process generates significant off-diagonal covariance, especially for large , arising predominantly from correction of fluctuations in uncorrelated background. In order to indicate the significant correlation between different values of , in the following sections we represent the unfolded distributions graphically as bands rather than as binned histograms, with the width of the band representing the outer envelope of all distributions that were accepted by the above procedure.
IX Closure test
Convergence of the full correction procedure was validated by a closure test on simulated data, utilizing events for p+p collisions at = 200 GeV generated by PYTHIA. Figure 17, upper panel, shows the particle-level distribution of these events for jets with = 0.3, which is similar in shape to the fully corrected distribution from data for peripheral Au+Au collisions.
Detector-level events were generated with tracking efficiency and -resolution corresponding to those of central Au+Au collisions. Each detector-level simulated event containing an accepted trigger hadron was embedded into a mixed event from the central Au+Au data set. The hybrid dataset has the same number of trigger hadrons as the real dataset, so that effects arising from finite event statistics are modeled accurately. The complete analysis chain, including generation of and the full set of corrections via unfolding, was then run on the hybrid events to generate the fully corrected recoil jet spectrum, as shown in the upper panel.

Figure 17, lower panel, shows the ratio of the fully-corrected recoil jet distribution to the particle-level input distribution. The band shows the systematic uncertainty of the corrected distribution. For , fluctuations in the central value arise from the finite number of events in the input spectrum of the simulation, since the corrected distribution in the numerator is smoothed by regularized unfolding. For , the ratio is consistent with unity within the uncertainty of about 20%, with no indication of a -dependent bias in central value.
X Perturbative QCD calculation
The semi-inclusive recoil jet distribution is the ratio of cross sections for h+jet and inclusive hadron production (Eq. 3). The spin-dependent cross section for h+jet production in p+p collisions at = 200 GeV has been calculated perturbatively at NLO [31]. We utilize this NLO approach to calculate the spin-averaged h+jet and inclusive hadron cross sections, and their ratio.
This measurement reports charged-particle jets. Although charged-particle jets are not infrared-safe in perturbation theory, non-perturbative track functions have been defined that represent the energy fraction of a parton carried by charged tracks and that account for infrared divergences, enabling calculation of infrared-safe charged-jet observables [54]. PYTHIA-based calculations have been compared to such track functions and have similar evolution [54]. For comparison of these measurements to NLO pQCD calculations, we therefore utilize PYTHIA to transform perturbatively calculated distributions from the parton to the charged-particle level.

Figure 18 shows the distribution of (Eq. 4) for jets with = 0.4 in p+p collisions at = 200 GeV (Eq. 3, RHS). The NLO pQCD formalism in [31] is used for both the h+jet and inclusive hadron cross sections, with CTEQ6M parton distribution functions [55] and DSS fragmentation functions [56]. Variation of a factor 2 in the renormalization and factorization scales gives a variation in the ratio of 30%-40%, which represents the theoretical uncertainty. The figure also shows at the charged-particle level, obtained by transforming the NLO distribution of recoil jets to charged-particle jets using PYTHIA, in this case version 6.4.26, tune Perugia-0 [57].
At LO, the trigger hadron threshold of 9 sets a lower bound for of the recoil jet. The parton-level recoil jet distribution at NLO indeed exhibits a peak around = 9 , reflecting this kinematic constraint. However, yield at lower is also observed, indicating a contribution from higher-order processes. The peak is significantly reduced by the transformation from parton-level to charged-particle level, which both reduces and smears . We note that, in this calculation, each parton-level jet is transformed into only one particle-level jet. The transformation from parton-level to particle-level distributions based on PYTHIA therefore does not account for jet splitting, which may contribute at low and for small .
Comparison of these distributions to measurements is made in the following section.
XI Results
XI.1 Jet yield suppression


Figure 19, upper panels, show fully corrected distributions of for = 0.2, 0.3, 0.4 and 0.5, in peripheral and central Au+Au collisions at = 200 GeV. The lower panels show , the ratio of in central to peripheral distributions. The systematic uncertainty of takes into account the correlated uncertainties of numerator and denominator. The recoil jet yield in central collisions is strongly suppressed in the region for between 0.2 and 0.5, with less suppression for = 0.5 than for =0.2.
| System | Au+Au = 200 GeV | Pb+Pb = 2.76 TeV | |
|---|---|---|---|
| range () | [10,20] | [60,100] | |
| -shift of () | |||
| peripheralcentral | p+pcentral | ||
| 0.2 | |||
| 0.3 | |||
| 0.4 | |||
| 0.5 | |||
The upper panels also show distributions for p+p collisions at = 200 GeV, calculated by PYTHIA and by pQCD at NLO transformed to charged jets (Sect. X). The uncertainty of the NLO calculation (Fig. 18) is not shown, for visual clarity. The central value of the PYTHIA-generated distribution lies about 20% above the peripheral Au+Au distribution for all values of . The NLO-generated distribution lies yet higher for = 0.2, but agrees better with PYTHIA for = 0.5. A similar comparison was carried out for p+p collisions at = 7 TeV, with PYTHIA found to agree better than NLO with data [24].


Since the shape of the distributions is approximately exponential, for a range of in which is constant, suppression of can be expressed equivalently as a shift of in between the peripheral and central distributions. Tab. 3 gives values of the shift for the distributions in Fig. 19, together with the shift measured for = 0.5 between p+p and central Pb+Pb collisions at = 2.76 TeV. The peripheral-central shifts are consistent within uncertainties for the various in Au+Au collisions at = 200 GeV, and are systematically smaller than the p+p to central Pb+Pb shift measured at = 2.76 TeV.

In light of the low infrared cutoff of jet constituents in this analysis (track ), we interpret the shift as the charged-particle energy transported to angles larger than by interaction of the jet with the medium, averaged over the recoil jet population. In this interpretation, the spectrum shift represents the average out-of-cone partonic energy loss for central relative to peripheral collisions. Table 3 presents the first quantitative comparison of the quenching of reconstructed jets at RHIC and the LHC, indicating reduced medium-induced energy transport to large angles at RHIC, though the different ranges in and the different reference spectra (p+p vs. peripheral) should be noted.
XI.2 Modification of jet shape
The ratio of inclusive jet cross sections with small relative to large has been measured to be less than unity in p+p collisions at = 2.76 and 7 TeV [58, 59], reflecting the distribution of jet energy transverse to the jet axis. These measurements are well-described by pQCD calculations at NLO and NNLO [60, 61]. Inclusive measurements of small-radius jets are also well-described by an approach based on soft collinear effective theory [62]. The ratio of semi-inclusive recoil jet yields with small relative to large is likewise less than unity in p+p collisions at = 7 TeV [24], exhibiting sensitivity to the transverse distribution of jet energy in the recoil jet population. PYTHIA provides a better description than NLO of this ratio [24, 31]. A jet quenching calculation using a hybrid weak/strong-coupling approach indicates that the ratio of (semi-)inclusive yields with different values of has smaller theoretical uncertainties than other jet shape observables [27]. The -dependent ratios of inclusive jet cross sections and semi-inclusive jet yields therefore provide discriminating jet shape observables that can be calculated theoretically for p+p collisions, and that provide sensitive probes of medium-induced broadening of the jet shower. We note that this approach to measuring jet shapes is different than the differential jet shape observable employed by CMS to measure medium-induced modification of jet shapes in Pb+Pb collisions at =2.76 TeV [63].
Figure 20 shows distributions of for = 0.2 and 0.5, for peripheral and central Au+Au collisions at = 200 GeV. Their ratio, shown in the lower panels, is less than unity, also reflecting the intra-jet distribution of energy transverse to the jet axis. Comparison of the distributions for peripheral and central collisions measures medium-induced broadening of the jet shower in an angular range between 0.2 and 0.5 rad of the recoil jet axis. For quantitative comparison, we again express the change in between = 0.2 and 0.5 as a horizontal shift of the spectra. In the range , the -shift in from = 0.2 to = 0.5 is in peripheral collisions and in central collisions, which are consistent within uncertainties. From this measurement we find no evidence of broadening of the jet shower due to jet quenching. A similar picture was obtained for Pb+Pb collisions at the LHC [24].
XI.3 Medium-induced acoplanarity
In this section we discuss the measurements of (Eq. 5), the azimuthal distribution of the recoil jet centroid relative to the axis of the trigger hadron. In p+p collisions, the azimuthal distribution of back-to-back di-jet pairs is peaked at , with initial-state and final-state radiative processes generating acoplanarity that broadens the distribution. In nuclear collisions, additional acoplanarity may be induced by jet interactions in hot QCD matter [28, 25, 64, 29, 27], with magnitude related to the jet transport parameter [64, 29, 27]. Acoplanarity from vacuum radiation grows with both jet energy and , so that low energy jets may have greatest sensitivity to [29, 27]. The dependence of acoplanarity may probe the distribution of both vacuum and medium-induced gluon radiation within the jet shower [29], and may also probe different quenching effects for initially narrow or wide jets [27].
Scattering of a jet off quasi-particles in the hot QCD medium is conjectured to dominate the azimuthal distribution at large angles from the trigger axis (QCD Molière scattering), with radiative processes and soft multiple scattering making smaller contributions in that region [28]. Measurement of jet acoplanarity at large angles can potentially discriminate between a medium with distinct quasi-particles and one that is effectively continuous at the length scale being probed by the scattering [28]. It is important to perform such large-angle scattering measurements over a large range of jet energy, which varies the length scale of the probe. Such measurements can only be carried out using reconstructed jets recoiling from a trigger object; observables based on the distribution of single recoil hadrons convolute the effects of intra-jet broadening and scattering of the parent, and cannot discriminate the two processes.
We note that the trigger hadron, with , most likely arises from fragmentation of a jet, but that the direction of such a trigger hadron and its parent jet centroid are not necessarily coincident. In order to quantify the difference, the correlation between the axis defined by jet centroid and the direction of the leading hadron in the jet was studied using PYTHIA-generated events for p+p collisions at = 200 GeV. The distribution of the angular difference between jet centroid and leading hadron has RMS = 10 mrad for hadrons with and jets with = 0.3. Since high- hadrons in Au+Au collisions are expected to bias towards jets that have lost relatively little energy due to quenching [16], we expect a similar correlation in central Au+Au collisions. The trigger hadron direction in this analysis therefore corresponds closely to the axis of the jet that generates it.
In order to measure the distribution of , the contribution of uncorrelated background must be removed from the raw distribution. As in the analysis, this correction is carried out by subtracting the scaled ME distribution from the SE distribution. However, to correct we utilize an ME scaling factor that is determined separately for each bin in , rather than applying (Tab. 1), which is the scale factor averaged over the range of the recoil acceptance for . This modified procedure is used because the ME scale factor depends upon the interplay between conservation of total jet number and the enhanced yield at large positive for the SE distribution relative to ME. At large angles to the trigger axis the SE enhancement is small, and the ME scale factor approaches unity in that region. By utilizing a -dependent scaling of the ME distribution we track this effect accurately, resulting in an accurate ME normalization for correction of uncorrelated background yield.
Figure 21 shows distributions for = 0.3 and measured in peripheral and central Au+Au collisions at = 200 GeV, compared to distributions for p+p collisions at = 200 GeV generated by PYTHIA. The data are the same as those in Figs. 10 and 11. The data are corrected for uncorrelated background yield using ME subtraction, but no correction is applied for instrumental response or uncorrelated background fluctuations. Rather, for comparison to data, the PYTHIA p+p distribution is used at the detector level, which incorporates the effects of instrumental response. In addition, for comparison to the central Au+Au data, the effects of uncorrelated background fluctuations are imposed by embedding the p+p events generated by PYTHIA at the detector level into Au+Au mixed events. These reference events based on PYTHIA are analysed in the same way as real data; in particular, the effect of correlated recoil jets on the calculation of is the same as that in real data analysis.
The top and middle panels of Figure 21 compare absolutely normalized distributions for Au+Au and p+p. The yield for the PYTHIA-generated p+p distribution in this region is significantly larger than that of the Au+Au data for both peripheral and central collisions, with larger difference for central collisions. This is in qualitative agreement with Fig. 19, though quantitative comparison is not possible because these data are not fully corrected.
For detailed comparison of the shape of the central peaks of the distributions, we scale the PYTHIA-generated p+p distributions to have the same integrated yield as the data in the range . The top panel of Figure 21 shows scaled p+p compared to peripheral Au+Au, which agree well. The bottom panel shows the scaled embedded p+p and central Au+Au distributions, indicating a slightly broader central peak in data. A recent calculation suggests that such comparisons may be used to constrain , where is the jet transport parameter and is the in-medium path length [29]. However, quantitative comparison of such measurements and calculations requires correction of the data for instrumental and background fluctuation effects, which requires higher statistical precision than the data presented here and is beyond the scope of the current analysis.
Finally, we turn to the search for large-angle Molière scattering in the hot QCD medium [28]. Absolutely normalized distributions are required for this measurement. We focus on the distribution at large angles relative to the trigger axis, in the range . Fig. 21, upper panel, shows no significant yield in this range for both peripheral Au+Au events and PYTHIA-generated p+p events. The insert in the middle panel shows the distribution in this range for central Au+Au collisions and PYTHIA-generated p+p events embedded into central Au+Au mixed events. Both distributions have non-zero yield and are consistent with each other within the uncertainty band. We therefore do not observe significant evidence for large-angle Molière scattering in central Au+Au collisions. A similar measurement by the ALICE Collaboration for Pb+Pb collisions at = 2.76 TeV likewise found no evidence for large-angle Molière scattering in nuclear collisions at the LHC [24].
The comparison of central Au+Au and embedded p+p distributions can however be used to establish a limit on the magnitude of large-angle scattering, under two assumptions. The first assumption is that PYTHIA provides an accurate reference distribution. The second assumption, which we make for simplicity, is that the distribution of excess yield from large angle scattering is a constant fraction of the p+p reference yield, independent of for . We then form the ratio of the central Au+Au yield over that for PYTHIA-generated and embedded p+p collisions. No scaling of the p+p distribution is applied, since this measurement requires absolutely normalized distributions. This ratio is indeed independent of within uncertainties, consistent with the second assumption. Averaged over the eight data points shown in the inset of Fig. 21, the ratio is measured to be . In order to express this measurement as a limit, we consider only the statistical error to be Gaussian-distributed, and cite the systematic uncertainty separately. At 90% statistical confidence level (one-sided), the excess yield due to medium-induced large angle scattering is less than of the large-angle yield for p+p collisions predicted by PYTHIA.
Future measurements, based on larger Au+Au data sets, will reduce the statistical error and systematic uncertainty of this measurement. The two assumptions used in the analysis can be relaxed by measurement of the reference distribution in p+p collisions, and by theoretical calculations of the expected distribution.
XII Summary
We have reported the measurement of jet quenching in peripheral and central Au+Au collisions at = 200 GeV, based on the semi-inclusive distribution of reconstructed charged jets recoiling from a high- trigger hadron. Jets were reconstructed with low infrared cutoff of constituents, . Uncorrelated background was corrected at the level of ensemble-averaged distributions using a new event-mixing method. Comparison is made to similar distributions for p+p collisions at = 200 GeV, calculated using PYTHIA and NLO pQCD, and to similar measurements for Pb+Pb collisions at = 2.76 TeV.
The recoil jet yield is suppressed in central Au+Au collisions for jet radii between 0.2 and 0.5. Taking into account the low IR-cutoff for jet constituents, the suppression corresponds to medium-induced energy transport to large angles relative to the jet axis of , smaller than that measured for central Pb+Pb collisions at the LHC. Comparison of recoil jet yields for different exhibits no evidence of significant intra-jet broadening within an angle of 0.5 relative to the jet axis.
Yield excess in the tail of the recoil jet azimuthal distribution would indicate large-angle jet scattering in the medium, which could probe its quasi-particle nature. However, no evidence for such a process is seen within the current experimental precision. The 90% statistical confidence upper limit from this measurement for the excess jet yield at large deflection angles is of the large-angle yield in PYTHIA-generated p+p events. This is the first quantitative limit on large-angle Molière scattering of jets in heavy ion collisions at RHIC.
Future measurements, based on data sets with high integrated luminosity and incorporating the STAR electromagnetic calorimeter, will explore these observables with greater statistical and systematic precision and with greater kinematic reach, providing further quantification of jet quenching effects and clarification of their underlying mechanisms.
XIII Acknowledgments
We thank the RHIC Operations Group and RCF at BNL, the NERSC Center at LBNL, and the Open Science Grid consortium for providing resources and support. This work was supported in part by the Office of Nuclear Physics within the U.S. DOE Office of Science, the U.S. National Science Foundation, the Ministry of Education and Science of the Russian Federation, National Natural Science Foundation of China, Chinese Academy of Science, the Ministry of Science and Technology of China and the Chinese Ministry of Education, the National Research Foundation of Korea, GA and MSMT of the Czech Republic, Department of Atomic Energy and Department of Science and Technology of the Government of India; the National Science Centre of Poland, National Research Foundation, the Ministry of Science, Education and Sports of the Republic of Croatia, RosAtom of Russia and German Bundesministerium fur Bildung, Wissenschaft, Forschung and Technologie (BMBF) and the Helmholtz Association.
References
- [1] A. Majumder and M. Van Leeuwen, Prog.Part.Nucl.Phys. 66, 41 (2011), arXiv:1002.2206.
- [2] A. Adare et al., PHENIX, Phys.Rev.Lett. 104, 252301 (2010), arXiv:1002.1077.
- [3] C. Adler et al., STAR, Phys.Rev.Lett. 89, 202301 (2002), arXiv:nucl-ex/0206011.
- [4] C. Adler et al., STAR, Phys.Rev.Lett. 90, 082302 (2003), arXiv:nucl-ex/0210033.
- [5] J. Adams et al., STAR, Phys.Rev.Lett. 91, 172302 (2003), arXiv:nucl-ex/0305015.
- [6] J. Adams et al., STAR, Phys. Rev. Lett. 97, 162301 (2006), arXiv:nucl-ex/0604018.
- [7] L. Adamczyk et al., STAR, Phys.Rev.Lett. 112, 122301 (2014), arXiv:1302.6184.
- [8] K. Adcox et al., PHENIX, Phys.Rev.Lett. 88, 022301 (2002), arXiv:nucl-ex/0109003.
- [9] A. Adare et al., PHENIX, Phys.Rev. C87, 034911 (2013), arXiv:1208.2254.
- [10] A. Adare et al., PHENIX, Phys.Rev.Lett. 111, 032301 (2013), arXiv:1212.3323.
- [11] B. Abelev et al., ALICE, Phys.Lett. B720, 52 (2013), arXiv:1208.2711.
- [12] S. Chatrchyan et al., CMS, Eur.Phys.J. C72, 1945 (2012), arXiv:1202.2554.
- [13] K. Aamodt et al., ALICE, Phys.Rev.Lett. 108, 092301 (2012), arXiv:1110.0121.
- [14] S. Chatrchyan et al., CMS, Eur.Phys.J. C72, 2012 (2012), arXiv:1201.3158.
- [15] K. M. Burke et al., Phys.Rev. C90, 014909 (2014), arXiv:1312.5003.
- [16] R. Baier, Nucl.Phys. A715, 209 (2003), arXiv:hep-ph/0209038.
- [17] B. Abelev et al., ALICE, JHEP 03, 013 (2014), arXiv:1311.0633.
- [18] G. Aad et al., ATLAS, Phys. Rev. Lett. 114, 072302 (2015), arXiv:1411.2357.
- [19] J. Adam et al., ALICE, Phys.Lett B746, 1 (2015), arXiv:1502.01689.
- [20] V. Khachatryan et al., CMS, Submitted to: Phys. Rev. C (2016), arXiv:1609.05383.
- [21] G. Aad et al., ATLAS, Phys.Rev.Lett. 105, 252303 (2010), arXiv:1011.6182.
- [22] S. Chatrchyan et al., CMS, Phys.Lett. B712, 176 (2012), arXiv:1202.5022.
- [23] S. Chatrchyan et al., CMS, Phys.Lett. B718, 773 (2013), arXiv:1205.0206.
- [24] J. Adam et al., ALICE, JHEP 09, 170 (2015), arXiv:1506.03984.
- [25] X.-N. Wang and Y. Zhu, Phys.Rev.Lett. 111, 062301 (2013), arXiv:1302.5874.
- [26] A. Kurkela and U. A. Wiedemann, Phys. Lett. B740, 172 (2015), arXiv:1407.0293.
- [27] J. Casalderrey-Solana, D. Gulhan, G. Milhano, D. Pablos, and K. Rajagopal, (2016), arXiv:1609.05842.
- [28] F. D’Eramo, M. Lekaveckas, H. Liu, and K. Rajagopal, JHEP 05, 031 (2013), arXiv:1211.1922.
- [29] L. Chen, G.-Y. Qin, S.-Y. Wei, B.-W. Xiao, and H.-Z. Zhang, (2016), arXiv:1607.01932.
- [30] T. Sjöstrand, S. Mrenna, and P. Z. Skands, JHEP 05, 026 (2006), arXiv:hep-ph/0603175.
- [31] D. de Florian, Phys.Rev. D79, 114014 (2009), arXiv:0904.4402.
- [32] K. H. Ackermann et al., STAR, Nucl. Instrum. Meth. A499, 624 (2003).
- [33] W. J. Llope et al., Nucl. Instrum. Meth. A522, 252 (2004), arXiv:nucl-ex/0308022.
- [34] M. Anderson et al., Nucl. Instrum. Meth. A499, 659 (2003), arXiv:nucl-ex/0301015.
- [35] M. M. Aggarwal et al., STAR, Phys. Rev. Lett. 106, 062002 (2011), arXiv:1009.0326.
- [36] M. L. Miller, K. Reygers, S. J. Sanders, and P. Steinberg, Ann.Rev.Nucl.Part.Sci. 57, 205 (2007), arXiv:nucl-ex/0701025.
- [37] R. Brun, F. Bruyant, M. Maire, A.C. McPherson, and P. Zanarini, CERN Data Handling Division DD/EE/84-1 (1985).
- [38] M. Cacciari, G. P. Salam, and G. Soyez, Eur.Phys.J. C72, 1896 (2012), arXiv:1111.6097.
- [39] M. Cacciari, G. P. Salam, and G. Soyez, JHEP 04, 063 (2008), arXiv:0802.1189.
- [40] M. Cacciari, G. P. Salam, and G. Soyez, JHEP 04, 005 (2008), arXiv:0802.1188.
- [41] M. Cacciari and G. P. Salam, Phys. Lett. B659, 119 (2008), arXiv:0707.1378.
- [42] G. Cowan, Conf.Proc. C0203181, 248 (2002).
- [43] A. Höcker and V. Kartvelishvili, Nucl.Instrum.Meth. A372, 469 (1996), arXiv:hep-ph/9509307.
- [44] G. de Barros, B. Fenton-Olsen, P. Jacobs, and M. Ploskon, Nucl.Phys. A910-911, 314 (2013), arXiv:1208.1518.
- [45] D. de Florian and W. Vogelsang, Phys.Rev. D71, 114004 (2005), arXiv:hep-ph/0501258.
- [46] D. d’Enterria, K. J. Eskola, I. Helenius, and H. Paukkunen, Nucl.Phys. B883, 615 (2014), arXiv:1311.1415.
- [47] T. Renk, H. Holopainen, R. Paatelainen, and K. J. Eskola, Phys.Rev. C84, 014906 (2011), arXiv:1103.5308.
- [48] N. Armesto, L. Cunqueiro, C. A. Salgado, and W.-C. Xiang, JHEP 02, 048 (2008), arXiv:0710.3073.
- [49] N.-B. Chang, W.-T. Deng, and X.-N. Wang, Phys.Rev. C89, 034911 (2014), arXiv:1401.5109.
- [50] L. Adamczyk et al., STAR, Phys. Rev. C88, 014902 (2013), arXiv:1301.2348.
- [51] A. Adare et al., PHENIX, Phys. Rev. C92, 034913 (2015), arXiv:1412.1043.
- [52] G. de Barros, AIP Conf.Proc. 1441, 825 (2012), arXiv:1109.4386.
- [53] G. D’Agostini, Nucl.Instrum.Meth. A362, 487 (1995).
- [54] H.-M. Chang, M. Procura, J. Thaler, and W. J. Waalewijn, Phys.Rev.Lett. 111, 102002 (2013), arXiv:1303.6637.
- [55] J. Pumplin et al., JHEP 07, 012 (2002), arXiv:hep-ph/0201195.
- [56] D. de Florian, R. Sassot, and M. Stratmann, Phys. Rev. D76, 074033 (2007), arXiv:0707.1506.
- [57] P. Z. Skands, Phys.Rev. D82, 074018 (2010), arXiv:1005.3457.
- [58] B. Abelev et al., ALICE, Phys.Lett. B722, 262 (2013), arXiv:1301.3475.
- [59] S. Chatrchyan et al., CMS, Phys. Rev. D90, 072006 (2014), arXiv:1406.0324.
- [60] G. Soyez, Phys.Lett. B698, 59 (2011), arXiv:1101.2665.
- [61] M. Dasgupta, F. A. Dreyer, G. P. Salam, and G. Soyez, JHEP 06, 057 (2016), arXiv:1602.01110.
- [62] Z.-B. Kang, F. Ringer, and I. Vitev, (2017), arXiv:1701.05839.
- [63] S. Chatrchyan et al., CMS, Phys.Lett. B730, 243 (2014), arXiv:1310.0878.
- [64] A. H. Mueller, B. Wu, B.-W. Xiao, and F. Yuan, Phys. Lett. B763, 208 (2016), arXiv:1604.04250.