Universality in quasi-2D granular shock fronts above an intruder
Abstract
We experimentally study quasi-2d dilute granular flow around intruders whose shape, size and relative impact speed are systematically varied. Direct measurement of the flow field reveals that three in-principle independent measurements of the non-uniformity of the flow field are in fact all linearly related: 1) granular temperature, 2) flow field divergence and 3) shear-strain rate. The shock front is defined as the local maxima in each of these measurements. The shape of the shock front is well described by an inverted catenary and is driven by the formation of a dynamic arch during steady flow. We find universality in the functional form of the shock front within the range of experimental values probed. Changing the intruder size, concavity and impact speed only results in a scaling and shifting of the shock front. We independently measure the horizontal lift force on the intruder and find that it can be understood as a result of the interplay between the shock profile and the intruder shape.
Lift forces [1, 2, 3, 4] on and shock formation [5, 6, 7] around intruders in granular flows are well known phenomena. Rericha et al. [6] and Boudet et al. [8, 9] have demonstrated that shocks analogous to those in fluid flows are formed around symmetrical intruders in dilute granular flows. Numerical studies by Potiguar [3] have shown that in the case of asymmetrical intruders the drag-induced lift forces are lower than expected due to the formation of shock waves that act as a shield. However, the relationship between the granular shock front and lift (forces perpendicular to the direction of flow) on an intruder has not been studied in detail.

In this letter we systematically vary the shape of an intruder in a dilute granular flow and measure the resulting grain flow fields and lift forces. We find that the position of the shock front is well-described by each of the coordinates of the local maxima of granular temperature, divergence, and local shear-strain rate, which are all found to be linearly related. The shock front maintains a symmetric shape and its center point closely tracks the center of mass of the intruder. We find that the asymmetry of the intruder alters the shock boundary and this in turn alters the lift force on the intruder. We propose a model for calculating lift forces which agrees with experimental data. We demonstrate that the force in the direction perpendicular to flow is the result of three mechanisms: 1) static loading from the dead zone above the intruder, 2) impact forces from the freely falling grains hitting the shock front, and 3) net momentum transfer due to mass ejection from the dead zone.
Our experimental setup consists of a rectangular quasi-2D granular hopper that is 1.25 cm deep, 55.8 cm wide, and 90 cm in height. The hopper is constructed from 1/4 inch acrylic as shown in Figure 1a. The front of the hopper is clear and the back is opaque to allow for quantitative imaging of the flow. The hopper is fed by a reservoir of 3 mm glass beads (Mo-Sci Corp) to provide a steady flow rate of approximately 400 particles cm-2s-1. A laser-cut acrylic intruder is placed inside the hopper and is constructed to be 1.1 cm thick, slightly thinner than the hopper cavity to prevent frictional contact with the front and back walls. The intruder is typically mounted at =57 cm below the reservoir, where the bead velocity in the absence of the intruder would be =3.3 m/s, comparable to the flow speeds in [6, 7, 10]. Changing corresponds to changing the impact speed of the grains; .
Figure 1b shows the intruder-sensor system. The intruder is connected to one end of a 30 cm aluminum rod. The other end of the rod is held in place by a force sensor to measure lateral forces (Measurement Specialties FC22) and a pre-load which is subtracted from the measurements. This is fixed to a second rod to form a T-shaped structure which is held by low friction bearings.
The intruder shape is defined as the first quadrant of the superdisk equation [11]
| (1) |
where and are the horizontal and vertical coordinates. The exponent controls the concavity/symmetry of the shape as illustrated by the six shapes in Figure 1c. The superdisk equation provides a family of shapes interpolating from the asymmetric “L” at to a triangle at , a quarter circle at and a square at . Unless otherwise specified the length of the straight edge is held constant at 4 inches.
At the beginning of each measurement the bottom of the hopper is blocked off and it is filled with beads. When the beads are released the force sensor and a high-speed camera (Phantom M310) start recording. We ignore the initial transient (approximately 0-4 seconds) when beads begin to flow and keep only the measurements taken in steady state - when the flow rate is roughly constant. After about 10 seconds the reservoir is depleted.
For each value we measure lateral forces on, and granular flow field around the intruder. Bead velocities are calculated using particle image velocimetry [12]. In agreement with previous studies [13, 14, 15, 8, 16, 17] in steady state flow we observe a nearly stationary, densely packed pile of beads with a shock front above the leading edge of the intruder. This shock front can be identified by three different measurements - the local maxima of granular temperature , flow divergence , and shear strain rate :
| (2) | ||||
| (3) | ||||
| (4) |
where is the velocity at any given point. Angled brackets denote time averages and and are eigenvalues of the strain rate tensor , following the method described by Clark et al. [10].
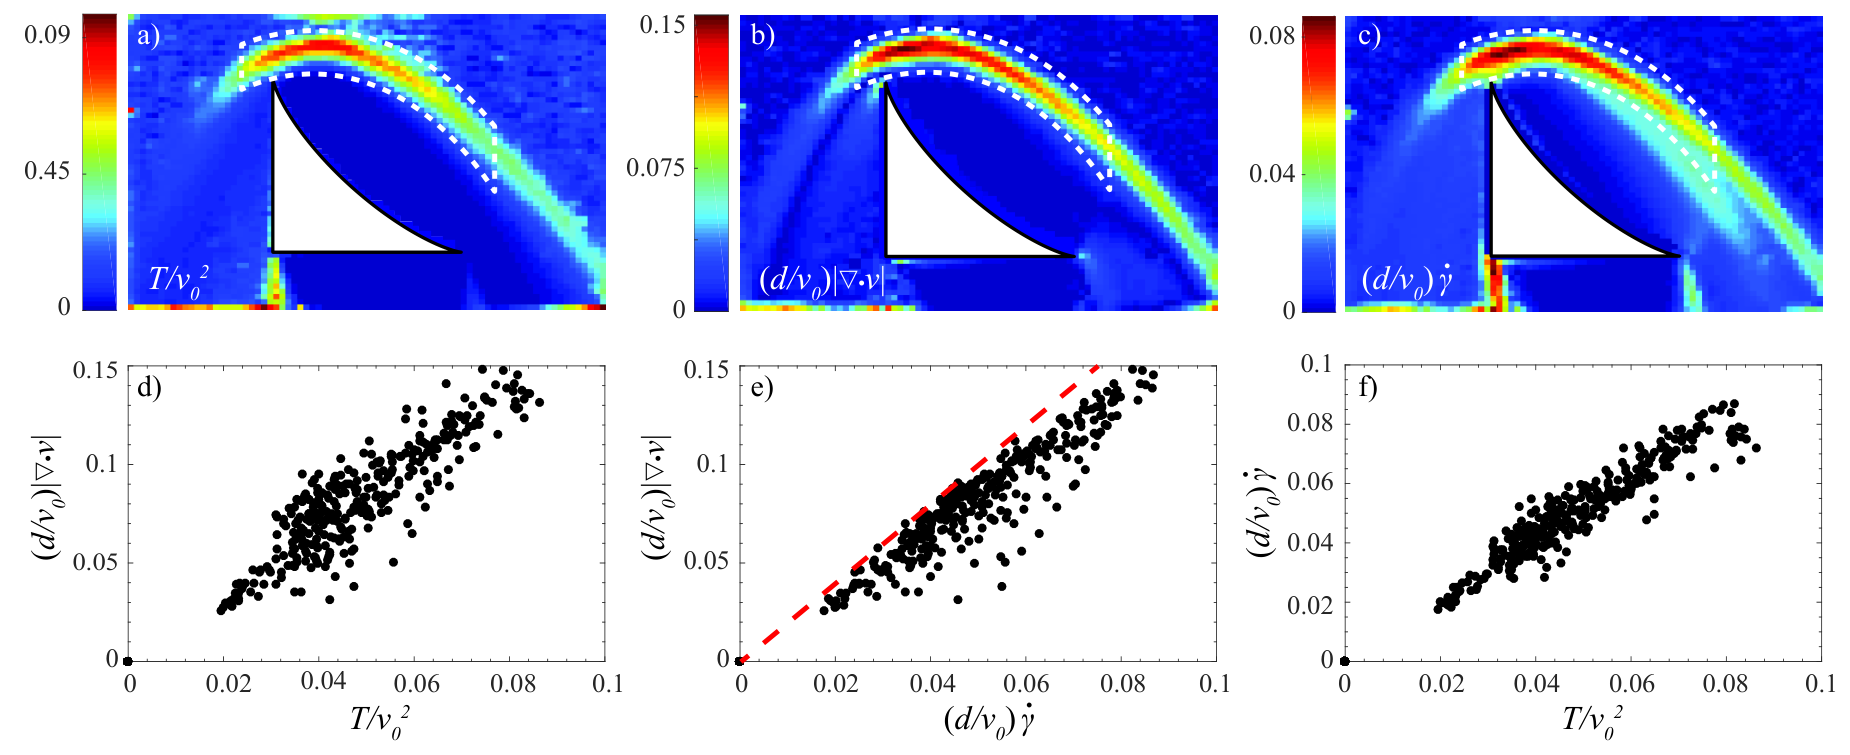
For all values of , these three tests pick out the same feature above the intruder. They are shown for a representative intruder with in Figure 2a-c. These quantities are all close to zero everywhere else in the flow field. By picking out only the points inside the same dotted regions in Figures 2a-c, we plot divergence versus temperature, divergence versus shear rate and shear rate versus temperature in Figures 2d-f respectively. We non-dimensionalize these quantities by scaling them as , , and , where is the theoretical free-fall speed of beads at the intruder’s center of mass and is the bead diameter. In Figure 2e the red dotted line corresponds to a slope of 2. Since and where and are eigenvalues of the shear strain tensor, 2e shows that . The points in the scatter plot fall below the slope line (red dotted line in Figure 2e) showing that .
The non-zero divergence band is a region of high compressibility - grains suddenly decelerate upon impact and some get absorbed into the quasi-static pile on the intruder. The same band also displays high variance in the velocity field due to sudden grain-grain collisions and consequent velocity changes. The linear relationship between the three measured quantities are unexpected and remain to be studied further in a future study.
Figure 3a shows the extracted shock front for intruders of varying . The plots show that the shock front maintains the same functional form as the intruder geometry is varied, with the curves shifting right and increasing in peak height with increasing . For any given obstacle shape we find that the volume of trapped beads remains constant. Volume fluctuations are low so we assume a system with negligible dilatancy and bounded by a shock front that prefers to maintain a shape dictated by force constraints.
During steady-state flow the shock front must remain stable. Any vertical or horizontal net force will result in a time variant shock front. To enforce stability of the arch-like shock front given the constraints of gravity the net force must be tangential to the surface of the shock as illustrated by the green arrow in Figure 4a (inset). This net force ensures that particles not absorbed by the quasi-static pile are cleared away from it such that the shock front remains stable. The ejection of particles from the left and right, illustrated by purple arrows in Figure 4a (inset), also ensure a stable shock position during steady flow.
Force balance also implies that the th particle in the quasi-static layer is held in place at an angle of repose such that , where is coefficient of friction and is a friction mobilization factor at the th location. Thus .
We define as the arc length spanning the horiontal distance , the particle diameter. For a convex shock profile the ratio is an approximate measure of . A higher ratio implies more friction mobilized to constrain the particle. When the tangent to is horizontal, and . To enforce this condition we assume that to first order . In the discrete limit, for some constant of proportionality ,
| (5) |
In the continuum limit, taking the -derivative on both sides of Equation 5:
| (6) |
Equation 6 has the solution
| (7) |
Equation 7 is an inverted catenary where is the characteristic width of the hyperbolic cosine curve, sets the center of the curve, and is the vertical offset such that . Surprisingly this description of the shock front has the same solution as the shape of an arch in a jammed pipe [18].
The measured shock fronts are well fit by Equation 7 as demonstrated by the dark lines on Figure 3a. Thus we find that in steady granular flow the shock front (ignoring temporal fluctuations) is a dynamic arch. By scaling out the fit parameters we find excellent collapse onto a single master curve, as demonstrated in figure 3b. This indicates that the influence of the intruder shape is limited to changing the centerpoint and height of the resulting shock wave.
To test the effect of intruder size, , for a super-disk exponent we measured several combinations of varying and height . Figure 3b includes measurements for all probed values of and all tested combinations for . This provides strong evidence for the universality of the shape of the shock front; varying any of the parameters, intruder shape , intruder size and impact or incident grain velocity , does not change the shape of the shock front. Finally, we created an intruder with no obvious symmetry (shown in Figure 2 of the Supplement) and found that its shock front, plotted as diamonds in Figure 3b, also collapses to the same master curve.

We obtain the constants , and as fit parameters to Equation 7 and plot them as functions of in Figure 3c, where red circles represent data for varying and blue squares represent data for different combinations for . The plot of width versus demonstrates that the scaled width of the catenary is independent of the shape parameter and the dotted line denotes the mean value of the curve width. The plot of center versus agrees with the qualitative observation from Figure 3a - the peaks shift away from the vertical edge as goes from . The center naturally asymptotes to for as the shape of the intruder approaches a symmetric square. We find that roughly tracks the intruder center of mass (black solid curve). Plotting , which is the peak height , as a function of demonstrates that the peaks shift upwards with increasing . Thus, we find that the intruder shape parameter controls the catenary center and peak.
The shape of the catenary affects how grains are distributed on the intruder and thus, in turn, determines the lift forces . We show this by directly measuring , the lift force perpendicular to the direction of flow, on the intruder. The measured lift as a function of is plotted as green circles in Figure 4a. The lift is maximum for , and decreases with increasing and asymptotes to as , in which case the intruder is perfectly symmetric. As detailed in the supplement we can model this lift force by considering three contributions: 1) the static load from the quasi-static pile, 2) the momentum flux from freely falling particles hitting the shock front and 3) momentum transfer from particles ejected from either side of the quasi-static pile.
The first contribution is from the horizontal component of the static load pushing on the curved upper surface of the intruder. For all intruder shapes there is a trapped pile whose upper boundary is the shock front, which we can approximate as a static load. Because this load is resting on a curved, asymmetric surface it will impart a non-zero horizontal component , which is calculated explicitly in the supplement. In the limiting cases or this contribution goes to zero.
The second force contribution is from the momentum flux of freely falling particles impacting the shock front. This force, is equal to the incident mass per unit time perpendicular to the shock front multiplied by the velocity change in the horizontal direction. The incident velocities along the shock front are taken from PIV measurements, a representative plot of which is shown for in Figure 4 of the Supplement.
The third force contribution is from grains being ejected from the area between the shock front and the intruder profile. These grains are measured to leave with average speeds and illustrated by purple arrows in Figure 4a inset. Since we keep the width of the hopper constant the scaled heights and , distances from the intruder to the shock front at (red circles) and (blue circles) respectively, are measures of the exit areas. The distances are plotted as functions of in Figure 4b and are scaled by the intruder size as before. We find that the difference in the two exit areas () decreases with increasing and becomes equal at . This implies that for equal exit velocities more grains can escape from the exit area at , which in turn means greater momentum flux at this edge.
The mean exit velocities at (red circles) and (blue circles) obtained from PIV measurements are plotted in Figure 4c and we find that the speeds are roughly the same and nearly equal for . Thus, for asymmetrical intruders the disparity in granular exit areas becomes the dominating factor. At smaller , as the shape becomes more concave and asymmetric, the momentum flux on the right at is greater so is higher. For larger values of the two areas and speeds are comparable so net momentum flux, approaches zero for .
Our approach to calculating lift is similar to the granular resistive force theory technique (GRFT) pioneered by Zhang and Goldman [19] and further explained by Askari and Kamrin [20]. While GRFT has been effective in predicting and modeling dynamics in friction-dominated granular systems [21] Zhang and Goldman conclude that GRFT may not be applicable when inertial forces dominate [19]. Our results demonstrate this is indeed the case in such systems; the inertial forces cannot be ignored when computing net lift for instance. In dilute granular flows further complications arise due to the separation of grains into a solid-like and fluid-like region.
This experiment reveals that in the region near the granular shock front the mean flow field variance, absolute flow field divergence and shear strain rate are linearly related to each other. The local maxima in each of these measurements provide a robust means of identifying the shock front. The shock front is characterized by a universal functional form that is, unlike the fluid flow analog, invariant with respect to intruder size, shape and impact speeds within probed experimental values. To enforce stability given the constraints of gravity and granular impact forces there must always be a tangential force along the shock front. This leads to an appropriate organization of quasi-static grains around the intruder such that the effective shape becomes arch-like and well described by an inverted catenary. The catenary center lines () roughly track the intruders’ centers of mass (). The two lines begin to converge as the intruder approaches a more symmetrical shape. Variation in intruder geometry results in scaling and shifting of the catenary and this determines the lift force on the intruder. We also demonstrate that the mechanism for lift in dilute granular flows consists of at least three processes rather than just collisional forces as might be naively expected.
In dilute flows, the quasi-static granular pack is analogous to a hydrodynamic radius and determines the effective shape of an intruding object. The existence of several measurements to identify the shock boundary and universality in its shape should pave the way for a better understanding of boundary conditions and more refined applications of Navier-Stokes-like continuum models to dilute granular flows. Our work also presents avenues for future exploration of drag forces on intruder shape, size and impact speeds. This future work would further detail the extent to which granular lift is drag-induced.
References
- [1] R. Soller and S. A. Koehler, Phys. Rev. E 74, 021305 (2006).
- [2] Y. Ding, N. Gravish, and D. I. Goldman, Phys. Rev. Lett. 106, 028001 (2011).
- [3] F. Q. Potiguar, Phys. Rev. E 84, 061302 (2011).
- [4] F. Q. Potiguar and Y. Ding, Phys. Rev. E 88, 012204 (2013).
- [5] P. K. Haff, Journal of Fluid Mechanics 134, 401 (1983).
- [6] E. C. Rericha, C. Bizon, M. D. Shattuck, and H. L. Swinney, Phys. Rev. Lett. 88, 014302 (2001).
- [7] Y. Amarouchene and H. Kellay, Physics of Fluids (1994-present) 18, 031707 (2006).
- [8] J. F. Boudet, Y. Amarouchene, and H. Kellay, Phys. Rev. Lett. 101, 254503 (2008).
- [9] J. F. Boudet and H. Kellay, Phys. Rev. Lett. 105, 104501 (2010).
- [10] A. H. Clark, L. Kondic, and R. P. Behringer, Phys. Rev. E 93, 050901 (2016).
- [11] Y. Jiao, F. H. Stillinger, and S. Torquato, Phys. Rev. E 79, 041309 (2009).
- [12] W. Thielicke and E. Stamhuis, Journal of Open Research Software 2 (2014), 10.5334/jors.bl.
- [13] Y. Amarouchene, J. F. Boudet, and H. Kellay, Phys. Rev. Lett. 86, 4286 (2001).
- [14] C. R. Wassgren, J. A. Cordova, R. Zenit, and A. Karion, Physics of Fluids (1994-present) 15, 3318 (2003).
- [15] P. Knoll, S. Mirzaei, and H. Köhn, Applied Mathematics and Computation 190, 1747 (2007).
- [16] J. K. Meyer and R. L. Merlino, Physics of Plasmas (1994-present) 20, 074501 (2013).
- [17] A. Vilquin, J. F. Boudet, and H. Kellay, Phys. Rev. E 94, 022905 (2016).
- [18] C. C. Mounfield and S. F. Edwards, Physica A: Statistical Mechanics and its Applications 226, 12 (1996).
- [19] T. Zhang and D. I. Goldman, Physics of Fluids 26, 101308 (2014), http://dx.doi.org/10.1063/1.4898629 .
- [20] H. Askari and K. Kamrin, Nat Mater 15, 1274 (2016).
- [21] J. Aguilar, T. Zhang, F. Qian, M. Kingsbury, B. McInroe, N. Mazouchova, C. Li, R. Maladen, C. Gong, M. Travers, R. L. Hatton, H. Choset, P. B. Umbanhowar, and D. I. Goldman, Reports on Progress in Physics 79, 110001 (2016).