-decay half-lives and -delayed neutron emission probabilities for several isotopes of Au, Hg, Tl, Pb and Bi, beyond N=126
Abstract
Background: Previous measurements of -delayed neutron emitters comprise around 230 nuclei, spanning from the 8He up to 150La. Apart from 210Tl, with a minuscule branching ratio of 0.007%, no other neutron emitter is measured yet beyond . Therefore new data are needed, particularly in the heavy mass region around N=126, in order to guide theoretical models and to understand the formation of the third r-process peak at .
Purpose: To measure both, -decay half-lives and neutron branching ratios of several neutron-rich Au, Hg, Tl, Pb and Bi isotopes beyond .
Method: Ions of interest are produced by fragmentation of a 238U beam, selected and identified via the GSI-FRS fragment separator. A stack of segmented silicon detectors (SIMBA) is used to measure ion-implants and -decays. An array of 30 3He tubes embedded in a polyethylene matrix (BELEN) is used to detect neutrons with high efficiency and selectivity. A self-triggered digital system is employed to acquire data and to enable time-correlations. The latter are analyzed with an analytical model and results for the half-lives and neutron-branching ratios are derived using the binned Maximum-Likelihood method.
Results: Twenty new -decay half-lives are reported for 204-206Au, 208-211Hg,211-216Tl,215-218Pb and 218-220Bi, nine of them for the first time. Neutron emission probabilities are reported for 210,211Hg and 211-216Tl.
Conclusions: The new -decay half-lives are in good agreement with previous measurements in this region. The measured neutron emission probabilities are comparable or smaller than values predicted by global models like RHB+RQRPA.
Keywords:
-delayed neutron emission, -decay half-life, -process, nucleosynthesis, nuclear structure, neutron detector.pacs
27.80.+w, 23.40.−s, 26.30.-k,21.10.-kI Introduction
Very neutron-rich nuclei may emit one or more neutrons when they disintegrate via decay. This is the so-called -delayed neutron () emission process, which is energetically allowed when the Qβ-value of the decay exceeds the neutron separation energy (Sn) of the daughter nucleus. The -emission has been experimentally determined for about 230 neutron rich nuclei, spanning from 8He up to 150La [1, 2]. Most of these measurements took advantage of the large fission yields around the two fission peaks at and . However, -delayed neutron emission has remained essentially inaccessible for nuclei heavier than , where only a minuscule value of 0.007% has been reported for the -emission probability of 210Tl [3, 4]. Because of the scarce or non-existent data in the heavy mass region, rapid neutron capture -process [5] calculations have to rely entirely on theoretical models [6, 7, 8]. However, the performance of such models for reproducing the features of the -decay in -process waiting-point nuclei has been tested with experimental data only in the two shell-closures at and in measurements such as reported in [9, 10, 11, 12, 13, 14, 15]. The comparison is much more limited in the region, where only half-lives in the neighborhood of the doubly magic 208Pb were available (see e.g. Ref. [16]).
The neutron-rich nuclei “south” of 208Pb are difficult to measure experimentally because of the very small production cross-sections and the large background conditions induced by the heavy primary beam. In the present work it was possible to produce and identify reliably secondary neutron-rich nuclei in the region “south-east” of 208Pb in the chart of nuclides thanks to the high-energy (1 GeV/u) 238U beams available at the GSI facility. Extended motivation and results for this experiment were recently published in [17]. Here we present more details on the experimental apparatus in Section II, the analysis methodology and results, which are reported in Section III and finally Sections IV and V summarize the main results and conclusions.
II Experimental setup and ion identification
The present measurements were carried out at the GSI Helmholtz Center for Heavy Ion Research. A 238U beam was accelerated to an energy of 1 GeV/u by the UNILAC linear accelerator coupled to the SIS 18 synchrotron. The average beam intensity was ions/spill, with a pulsed beam structure of 1 s spill duration (SIS extraction) and a repetition cycle of 4 s. The beam impinged onto a 9Be target with a thickness of 1.6 g/cm2 at the entrance of the Fragment Separator (FRS) [18]. The selection of the ions of interest, from this point to the detection system, was done with the -method using the FRS as an achromatic spectrometer. Neutron-rich nuclei “south-east” of 208Pb in the chart of nuclides were produced using two FRS settings centered on 211Hg and 215Tl. In order to minimize the number of ionic charge states of the secondary beam a Niobium layer with a thickness of 223 mg/cm2 was placed behind the Be-target. In addition, a homogeneous Al degrader with a thickness of 2.5 g/cm2 was placed at the first FRS focal plane (S1) in combination with thick Cu slits, which served to reduce the contribution of fission fragments and primary beam charge-states with initially similar magnetic rigidity () as the setting isotope. A wedge-shaped Al degrader with a thickness of 3874 mg/cm2 was employed as achromatic degrader at the intermediate focal plane (S2), (see Fig. 1).

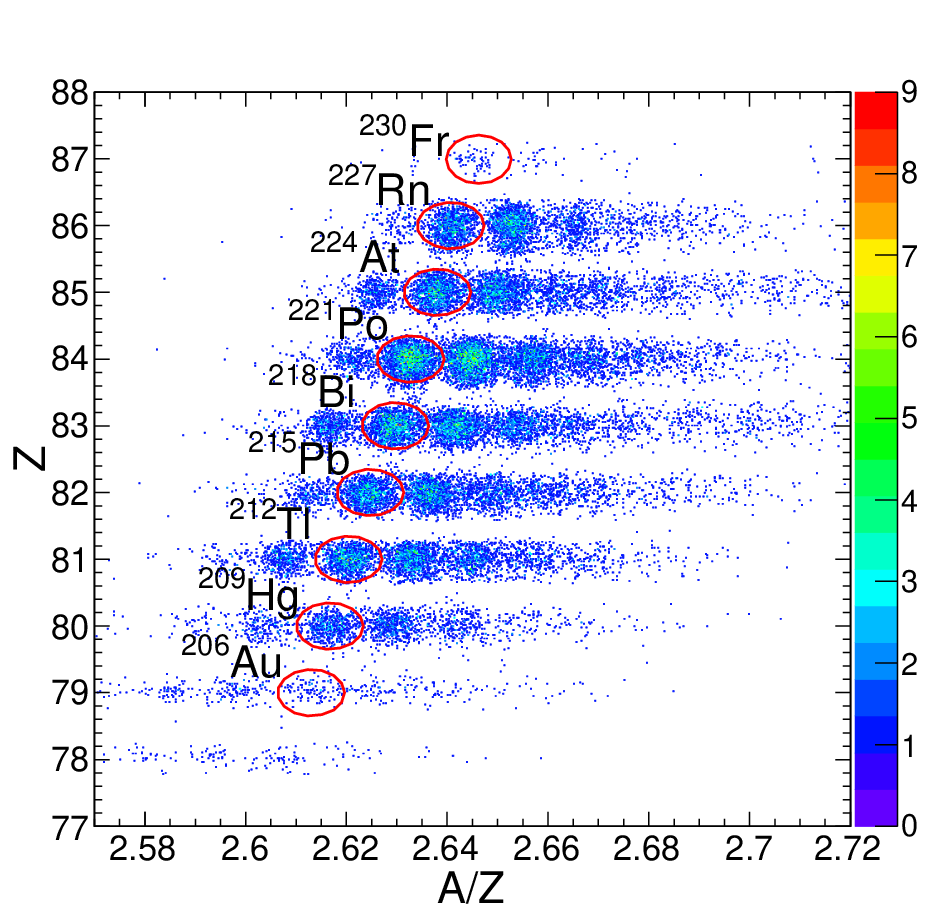
Ion species were identified by means of standard FRS tracking detectors. Two plastic scintillators located at S2 and at the final focal plane (S4) were used to measure the time-of-flight () of the ions. Two systems of Time Projection Chambers (TPCs) [19] placed at S4 and S2 allowed us to determine accurate values for each ion by measuring their trajectory with respect to the central fragment. The measured in combination with the provided the necessary information to calculate the mass-to-charge ratio (A/q) on an event-by-event basis. The resolution thus obtained in A/q was 2.5 fwhm.
In order to determine the atomic number (), two fast MUltiple Sampling Ionization Chambers (MUSICs) [20] were placed in the S4 experimental area. Although the detected nuclei were mainly bare, H- and He-like charge states were also detected in MUSICs. The latter events were corrected by combining the information of the two MUSICs and calculating the energy loss in the S2 degrader following the method applied in previous studies in this mass region [21, 22, 23, 24]. In addition, it was needed to treat the gain fluctuations in the MUSIC detectors caused by the variations of the temperature in the experimental hall, and consequent changes in gas pressure, which were also corrected numerically [25]. The final resolution obtained in Z for the Pb-Bi region was of fwhm. Finally, the Z versus A/q particle identification diagram (PID) was experimentally validated with a dedicated run. 205Bi ions were implanted into a passive plastic stopper and the decay of well known isomeric transitions [26] were measured with HPGe detectors.
The PID obtained, including nuclei produced in both FRS settings with all the statistics accumulated during the experiment, is shown in Fig. 2. All identified nuclei were already reported from previous experiments [27, 28].
II.1 Implantation and decay detection system
The secondary beam of neutron-rich isotopes was focused at the final focal plane (S4) of the FRS. A third Al degrader with variable thickness was adjusted in order to slow down the ions of interest and to implant them into the central region of an active stopper named “Silicon IMplantation Beta Absorber” (SIMBA) [29, 30]. SIMBA enabled position and energy measurement of heavy charged ions as well as charged particles from and decays. The main difference between the SIMBA system employed here with respect to previous versions was the smaller number of Si detectors required to stop and implant the ions of the present experiment, which had a higher atomic number () than those measured in the past (, [29]). In addition, the geometry and overall size of SIMBA were also modified in order to optimize neutron detection (see below). The present SIMBA version consisted of a stack of nine highly segmented Si detectors (see Figs. 3 and 4).


The first two layers, called XY-tracking detectors, consisted of single-sided Si-strip detectors (SSSD) with their strips in orthogonal orientation with respect to each other. They were used for determining accurately the ion position in the transversal plane of the beam. A center-of-gravity method applied to the charge shared over all the strips allowed us to determine the ion position with an accuracy of [32, 25], corresponding to one pixel in a silicon layer of SIMBA. The implant and decay sensitive region consisted of two SSSD layers (front absorbers), three double sided silicon stripped detectors (DSSSD) designated as implantation layers A, B and C, and two SSSD layers (rear absorbers). The energy deposited by the ions along these seven Si detectors was used to detect whether the ion was implanted or if it punched through, as well as to determine the corresponding implant layer or depth. The segmentation of the DSSSDs was 60-fold in X and 40-fold in Y direction, with a strip width of 1 mm. Fig. 5 shows the total amount of implanted ions for each isotope in the DSSSDs of SIMBA.

The energy deposited by decays in each Si-electrode showed, as expected, a continuum spectrum which extended up to 2-3 MeV. The energy deposited in the DSSSDs was determined from the response of the Y-strips, which were readout via logarithmic preamplifiers. The latter allowed to clearly separate the ion implants and decays in the spectrum (see Table 1 and Figs. 6a and 6b). A pulse generator was used to perform the gain-matching of the Y-strips. An accurate energy calibration of layers A and B was accomplished using well known decays from several At, Bi, Rn and Po isotopes produced in the decay of implanted Tl, Pb and Bi nuclei (see Figs. 6a and 6b). No emitter was implanted in the layer C and, therefore, a coarse energy calibration of the latter was made using only the broad spectrum (Fig. 6d). Nevertheless, for implant- time-correlations only an energy window covering the broad spectrum is required and, therefore, an accurate energy calibration is of secondary relevance for this data analysis.
| energy | SIMBA | emitter | Precursor |
| (keV) | layer | implanted | |
| 5304.3 | A, B | 210Po | (Implanted) |
| 5869.5 | A | 211At | (Implanted) |
| 6002.4 | A | 218Po | 218Bi, 218Pb |
| 6050.8 | A | 212Bi | 212Tl |
| 6208.0 | A | 219At | 219Bi |
| 6288.1 | A | 220Rn | 220Bi |
| 6300.0 | B | 212Bi | 212Tl |
| 6340.0 | B | 212Bi | 212Tl |
| 6537.0 | A | 217Po | 217Pb |
| 6622.9 | A | 211Bi | 211Tl |
| 6778.5 | A | 216Po | 216Pb |
| 7386.1 | A | 215Po | 215Pb |
| 7450.3 | A | 211Po | 211At |
| 7686.8 | A,B | 214Po | 214Pb, 214Tl |
| 8375.9 | A,B | 213Po | 213Tl |


SIMBA was placed inside the cylindrical hole (23 cm diameter) of the Beta dELayEd Neutron (BELEN) detector [33, 34, 35, 36]. BELEN consisted of an array of 30 3He-counters of 2.54 cm diameter, embedded in a high-density polyethylene (PE) matrix (Fig. 7).


The 3He tubes were distributed in two rings, an inner one with a radius of 14.5 cm and 10 tubes of 10 atm, and the outer ring with a radius of 18.5 cm and 20 tubes of 20 atm. This configuration was designed by means of Geant4 [37, 38] and MCNPX [39, 40, 41] Monte Carlo (MC) simulations in order to achieve a high and flat detection efficiency (see Fig. 8). Up to a neutron energy of 1 MeV the detection efficiency was 40(2)%, and it decreased to 25% at 5 MeV. The MC codes were experimentally validated at En=2.3 MeV with a dedicated measurement of a well calibrated 252Cf source.

The Qβn window of the exotic nuclei involved in the present measurement spans neutron energies up to 2.5 MeV (see Table 3). In this energy range, the average neutron detection efficiency is 38%; this value was used in the data analysis (see Sec. III). Using the calibrated 252Cf source a gain-matching of the response of all 30 counters was carried out before the experiment. The stability of the overall detector response was checked regularly during the experiment. The accumulated spectrum for all 30 tubes during the 211Hg setting is shown Fig. 9.

The energy window considered in the data analysis as neutron events comprises the range from a low threshold of the 191 keV peak up to the end of the main peak of the reaction (see Eq. 1) at 765 keV. This peak corresponds to the kinetic energy realized by the two reaction products, a triton and a proton.
| (1) |
In order to reduce the neutron background in BELEN two additional elements were implemented in the setup. On one hand, a PE wall with a thickness of 30 cm was installed upstream from BELEN in order to shield the detector from neutron background induced by the secondary beam (see Fig. 7). This wall had a central hole of 180 mm in -direction and 70 mm in -direction to let the beam into SIMBA. In addition, a layer of borated rubber was attached to the back side of the PE wall in order to absorb thermalized neutrons that could eventually reach the rear side of the wall. On the other hand, the BELEN detector was surrounded by 20 cm of PE shielding (see Fig. 7) in order to moderate and absorb scattered neutrons from the surroundings.
The GSI Multi Branch System (MBS) [42] was used to acquire data from the FRS tracking detectors and SIMBA. This data acquisition system (DACQ) was triggered by a scintillator at S4 with an efficiency of 100% for heavy ions. MBS was also triggered by high-energy implant and low-energy -decay events in SIMBA. On the other hand, the neutron data from BELEN were acquired using a digital self-triggered system [43] based on SIS3302 VME digitizers from Struck Innovative Systems [44]. Each module had 8 input channels running at 100 MHz sampling rate with an ADC resolution of 16 bit. A common clock was used for time-stamping the events acquired in the BELEN and MBS DACQ systems with 20 ns resolution. In this way, ion-implant versus -decay time-correlations and ion--neutron time-correlations could be built over an arbitrarily long time-window and in both, forward (increasing) and backward (decreasing) time directions. The latter aspect was a key feature in the analysis stage in order to determine reliably the background level (see Sec. III).
III Determination of -decay half-lives and P1n values
The methodology followed here for the analysis of the -decay half-lives is similar to the approach successfully applied in previous experiments at ISOL and fragmentation facilities, such as described in [14, 29]. There are two fundamental aspects in this data analysis, namely a reliable background characterization of - and neutron events and the spatial- and temporal- correlation approach. We describe first the analysis methodology from a rather general perspective and afterwards we show in detail its application to one of the largest implant statistics case, which is 213Tl. The latter is also used to illustrate the background treatment in the analysis.
Let us consider one specific isotope . The Bateman analytical expression [45] describes the time-evolution of its abundance . In this analysis we assumed that only the parent () and daughter () decays are contributing to the decay curve. This assumption is justified because all granddaughters of the analyzed nuclei are either stable nuclei or have a half-life much longer than that of parent and daughter nuclei. The resulting expression after this assumption is given by
| (2) |
where is the decay constant for the implanted nucleus , with unknown half-life , and the decay constant of the daughter nucleus . As it is shown below, in many cases even the contribution of the daughter nucleus was very small.
Regarding the spatial correlation, we considered an implant and a decay event to be spatially associated when the -decay position measured in layers A, B or C of SIMBA was within a correlation region of 3 mm2 around the implant position measured in the same layer. Extending this condition to neighboring layers did not improve noticeably the statistics and was therefore disregarded. In general, smaller and larger correlation areas were not found to provide a better result in terms of statistics and signal-to-background ratio in the time-correlation diagrams [25].
Regarding the time correlation, the methodology followed here consisted of building a correlation histogram for every implant of a certain species containing its time difference with respect to all subsequent events within a broad time window . In this analysis we used ten times the expected half-life, . As it is demonstrated below, the uncorrelated background rate is a constant value, that can be referred to as . In this case, the probability density function describing the time-dependency of the correlation distribution is given by [46]
| (3) |
where is the -detection efficiency in SIMBA. Thus, for a certain number of implanted events , the total number of particles detected at a time with respect to the implantation time () is given by
| (4) |
where is the total number of detected decays at a time , is the -background normalized and corrected by and corresponds to the bin time-width used in the implant- time-correlation histogram. The time evolution of the parent abundance is described by , whereas the contribution of the daughter is given by , assuming . In the data analysis the common factor in Eq. 4 is derived from the first bin in the correlation diagram [25]. In this way the quantity of interest () can be reliably determined without knowing explicitly the -detection efficiency.
Reference analysis of the 213Tl half-life
The thallium isotope 213Tl was implanted with large statistics (1015 implants) and therefore we used this case to establish the analysis methodology on a reliable statistical basis. The background showed a dependency with the time structure of the pulsed primary beam. Indeed, during beam extraction from SIS (1 s) the overall background level of -like events in SIMBA was 40% higher than during the time-interval between spills [25]. This feature led to a better signal-to-background ratio in the implant- time-correlation histograms when only -events outside of the spill time-intervals were considered in the correlations, when compared to the same diagram including -events inside and outside of the spill. With this restriction in mind, the background level evaluation was based on time backward () implant- correlations, i.e. time difference between each implant and all the -events occurred before it, within a broad time window () and in the same correlation area used in the forward analysis of 33 mm2. The background level thus determined allows one to adjust the parameter in Eq. 3. This approach is illustrated in Fig. 10 for the case of 213Tl, which shows backward (negative) and forward (positive) implant- correlations. The contribution to the measured -activity from decays of other nuclei can be assumed to be negligible due to the very low average implantation rate of ions/s/pixel.

Neutron branching ratio for 213Tl
The implant--neutron correlations were analyzed by selecting a correlation window of 400 forward and backward in time, following each detection. This time interval was determined according to the expected neutron moderation time in polyethylene. Considering the efficiency as a constant value along the range of energies of interest, the -value can be directly obtained from the subtraction of time-forward and time-backward -neutron correlated events,
| (5) |
where is the BELEN neutron efficiency, the number of forward correlated implant--neutron events and the the number of parent -decays. designates the backward -neutron correlations, which were used to define the uncorrelated neutron background level. The efficiency can be considered flat along the energy range of interest according to the -values of the implanted isotopes (100 keV - 2.5 MeV, see Table 3), with a constant value of 38% and with a relative uncertainty of 5% (see Fig. 8). This overall uncertainty includes the contributions of statistical errors of , and together with the uncertainty for the BELEN detector efficiency from the fluctuations along the energy range. For 213Tl we measured 5 forward and none backward correlated neutrons (Fig. 11), which yielded a -value of .

III.1 Thallium isotopes: 211-216Tl
Five more thallium isotopes were measured and their -decay half-lives and neutron branching ratios were analyzed following the approach described above for 213Tl. The implant- time-correlation histograms for all of them, 211,212,214,215,216Tl are shown in Fig. 12. The binned ML-analysis (dashed-dotted line on diagrams) yields s for 211Tl, s for 212Tl and s for 214Tl. An almost negligible contribution from the much slower decay of the daughter nuclei (211,212,214Pb) can be observed in these three cases. The most exotic thallium nuclei 215,216Tl were measured with rather limited statistics of only 281 and 99 implants, respectively. In this case, we noticed a slight improvement of the signal-to-background ratio in the correlation histograms when the correlation area was enlarged from mm2 to mm2. The ML analysis also shown in diagrams of Fig. 12 yielded a half-life of s for 215Tl and s for 216Tl.
The neutron data analysis showed the presence of only one correlated implant--neutron event for each of 211,212,215Tl, which yields neutron branching ratios of 2.2(2.2)%, 1.8(1.8)% and 4.6(4.6)%, respectively. For these three cases, given the low number of events compatible with the physical boundary, we have alternatively calculated a conservative upper-limit based on the Bayesian approach [48], which yields upper limits of 10%, 8% and 20% at a confidence level (CL) of 95%. On the other hand, with BELEN we were able to observe a rather large number (10) of implant--neutron correlated events for 214Tl (histogram also shown in Fig. 12), resulting in a value of . No single correlated or uncorrelated event was detected for 216Tl, which according to the implantation statistics obtained led an upper limit of 11.5% and a Bayesian upper limit of % at the 95% CL. Concerning the other implanted species, 209,210Tl, the implantation statistics was not enough to determine either their half-lives nor the neutron branching ratios.


III.2 Lead isotopes: 215-218Pb
The lead isotopes 212-219Pb were identified in the FRS and implanted in SIMBA. Out of them, 215-218Pb were implanted with enough statistics for a reliable half-life analysis. 214Pb was also implanted with large statistics (see Fig. 5), but its half-life of s [49] was too long for our analysis methodology and instrumentation. The ML analysis for the implant- correlation diagrams of 215-218Pb are shown in Fig. 13.


The 215Pb analysis yielded a half-life of s, as it can be observed on its diagram, contributions from 215Pb and his daughter 215Bi are present in the correlation histogram. For the case of the measurement of 216Pb, it allowed us to carry out a cross-check of the aforementioned analysis methodology, as its half-life can be determined by means of two different methods: implant- and implant- correlations. The former is also illustrated in Fig. 13, which shows the implant- correlation and the result of the ML analysis. On the other hand, the peak of -particles at 6778.5 keV, clearly identified in the energy spectrum of SIMBA (see Fig. 6b), corresponds to the decay of its granddaughter nucleus 216Po. Taking into account that the half-life of 216Po, 1452 ms [50], is much shorter than that of the direct daughter, 216Bi, 2.255 s [50], it was possible to apply the method described in [51] to obtain the half-life of 216Pb. With this method we determined a half-life of s (see diagram of Fig. 14) which is in perfect agreement with the one obtained applying the conventional method described above for implant- time correlation, s. The accuracy in the analysis of 217Pb and 218Pb was mainly limited by the implantation statistics, which was of 436 and 235 implants, respectively. However, a reliable ML analysis was possible from their implant- correlation diagrams, as shown in the bottom diagrams of Fig. 13. The resulting half-lives were s for 217Pb and s for 218Pb. According the negative Q-values of all these lead isotopes (see Table 3), no neutron branching emission is expected on them.

III.3 Mercury isotopes: 208-211Hg
From the eight mercury isotopes identified, 206-213Hg, implant statistics were high enough to analyze reliably four of them, 208-211Hg. The decay curve is strongly determined by the number of ion implants, as well as by the value of the half-life.


Thus, for 208Hg, with a low implantation statistics (220 events) and a relatively large half-life obtained from the ML analysis, s, the statistical uncertainty was 38%. On the other hand, 209Hg has a factor of about two more implants (583 events) and a shorter half-life ( s), which leads to a much lower uncertainty of 17%. An intermediate situation is found for the remaining two mercury isotopes, 210,211Hg, for which their half-lives analysis yielded s and s, respectively. In the latter case, the value obtained in the present work for the half-life of 211Tl was employed in the analysis. All aforementioned analyzed half-lives are shown in diagrams of Fig. 15. Regarding the neutron emission branching ratio, for 210Hg and 211Hg one implant--neutron event has been detected in the forward (moderation) time-window for each nucleus. This measurement yields neutron branching ratios of 2.2(2.2)% and 6.3(6.3)%, respectively. For these cases the calculated conservative upper-limit based on the Bayesian approach [48] yields upper constraints of 10%, and 28% at a CL of 95%.
III.4 Gold isotopes: 204-206Au
The 203-209Au isotopes were identified in this measurement, but the implantation statistics was only high enough to analyze three of them, 204-206Au.


In the case of 204Au (see Fig. 16) we also found a slight improvement of the decay curve when the correlation area was enlarged from 1 pixel (9 mm2) to 2 pixels (25 mm2) around the implant location, and included in the correlation those implant- events detected during the spill time. These provide a better sensitivity for the analysis, which yields a half-life of s. For the cases of 205Au and 206Au, both with implants, the ML analysis of the implant- correlation diagrams yield half-lives of s and s, respectively. Fig. 17 shows the analysis of these two gold isotopes.
III.5 Bismuth isotopes: 218-220Bi
Bismuth was the heaviest element implanted in SIMBA and we were able to determine the half-lives of three isotopes, 218-220Bi. The ML analysis of 218Bi yields a half-life of s and, as it can be seen in its diagram on Fig. 18, the contribution comes only from its own decay, as its daughter (218Pb) is an emitter. The half-life analysis for 219Bi yields s (see the diagram also on Fig. 18) and it includes the recent published half-life of its daughter, 219Po, s [52].


For the -decay analysis of 220Bi one has to take into account that the half-life value of its daughter nucleus 220Po is still unknown. Thus, our analysis provides a range of possible half-life values for 220Bi, which spans between 4 s and 15 s. The bold marker in Fig. 19 represents the 220Bi half-life using the theoretical prediction calculated by FRDM+QRPA model [53] for the half-life of 220Po, s.

IV Summary and discussion
This section provides a summary of the main results obtained in this work, as well as a comparison with all previous experimental results and the theoretical predictions of FRDM+QRPA [53] and DF3+cQRPA [54] models. A detailed comparison with the more recent calculations of Refs. [55, 56] can be found in Ref.[17]. In summary, half-live values for 20 neutron-rich isotopes of Au, Hg, Tl, Pb and Bi have been determined experimentally, as well as neutron-branching ratios (or upper limits) for eight of them. As some of the analyzed isotopes are not expected to be neutron emitters according their Qβn-values (see the last column of table 3), due to the low statistics available, the neutron emission analysis has been focused in those with large enough Qβn. The results are displayed in Fig. 20 and Fig. 21, respectively. For comparison purposes, previously published theoretical and experimental half-life values have been also included in Fig. 20.


Apart from the discrepancies found for the 208,209Hg isotopes, a rather good agreement is found between the present results and previously published experimental data. In the case of gold isotopes, all half-lives are fully compatible with those reported in previous measurements [58, 16, 59, 60], which are in reasonable agreement with DF3+cQRPA for . For 206Au () the half-life obtained confirms the recent value published in Ref. [60] and both differ from the DF3+cQRPA value and the trends predicted by the available theoretical models. Whether this “gold anomaly” is related to effects changing the occupation of the orbital, or due to a weakening of the spin-orbit field caused by the tensor force [61], or might be due to the recently proposed three-body force mechanism [62, 63] remains an open question which calls for more detailed theoretical studies and further specific experiments allowing for reconstruction of the decay scheme.
Concerning Hg isotopes, as discussed in Ref. [17], recent measurements at CERN-ISOLDE [64] indicate that the half-life of 208,209Hg nuclei are much shorter than the values reported in Ref. [65] and, therefore, this discrepancy will not be discussed further. Theoretical predictions by the FRDM+QRPA seem to agree better with the measured half-lives, with the only exception of 209Hg, whereas the opposite is found for the Hg half-lives predicted with DF3+cQRPA.
Regarding the thallium isotopes, previous half-lives were obtained in another experiment by using a similar experimental setup, but using a completely different analysis approach [66, 67]. In summary a good agreement is found for 211Tl, whereas the half-lives of 212Tl and 213Tl differ by factors of 2-3. It is worth emphasizing the overall good agreement for the thallium chain between the present results and FRDM+QRPA predictions, including the case of the most exotic nuclei reported here for the first time, 214-216Tl. This result seems to indicate the rather low relevance of first forbidden (FF) transitions in the mass region, as discussed in Ref. [17].
The analysis of the lead isotopes includes three new half-lives, 216-218Pb. The half-life obtained for 215Pb is in reasonable agreement with the two previous measurements [68, 51]. Along the lead isotopic chain, the FRDM+QRPA model overestimates the experimental values by factors between 3-9. The values predicted by DF3+cQRPA are, on average, slightly closer to the measured half-lives, but the mass (neutron number) dependency of the half-life is not satisfactorily reproduced by any of these two models.
For the bismuth chain the FRDM+QRPA predictions agree reasonably well with the heaviest measured nuclei 219-220Bi, whereas almost one order of magnitude difference is found for 218Bi. The latter half-life is, however, rather well established experimentally [66]. The result quoted in this work for the half-life of 220Bi, 4-15 s (see Fig. 19), can be re-determined more accurately once the half-life of 220Po is measured.
The neutron-branching ratios determined in this work represent the first set of experimental data available in this mass region. Therefore, the values reported here can be only compared with theoretical predictions. Both theoretical and experimental -values are listed in Table 3 and displayed in Fig. 21.
In summary, the agreement between theory and experiment is rather good for the Hg and Tl isotopes with masses between 208 and 214. However, for the two heaviest thallium nuclei 215,216Tl, KTUY [55] and RHB+RQRPA [56] models are in agreement but the other theoretical predictions of the neutron emission overestimate substantially the obtained experimental results.
V Conclusions
Since both the half-life and the neutron emission probability are integral quantities of the -decay, it is difficult to explain why the FRDM+QRPA reproduces so well the average decay strength over the full Qβ-window (see Fig. 20) along the chain of measured Tl isotopes, whereas it seems to fail dramatically in the upper energy range of 215,216Tl, beyond the neutron separation energy of the daughter nuclei, as deducted from their determined neutron branching ratios. At first sight, one is tempted to attribute such a discrepancy to the possible contribution of high-energy first forbidden (FF) transitions populating low-lying levels of the daughter nuclei and hindering therefore the emission of neutrons. Nevertheless, this interpretation is at variance with the overall systematic found in the region [51, 66, 16, 60, 17], where Gamow-Teller (GT) transitions seem to play a dominant role in general. At present, the only plausible explanation for such a feature could be that the overall strength of the decay is overestimated in FRDM+QRPA both, in the full Qβ and in the upper energy window Qβn. As reported in Ref. [17], more advanced microscopic models such as RHB+RQRPA [56] and KTUY [55] show an inverted behavior, yielding good predictions for the -values, but discrepant values for the half-lives, thus not improving the situation. Recent calculations based on an improved QRPA and HF theory [57], included in Fig. 21, also show large discrepancies. Clearly more -decay measurements and theoretical efforts are needed in this mass region, in order to gain a better understanding of the underlying nuclear structure effects, as well as to guide global theoretical models far-off stability.
Acknowledgements.
This work was supported by the Spanish Ministerio de Economia y Competitividad under grants No. FPA2011-28770-C03-03, FPA2008-04972-C03-03, AIC-D-2011-0705, FPA2011-24553, FPA2008-6419, FPA2010-17142, FPA2014-52823-C2-1-P, FPA2014-52823-C2-2-P, CPAN CSD-2007-00042 (Ingenio2010), and the program Severo Ochoa (SEV-2014-0398). I.D and M.M were supported by the German Helmholtz Association via the Young Investigators Grant VH-NG 627 (LISA- Lifetime Spectroscopy for Astrophysics) and the Nuclear Astrophysics Virtual Institute (VH-VI-417), and by the German Bundesministerium für Bildung und Forschung under No. 06MT7178 / 05P12WOFNF. R.C.F acknowledges the support of the Spanish Nuclear Security Council (CSN) under a grant of Catedra Argos. UK authors acknowledge the support of the UK Science & Technology Facilities Council (STFC) under grant No. ST/F012012/1. Yu.A.L. acknowledges support from Helmholtz-CAS Joint Research Group (HCJRG-108). R.C.F. and I.D. are also supported by the National Research Council of Canada (NSERC) Discovery Grants SAPIN-2014-00028 and RGPAS 462257-2014 at TRIUMF.| Nuclei | Implanted | T (s) | Previous | FRDM+QRPA | DF3+cQRPA | |
| ions | (this work) | T (s) | (s) [53] | (s) [54] | ||
| 204Au | 125 | 54 | 33.7 14.9 | 39.8 0.9 [58] | 455.3 | 42.4 |
| 37.2 0.8 [16] | ||||||
| 205Au | 126 | 103 | 35.4 16.7 | 31.0 0.2 [59] | 222.0 | 18.7 |
| 32.5 14.0 [16] | ||||||
| 206Au | 127 | 106 | 55.7 16.7 | 40.0 15.0 [60] | 21.3 | 0.72 |
| 208Hg | 128 | 220 | 132.2 50.0 | 2460 [65] | 168.9 | 12.1 |
| 209Hg | 129 | 583 | 6.3 1.1 | 35.0 [65] | 33.6 | 3.7 |
| 210Hg | 130 | 512 | 63.7 11.6 | 300 ns | 41.2 | 5.2 |
| 211Hg | 131 | 253 | 26.4 8.1 | 300 ns | 14.9 | 1.9 |
| 211Tl | 130 | 483 | 76.5 17.8 | 88 [66] | 70.9 | 114.9 |
| 212Tl | 131 | 1056 | 30.9 8.0 | 96 [66] | 29.0 | - |
| 213Tl | 132 | 1015 | 23.8 4.4 | 101 [28] | 32.4 | 70.4 |
| 46 [66] | ||||||
| 214Tl | 133 | 598 | 11.0 2.4 | 300 ns | 14.4 | - |
| 215Tl | 134 | 281 | 9.7 3.8 | 300 ns | 7.8 | - |
| 216Tl | 135 | 99 | 5.9 3.3 | 300 ns | 2.8 | - |
| 215Pb | 133 | 1079 | 98.4 30.8 | 147 12 [68] | 282.5 | 27.1 |
| 160 40 [51] | ||||||
| 216Pb | 134 | 1005 | 99.4 11.7 | 300 ns | 852.2 | 52.0 |
| 217Pb | 135 | 436 | 19.9 5.3 | 300 ns | 104.9 | 8.5 |
| 218Pb | 136 | 235 | 14.8 6.8 | 300 ns | 66.3 | 28.4 |
| 218Bi | 135 | 294 | 38.5 21.6 | 33 1 [49] | 2.92 | - |
| 36 14 [66] | ||||||
| 219Bi | 136 | 306 | 8.7 2.9 | 22 7 [66] | 26.54 | - |
| 220Bi | 137 | 176 | 9.5 5.7 | 300 ns | 5.17 | - |
| Nuclei | (%) | FRDM+QRPA | DF3+cQRPA | RHB+RQRPA | KTUY | arXiv:1608.01956 | (keV) [69, 70] | |
|---|---|---|---|---|---|---|---|---|
| (this work) | (%) [53] | (%) [71] | (%) [56] | (%) [55] | (%) [57] | (extr. = extrapolated) | ||
| 204Au | 125 | - | 0.0 | 0.0 | 0.1 | 0.0 | - | 3453 200 (extr.) |
| 205Au | 126 | - | 0.0 | 0.0 | 0.2 | 0.0 | - | 2151 196 (extr.) |
| 206Au | 127 | - | 0.0 | 0.0 | 0.5 | 0.0 | 0.0 | 2 298 (extr.) |
| 208Hg | 128 | - | 0.0 | 3.2 | 0.3 | 0.0 | - | 303.32 31.23 |
| 209Hg | 129 | - | 0.0 | 2.8 | 0.5 | 0.0 | - | 34 149 (extr.) |
| 210Hg | 130 | 2.2 2.2 | 0.0 | 9.3 | 0.6 | 0.0 | 71 | 201 196 (extr.) |
| 211Hg | 131 | 6.3 6.3 | 0.81 | 7.5 | 0.8 | 0.0 | 11 | 551 196 (extr.) |
| 211Tl | 130 | 2.2 2.2 | 0.04 | 0.95 | 1.2 | 0.28 | - | 578.67 41.95 |
| 212Tl | 131 | 1.8 1.8 | 0.56 | - | 1.3 | 0.23 | 0.0 | 869 200 (extr.) |
| 213Tl | 132 | 7.6 3.4 | 13.26 | 2.93 | 6.8 | 1.93 | 100 | 1259.73 27.10 |
| 214Tl | 133 | 34.3 12.2 | 10.38 | - | 10 | 1.56 | 66 | 1595 196 (extr.) |
| 215Tl | 134 | 4.6 4.6 | 55.24 | - | 14.2 | 5.54 | 100 | 2021 298 (extr.) |
| 216Tl | 135 | 11.5 | 55.36 | - | 17 | 4.45 | 96 | 2230 315 (extr.) |
| 215Pb | 133 | - | 0.0 | 0.0 | 0.3 | 0.0 | - | 2455 102 (extr.) |
| 216Pb | 134 | - | 0.0 | 0.0 | 0.3 | 0.0 | 0.0 | 2240 196 (extr.) |
| 217Pb | 135 | - | 0.0 | 0.0 | 0.4 | 0.0 | 0.0 | 1705 298 (extr.) |
| 218Pb | 136 | - | 0.0 | 0.0 | 0.4 | 0.0 | 0.0 | 1348 299 (extr.) |
| 218Bi | 135 | - | 0.0 | - | 1.2 | 0.0 | 0.0 | 740.61 27.73 |
| 219Bi | 136 | - | 0.06 | - | 0.3 | 0.0 | 0.0 | 148 196 (extr.). |
| 220Bi | 137 | - | 0.01 | - | 0.4 | 0.0 | 0.0 | 66.0 298 (extr.) |
References
- [1] G. Rudstam, K. Aleklett, and L. Sihver, Atomic Data and Nuclear Data Tables 53, 1 (1993).
- [2] B. Pfeiffer, K.-L. Kratz, and P. Möller, Progress in Nuclear Energy 41, 39 (2002).
- [3] L. A.V.Kogan, Soviet Phys. JETP 5, 365 (1957).
- [4] G. Stetter, in Sci. Abstr, Vol. 16 (1962) p. 1409.
- [5] E. Burbidge, G. Burbidge, W. Fowler, and F. Hoyle, Rev. Mod. Phys 29, 547 (1957).
- [6] A. Arcones and G. Martínez-Pinedo, Physical Review C 83, 045809 (2011).
- [7] M. Mumpower, R. Surman, G. McLaughlin, and A. Aprahamian, Progress in Particle and Nuclear Physics 86, 86 (2016a).
- [8] R. Surman, M. Mumpower, J. Cass, I. Bentley, A. Aprahamian, and G. C. McLaughlin, in EPJ Web of Conferences, Vol. 66 (EDP Sciences, 2014) p. 07024.
- [9] H. Ohm et al., Zeitschrift für Physik A Hadrons and Nuclei 296, 23 (1980).
- [10] K.-L. Kratz, A. Schröder, H. Ohm, G. Jung, B. Pfeiffer, and F. Schussler, Physics Letters B 103, 305 (1981).
- [11] K.-L. Kratz et al., Zeitschrift für Physik A Hadrons and Nuclei 306, 239 (1982).
- [12] H. Gabelmann et al., Zeitschrift für Physik A Hadrons and Nuclei 308, 359 (1982).
- [13] J. Wang, P. Dendooven, M. Hannawald, A. Honkanen, M. Huhta, A. Jokinen, K.-L. Kratz, G. Lhersonneau, M. Oinonen, H. Penttilä, et al., Physics Letters B 454, 1 (1999).
- [14] F. Montes, A. Estrade, P. Hosmer, S. Liddick, P. Mantica, A. Morton, W. Mueller, M. Ouellette, E. Pellegrini, P. Santi, et al., Physical Review C 73, 035801 (2006).
- [15] J. Pereira, S. Hennrich, A. Aprahamian, O. Arndt, A. Becerril, T. Elliot, A. Estrade, D. Galaviz, R. Kessler, K.-L. Kratz, et al., Physical Review C 79, 035806 (2009).
- [16] A. Morales, J. Benlliure, T. Kurtukián-Nieto, K.-H. Schmidt, S. Verma, P. Regan, Z. Podolyák, M. Górska, S. Pietri, R. Kumar, et al., Physical Review Letters 113, 022702 (2014a).
- [17] R. Caballero-Folch, C. Domingo-Pardo, J. Agramunt, et al., Physical Review Letters 117 (2016), 10.1103/PhysRevLett.117.012501.
- [18] H. Geissel, P. Armbruster, K. Behr, A. Brünle, K. Burkard, M. Chen, H. Folger, B. Franczak, H. Keller, O. Klepper, et al., Nuclear Instruments and Methods in Physics Research Section B: Beam Interactions with Materials and Atoms 70, 286 (1992).
- [19] R. Janik, A. Prochazka, B. Sitar, P. Strmen, I. Szarka, H. Geissel, K.-H. Behr, C. Karagiannis, C. Nociforo, H. Weick, et al., Nuclear Instruments and Methods in Physics Research Section A: Accelerators, Spectrometers, Detectors and Associated Equipment 640, 54 (2011).
- [20] R. Schneider and A. Stolz, Technical Manual Ionization Chamber MUSIC80., Tech. Rep. (Technische Universität München., 2000).
- [21] A. Morales, -delayed -ray spectroscopy of heavy neutron-rich nuclei produced by cold-fragmentation of 208Pb, Ph.D. thesis, Universidade de Santiago de Compostela (2011).
- [22] E. Casarejos-Ruiz, Measurement and study of the residual nuclides produced in fragmentation reactions of 238U at 1 A GeV with deuterium, Ph.D. thesis, Universidade de Santiago de Compostela (2001).
- [23] F. Farinon, Unambiguous identification and investigation of uranium projectile fragments and discovery of 63 new neutron-rich isotopes in the element range 61 less-than or equal to Z less-than or equal to 78 at the FRS., Ph.D. thesis, Ph.D. thesis, Justus-Liebig-Universität, Gießen (2011). (2011).
- [24] J. Kurcewicz, F. Farinon, H. Geissel, S. Pietri, C. Nociforo, A. Prochazka, H. Weick, J. Winfield, A. Estradé, P. Allegro, et al., Physics Letters B 717, 371 (2012).
- [25] R.Caballero-Folch, First measurement of beta-decay half-lives and neutron emission probabilities in several isotopes beyond N=126, Ph.D. thesis, Universitat Politècnica de Catalunya. (2015).
- [26] F. Kondev, Nuclear Data Sheets 101, 521 (2004).
- [27] H. Alvarez-Pol, J. Benlliure, E. Casarejos, L. Audouin, D. Cortina-Gil, T. Enqvist, B. Fernández-Domínguez, A. Junghans, B. Jurado, P. Napolitani, et al., Physical Review C 82, 041602 (2010).
- [28] L. Chen, W. Plass, H. Geissel, R. Knöbel, C. Kozhuharov, Y. A. Litvinov, Z. Patyk, C. Scheidenberger, K. Siegień-Iwaniuk, B. Sun, et al., Physics Letters B 691, 234 (2010).
- [29] C. Hinke, M. Böhmer, P. Boutachkov, T. Faestermann, H. Geissel, J. Gerl, R. Gernhäuser, M. Górska, A. Gottardo, H. Grawe, et al., Nature 486, 341 (2012).
- [30] K. Steiger, Diploma thesis: Effizienzbestimmung des Detektoraufbaus fur die Zerfallsspektroskopie von 100Sn, Ph.D. thesis, Technische Universität München. (2009).
- [31] C.B.Hinke, Spectroscopy of the doubly magic nucleus 100Sn and its decay, Ph.D. thesis, Technische Universität München. (2010).
- [32] K. Smith, -delayed neutron emission studies of neutron-rich Palladium and Silver isotopes, Ph.D. thesis, Notre Dame, Indiana (2014).
- [33] M. Gómez-Hornillos, J. Rissanen, J. Taín, A. Algora, K. Kratz, G. Lhersonneau, B. Pfeiffer, J. Agramunt, D. Cano-Ott, V. Gorlychev, R. Caballero-Folch, T. Martínez, L. Achouri, F. Calvino, G. Cortès, T. Eronen, A. García, M. Parlog, Z. Podolyak, C. Pretel, and E. Valencia, Hyperfine Interactions 223, 185 (2014).
- [34] J. Agramunt, A. Garcia, A. Algora, J. Äystö, R. Caballero-Folch, F. Calvino, D. Cano-Ott, G. Cortes, C. Domingo-Pardo, T. Eronen, et al., Nuclear Data Sheets 120, 74 (2014).
- [35] V. Gorlychev, Design of a 4 neutron detector for -delayed neutron detection experiments, Ph.D. thesis, Universitat Politècnica de Catalunya, Barcelona (Spain). (2014).
- [36] A. Torner, J. Agramunt, A. Algora, L. Batet, R. Caballero-Folch, F. Calviño, D. Cano-Ott, A. García, G. Cortés, I. Dillmann, C. Domingo-Pardo, M. Gómez-Hornillos, V. Gorlychev, M. Marta, T. Martínez, A. Poch, C. Pretel, A. Riego, and J. Taín, Technical Design Report of the Beta-Delayed Neutron Detector (BELEN) for NUSTAR (DESPEC), Tech. Rep. (Universitat Politècnica de Catalunya, Barcelona (Spain)., 2014).
- [37] A. Riego, Design of the BELEN detector for wide energy range with flat and high detection efficiency, Ph.D. thesis, Universitat Politècnica de Catalunya, Barcelona (Spain). (2016).
- [38] S. Agostinelli, J. Allison, K. a. Amako, J. Apostolakis, H. Araujo, P. Arce, M. Asai, D. Axen, S. Banerjee, G. Barrand, et al., Nuclear instruments and methods in physics research section A: Accelerators, Spectrometers, Detectors and Associated Equipment 506, 250 (2003).
- [39] D. B. Pelowitz et al., MCNPX user’s manual version 2.5.0, Tech. Rep. (Los Alamos National Laboratory, 2005).
- [40] G. Fishman, Monte-Carlo concepts, Algorithms and Applications (1996).
- [41] R. Y. Rubinstein and D. P. Kroese, Simulation and the Monte Carlo Method (1981).
- [42] H. N.Kurz, “GSI Data Acquisition System MBS, Release Notes v5.1,” (2010).
- [43] J. Agramunt, J. Tain, M. Gómez-Hornillos, A. Garcia, F. Albiol, A. Algora, R. Caballero-Folch, F. Calviño, D. Cano-Ott, G. Cortés, et al., Nuclear Instruments and Methods in Physics Research Section A: Accelerators, Spectrometers, Detectors and Associated Equipment 807, 69 (2016).
- [44] “http://www.struck.de/sis3302.htm,” .
- [45] H. Bateman, Proc. Camb. Philos. Soc. 15, 423 (1910).
- [46] M. Bernas, P. Armbruster, J. Bocquet, R. Brissot, H. Faust, C. Kozhuharov, and J. Sida, Zeitschrift für Physik A Atomic Nuclei 336, 41 (1990).
- [47] J. G. Proakis, M. Salehi, N. Zhou, and X. Li, Communication systems engineering, Vol. 1 (Prentice-hall Englewood Cliffs, 1994).
- [48] A. Gelman, J. B. Carlin, H. S. Stern, and D. B. Rubin, Bayesian data analysis, Vol. 2 (Taylor & Francis, 2014).
- [49] Brookhaven National Laboratory, USA .
- [50] S.-C. Wu, Nuclear Data Sheets 108, 1057 (2007).
- [51] A. Morales, G. Benzoni, A. Gottardo, J. Valiente-Dobón, N. Blasi, A. Bracco, F. Camera, F. Crespi, A. Corsi, S. Leoni, et al., Physical Review C 89, 014324 (2014b).
- [52] D. Fink, T. Cocolios, A. Andreyev, S. Antalic, A. Barzakh, B. Bastin, D. Fedorov, V. Fedosseev, K. Flanagan, L. Ghys, et al., Physical Review X 5, 011018 (2015).
- [53] P. Möller, B. Pfeiffer, and K.-L. Kratz, Physical Review C 67, 055802 (2003).
- [54] I. Borzov, Nuclear Physics A 777, 645 (2006).
- [55] H. Koura, T. Tachibana, M. Uno, and M. Yamada, Progress of theoretical physics 113, 305 (2005).
- [56] T. Marketin, L. Huther, and G. Martínez-Pinedo, Physical Review C 93, 025805 (2016).
- [57] M. Mumpower, T. Kawano, and P. Moller, arXiv preprint arXiv:1608.01956 (2016b).
- [58] D. Craig and H. Taylor, Journal of Physics G10, 1133 (1984).
- [59] C. Wennemann, W.-D. Schmidt-Ott, T. Hild, K. Krumbholz, V. Kunze, F. Meissner, H. Keller, R. Kirchner, and E. Roeckl, Zeitschrift für Physik A Hadrons and Nuclei 347, 185 (1994).
- [60] A. Morales, G. Benzoni, N. Al-Dahan, S. Vergani, Z. Podolyák, P. Regan, T. Swan, J. Valiente-Dobón, A. Bracco, P. Boutachkov, et al., EPL 111, 52001 (2015).
- [61] P. Goddard, P. Stevenson, and A. Rios, Physical Review Letters 110, 032503 (2013).
- [62] H. Nakada, Physical Review C 92, 044307 (2015).
- [63] A. Gottardo, J. Valiente-Dobón, G. Benzoni, R. Nicolini, A. Gadea, S. Lunardi, P. Boutachkov, A. Bruce, M. Górska, J. Grebosz, et al., Physical Review Letters 109, 162502 (2012).
- [64] Podolyák, Zs., (2015), (private communication).
- [65] Z. Li, Z. Jinhua, Z. Jiwen, W. Jicheng, Q. Zhi, Y. Youngfeng, Z. Chun, J. Genming, G. Guanghui, D. Yifei, et al., Physical Review C 58, 156 (1998).
- [66] G. Benzoni, A. Morales, J. Valiente-Dobón, A. Gottardo, A. Bracco, F. Camera, F. Crespi, A. Corsi, S. Leoni, B. Million, et al., Physics Letters B 715, 293 (2012).
- [67] T. Kurtukian-Nieto, J. Benlliure, and K.-H. Schmidt, Nuclear Instruments and Methods in Physics Research Section A: Accelerators, Spectrometers, Detectors and Associated Equipment 589, 472 (2008).
- [68] H. Sagawa, A. Arima, and O. Scholten, Nuclear Physics A 474, 155 (1987).
- [69] G. Audi, M. Wang, A. Wapstra, F. Kondev, M. MacCormick, X. Xu, and B. Pfeiffer, Chinese Physics C36, 1287 (2012).
- [70] M. Wang, G. Audi, A. Wapstra, F. Kondev, M. MacCormick, X. Xu, and B. Pfeiffer, Chinese Physics C36, 1603 (2012).
- [71] Borzov, I.N., (2010), (private communication).