A search for H absorption around KELT-3 b and GJ 436 b
Abstract
Observations of extended atmospheres around hot planets have generated exciting results concerning the dynamics of escaping planetary material. The configuration of the escaping planetary gas can result in asymmetric transit features, producing both pre- and post-transit absorption in specific atomic transitions. Measuring the velocity and strength of the absorption can provide constraints on the mass loss mechanism and, potentially, clues to the interactions between the planet and the host star. Here we present a search for H absorption in the circumplanetary environments of the hot planets KELT-3 b and GJ 436 b. We find no evidence for absorption around either planet at any point during the two separate transit epochs that each system was observed. We provide upper limits on the radial extent and density of the excited hydrogen atmospheres around both planets. The null detection for GJ 436 b contrasts with the strong Ly absorption measured for the same system, suggesting that the large cloud of neutral hydrogen is almost entirely in the ground state. The only confirmed exoplanetary H absorption to date has been made around the active star HD 189733 b. KELT-3 and GJ 436 are less active than HD 189733, hinting that exoplanet atmospheres exposed to EUV photons from active stars are better suited for H absorption detection.
I INTRODUCTION
Due to the large amount of stellar flux received, hot planets ( 5 days) provide insight into extreme astrophysical processes that do not occur around longer period planets. These planets are often observed to be inflated (Laughlin et al. 2011, e.g.,) and detailed rotational and atmospheric dynamics have now been observed for the hot Jupiters HD 189733 b (Wyttenbach et al. 2015; Brogi et al. 2016; Louden & Wheatley 2015) and HD 209458 b (Snellen et al. 2010).
Perhaps the most interesting dynamical process observed around hot planets is evaporative mass loss. This process was first observed by Vidal-Madjar et al. (2003) for the hot Jupiter HD 209458 b: observations of the UV hydrogen line Ly showed an extended atmosphere of neutral hydrogen that was larger than the planet’s Roche limit. Followup observations demonstrated that the mass loss was highly variable and changed significantly from epoch to epoch (Lecavelier des Etangs et al. 2012). Subsequent investigations of other hot planet systems, namely HD 189733 b, 55 Cnc b, and GJ 436 b, have revealed a handful of mass loss detections (Lecavelier des Etangs et al. 2010; Ehrenreich et al. 2012; Kulow et al. 2014; Ehrenreich et al. 2015).
The most recent mass loss detection around GJ 436 b by Ehrenreich et al. (2015) highlighted the possibility of observing these extended and escaping atmospheres both before and after the nominal planetary transit (i.e., the broadband white light transit). Besides GJ 436 b, evidence for pre-transit signatures have been observed for WASP-12 b (Fossati et al. 2010) and HD 189733 b (Ben-Jaffel & Ballester 2013; Bourrier et al. 2013; Cauley et al. 2015; Cauley et al. 2016).
Although it seems that both pre- and in-transit signatures of extended atmospheres may be common for hot planets, observing these phenomena requires significant telescope resources since there is evidence that they do not manifest in broadband photometric observations (Turner et al. 2016), i.e., the absorption is only seen in strong atomic lines. Due to the abundance of hydrogen and the intrinsic line strength, the atomic transition most suited for measuring the dynamics of the escaping material is the resonance line Ly (Lecavelier des Etangs et al. 2010; Ehrenreich et al. 2015, e.g.,). Currently, the only telescope capable of performing high-spectral resolution Ly observations is the Hubble Space Telescope (HST). Thus it is difficult to perform exploratory Ly measurements of these phenomena for a large number of systems due to the high demand for time on HST and the inherent variability associated with the mass loss process (Lecavelier des Etangs et al. 2012, e.g.,).
Our recent detections of pre-transit, as well as in-transit, H absorption signatures around HD 189733 b suggest that it may be possible to detect highly extended neutral atmospheres using high-resolution optical spectrographs (Jensen et al. 2012; Cauley et al. 2015; Cauley et al. 2016). A detection of excited hydrogen via the flux decrement at the Balmer jump was first reported by Ballester et al. (2007) for HD 209458 b. While our excited hydrogen measurements for HD 189733 b do not show evidence of large blue-shifted velocities indicative of escaping material, the transit depths indicate that the transmission spectrum is probing pressures of 10-6–10-9 bars, i.e., the planetary thermosphere (Christie et al. 2013). We note that Barnes et al. (2016) recently questioned the planetary origin of the HD 189733 H signal due to velocity centroids in the transmission spectra that appear to correspond to the stellar rest frame. Thus there are still questions concerning the nature of the in-transit HD 189733 H measurements. In an upcoming paper, however, we will argue for the planetary interpretation although further observations are certainly warranted to confirm either hypothesis. Detections of highly extended atmospheres via H absorption would provide strong targets for followup Ly observations that can be used to constrain the mass loss mechanism and escape rate.
In this paper we present high spectral resolution observations of H for the hot planets KELT-3 b (Pepper et al. 2013) and GJ 436 b (Butler et al. 2004) with the aim of searching for H absorption in the circumplanetary environment.11 1 We include the bound extended atmosphere in this phrase. KELT-3 b was chosen for both the brightness (V9.8), visibility during the 2016 A semester, and the suggested low chromospheric activity level of its host star (Pepper et al. 2013), a desirable property since stellar activity can mimic absorption signatures (Berta et al. 2011; Cauley et al. 2016, e.g.,). GJ 436 b was targeted due to the large Ly transit depth measured by Ehrenreich et al. (2015): even a small fraction (0.01%) of the neutral hydrogen in the state would be detectable across a single transit. A detection of excited hydrogen absorption around these planets would significantly expand the confirmed H detections (Jensen et al. 2012; Cauley et al. 2015; Cauley et al. 2016, see) and further our understanding of how this line forms in hot exoplanet environments.
II OBSERVATIONS AND DATA REDUCTION
The observations were performed using the Bench Spectrograph with Hydra (Barden et al. 1992) at the WIYN 3.5 meter telescope. The instrument was configured to provide the highest resolution possible () for a single spectral order of width 380 Å with H positioned at the center of the order. This setup was achieved using the Bench Spectrograph Camera combined with the blue fiber cables and the 316@63.4 echelle grating. Target exposures were taken for two separate transits of each object. Details of the observations are given in Table 1. We note that the smaller number of in-transit exposures of KELT-3 on 2016-02-04 compared with 2016-03-02 is the result of suspended observations due to high wind speeds.
| Date | |||||||||||
|---|---|---|---|---|---|---|---|---|---|---|---|
| Object | (mag) | (UT) | (hours) | (hours) | (near 6500 Å) | ||||||
| (1) | (2) | (3) | (4) | (5) | (6) | (7) | (8) | (9) | (10) | (11) | (12) |
| KELT-3 | 9.8 | 2016-02-04 | 4.4 | 4.6 | 600/900 | 16 | 7 | 11 | 183 | 11 | 64 |
| 2016-03-02 | 6.4 | 2.2 | 600 | 27 | 16 | 3 | 190 | 11 | 60 | ||
| GJ 436 | 10.7 | 2016-02-15 | 3.0 | 2.0 | 1500 | 6 | 2 | 4 | 133 | 10 | 62 |
| 2016-02-23 | 4.4 | 3.3 | 1200 | 12 | 2 | 9 | 142 | 10 | 59 |
A single fiber is dedicated to the target. The remaining fibers are either assigned to a sky position or to a comparison star in the field. The exact number of sky and comparison object fibers for each date are given in Table 1. The sky fibers are necessary to subtract out a simultaneous sky spectrum, which includes both continuum emission and night sky emission lines. Comparison stars are important for identifying artifacts in the transmission spectrum, e.g., imperfect sky subtraction.
II.1 Data reduction
The data were reduced using custom IDL routines. Standard reduction steps were performed including bias subtraction, flat fielding of the individual fiber spectra, and wavelength calibration using ThAr lamp spectra. Individual fiber spectra were extracted using a 7-pixel wide boxcar. Cosmic rays in all spectra were identified and removed post-extraction through median filtering of the individual exposures.
The background sky emission can be a non-negligible contribution to the object spectrum depending on the relative brightness between the sky and the object. This contribution can be exacerbated by moonlight scattered off of clouds in the field of view. Thus a careful accounting of the sky spectrum from exposure to exposure is important since we are looking for signals in the target spectrum at the 1% level. We also account for small variations in the sky spectrum across the field of view by only selecting the sky fibers with angular distance 10′ from the target or comparison fibers. This normally includes 10–15 sky fibers for each object fiber.
For each exposure the proximate sky fibers are selected for both the target fiber and each individual comparison fiber. The relative transmission efficiency of the sky and target/comparison fibers are calculated using the extracted flat field spectra. Cosmic rays are filtered out of the sky spectra using a 3 median filter. The median sky spectrum for the target and each comparison fiber is calculated and subtracted from the target or comparison spectrum. Examples of the simultaneous target, comparison, and sky spectra are shown in Figure 1 and Figure 2.
Small shifts of a spectrum on the detector can occur throughout the night which amount to small changes in the wavelengths of spectral features. To account for these changes, each spectrum is shifted against a portion of a reference spectrum until the standard deviation of ratio of the spectra is minimized. The region of interest near H is not included in the standard deviation minimization. These shifts are typically on the order 0.001 Å–0.01 Å and correlate strongly between objects, i.e., the cause is instrumental and not intrinsic to the targets.
III H transmission spectra and absorption measurements
We define the transmission spectrum as:
| (1) |
where is the average spectrum from some time period (e.g., the pre-transit exposures and the in-transit exposures) and is the average spectrum from a comparison time period. This is the same definition used in our previous work (Jensen et al. 2012; Cauley et al. 2015; Cauley et al. 2016).
We compare three different groups of exposures to each other: pre-transit, in-transit, and post-transit (see Table 2). After is calculated, it is renormalized with a low degree polynomial in order to remove any residual slope in the spectrum. The transmission spectra for KELT-3 b are shown in Figure 3 and the spectra for GJ 436 b are shown in Figure 4. We measure the absorption across a 1000 km s-1 band, or 21.9 Å, centered on H. The absorption is calculated as the equivalent width of from Equation 1:
| (2) |
where is the flux in the spectrum of the group of interest at velocity , is the flux in the comparison group spectrum at velocity , and is the wavelength difference at velocity . This is essentially the negative total of . The units of are angstroms. The uncertainty on is derived by summing the normalized flux errors in quadrature across the same integration band.
| In-Prea | In-Post | Pre-Post | |||||||
|---|---|---|---|---|---|---|---|---|---|
| Object | UT Date | ||||||||
| (1) | (2) | (3) | (4) | (5) | (6) | (7) | (8) | ||
| KELT-3 | 2016-02-04 | 1.1 | 4.0 | 0.3 | 4.5 | 3.5 | 3.7 | ||
| 2016-03-02 | 1.4 | 3.4 | 0.6 | 4.4 | 4.0 | 7.4 | |||
| GJ 436 | 2016-02-15 | 24.1 | 13.9 | 18.3 | 15.1 | 8.6 | 9.2 | ||
| 2016-02-23 | 9.5 | 9.1 | 0.4 | 8.7 | 0.7 | 6.0 | |||
Values of and its uncertainty are given in Table 2. There is no significant absorption present in any of the comparisons. The KELT-3 spectra are high enough signal-to-noise to exclude 3 absorption 1.310-2 Å, a value similar to that measured for HD 189733 b in Cauley et al. (2016).
IV Absorption timeseries
We have also computed as a function of time for the higher signal-to-noise dates 2016-02-04 (KELT-3) and 2016-02-23 (GJ 436) dates. For the individual measurements, we choose to narrow the integration width to km s-1 so as to not introduce additional uncertainty into the already noisy individual measurements. The timeseries is shown in Figure 5. For each date, the first five pre-transit spectra, which correspond to the first five points shown in each panel, are used to construct a comparison spectrum. All individual transmission spectra are then constructed with that comparison spectrum. We note that individual points that appear to show a 1-2 signal are most likely the result of small residual differences in sky subtractions, which tend to average out in the master spectra (see Figure 3 and Figure 4). In other words, we do not believe these signals are intrinsic to the stellar system. Uncertainties for each point are the normalized flux uncertainties added in quadrature across the range of integration.
The absence of absorption in individual KELT-3 observations is consistent with the null detection in the combined average spectra. Although no significant H changes are detected, the observations serve as a demonstration of the achievable precision for 10 stars using a high-resolution spectrograph on a 4-meter telescope.
Absorption is also absent from the GJ 436 timeseries. We have simulated what the expected signal would be from the extended hydrogen cloud suggested by Ehrenreich et al. (2015) and revisited by Bourrier et al. (2016) (B16 in Figure 5) to include interactions of the planetary outflow with the stellar wind. The values (red solid line) are calculated directly from the simulated Ly profiles of Visit 2 from Bourrier et al. (2016). Note that we follow both Ehrenreich et al. (2015) and Bourrier et al. (2016) by only integrating the absorbed Ly flux between km s-1 and km s-1.
To construct the H absorption from the Ly measurements, we assume a simple Gaussian line profile shape for Ly and fit the optical depth, line center, and line width to the simulated line profile from Bourrier et al. (2016). We then use this simplified line profile to solve for the column density:
| (3) |
where is the Ly oscillator strength, is the electron charge, is the electron mass, is the Ly rest wavelength, is the speed of light in vacuum, and is the optical depth at line center. We assume various excited-to-ground state ratios for the hydrogen atoms which gives the column density, , based on and, using the same line widths, calculate the corresponding H line profile at each time. The model values are then calculated from the approximated line profiles. However, since H is unaffected by interstellar absorption, we integrate from km s-1 to km s-1 to simulate the measurements made from our observations. We do not integrate from to km s-1 since this contributes nothing to for the model line profiles. We assume that the column density at each time is constant across the stellar disk and that the entire disk is occulted by the hydrogen cloud (Ehrenreich et al. 2015, see Figure 3 of). The Gaussian approximations to the Ly model profiles and the treatment of the column density from Equation 3 yields a median column density of cm-2. We caution that more precise column densities, as a function of velocity, should be retrieved from the full model output of Bourrier et al. (2016).
The model values are shown as dashed-dotted lines in Figure 5 for excited-to-ground state ratios =10-3 (steel blue) and 10-4 (dark green). Note that the right-hand axis gives the Ly model values while the left-hand axis corresponds to values, both for the model and data. Our simulated values show that, based on the Bourrier et al. (2016) model, only for optimistic ratios of 10-3 would the cloud absorption be detectable in our observations. Including hydrogen excitation in a model similar to that from Bourrier et al. (2016) would be useful in order to produce more realistic estimates of the excited hydrogen absorption. Our first-order estimates suggest that 10-4 throughout the neutral hydrogen cloud. This is a fairly weak constraint and could be improved with more sensitive observations from 8-10 meter class telescopes.
V Extended atmosphere models
In this section we explore spherically symmetric atmospheres as a first approximation to placing upper limits on the size of the excited hydrogen atmosphere around each planet. Two parameters control the absorption strength: the radial extent of the atmosphere, which determines the depth of the line, and density, which can produce opacity broadening if the column densities are large enough. We take the atmospheres to be of uniform density and we present 1 limits in two cases: 1. varying the density and radial extent of the atmosphere to produce a value of detectable at the 1 level; 2. varying the density of a filled Hill sphere, i.e., a fixed radial extent. In both cases, we restrict the line depth to less than the 1 flux limit. In Case 1, the line depth restriction is the main determinant of the radial extent. The filled Hill sphere is an extreme case for KELT-3 b, which has a fairly high surface gravity (see Table 3), but GJ 436 b is known to be experiencing significant mass loss and overflowing its Hill sphere (Ehrenreich et al. 2015). The choice of uniform density is motivated by the findings of Christie et al. (2013) who calculated H absorption in the atmosphere of HD 189733 b.
The model consists of a uniform density atmosphere surrounding the planet at mid-transit. Planetary and stellar parameters used in the model are given in Table 3. All parameters for the KELT-3 system are taken from Pepper et al. (2013). The GJ 436 transit data are taken from Knutson et al. (2014) and the planetary mass and stellar parameter are taken from Torres et al. (2008). We fill a 3D grid with material at the specified density and extinct the intensity from the star that is obscured by those grid points. The line profile is approximated as a Doppler–broadened delta function (Draine 2011) with an intrinsic width of km s-1. This value is chosen based on the line width necessary to reproduce the in-transit H transmission spectra from Cauley et al. (2015); Cauley et al. (2016). For simplicity and due to fact that no signal is detected in any measurements, we neglect any broadening from stellar or planetary rotation. We also neglect any limb darkening effects from the star. The flux from the unobscured portions of the stellar disk are then added to the absorbed grid points and the final summed line profile is normalized. The line profile is then convolved with a Gaussian of FWHM 15 km s-1 to approximate the Hydra instrumental profile.
To determine the case 1 and case 2 limits, we take the flux uncertainties from the observed transmission spectra and apply them uniformly to the model spectra. We then propagate the flux errors in quadrature when calculating . The limits are determined when the model signal approaches the 1 level. Limits are derived only for the nights of 2016–02–04 and 2016–02–23 due to the higher quality of data. For the filled Hill sphere, or Case 2, we vary the density until the line depth approaches the 1 flux uncertainty. Note that in this case the extended atmosphere is very optically thin whereas in Case 1 the lines are highly optically thick.
| Transit duration | |||||||||||
|---|---|---|---|---|---|---|---|---|---|---|---|
| Object | () | () | () | (days) | (au) | (K) | () | (hours) | () | () | (K) |
| (1) | (2) | (3) | (4) | (5) | (6) | (7) | (8) | (9) | (10) | (11) | (12) |
| KELT-3 | 1.48 | 1.35 | 4.59 | 2.70 | 0.041 | 1822 | 0.61 | 3.158 | 1.28 | 1.47 | 6304 |
| GJ 436 | 0.07 | 0.38 | 5.83 | 2.64 | 0.0292 | 650 | 0.85 | 0.881 | 0.45 | 0.46 | 3350 |
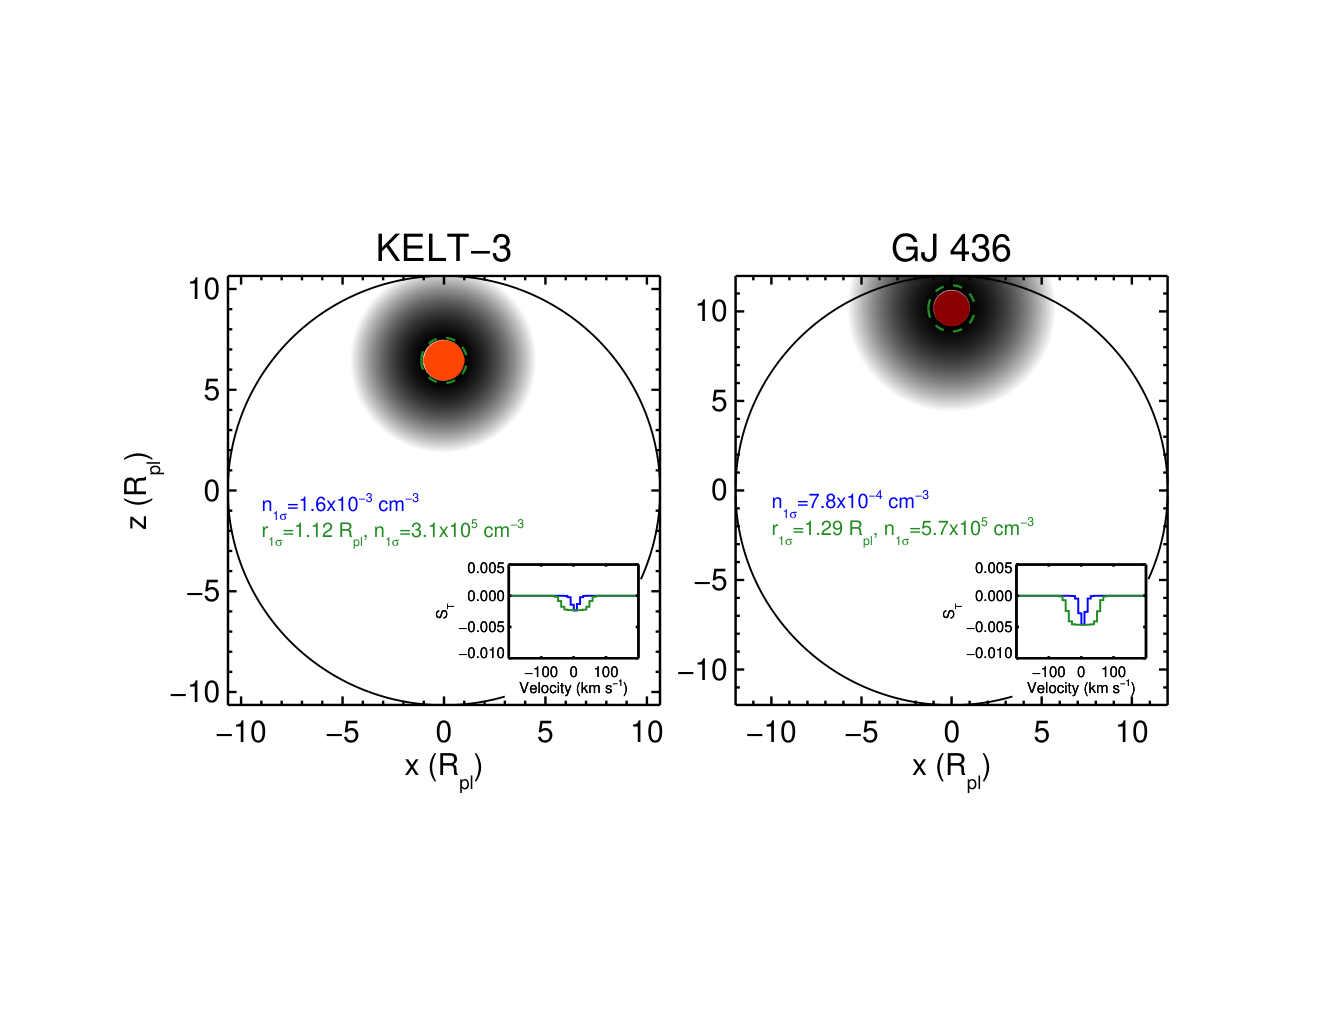
Figure 6shows diagrams of the mid-transit geometry and the limits for both cases. The model line profiles for each case are inset in the bottom-right. The radial 1 limits are perhaps more interesting: it is clear that the signal-to-noise of the data, for either object, is not high enough to rule out significant extended atmospheres of excited hydrogen. In the case of GJ 436 b, this limit extends to almost 1.3 . Given the suggested extent of the escaping neutral hydrogen envelope, it is plausible that the base layer, which we are not sensitive enough to probe, could produce absorption detectable with an 8-10 meter class telescope. We note that this base thermospheric layer is independent of the outflowing material so the limits derived here are not applicable. The brightness of KELT-3 would allow a similar detection if excited hydrogen exists out to 1.1 in similar densities to what we’ve modeled here. We note that the 1 density limits derived for the limited radial atmospheres are fairly large and that non-negligible absorption produced by lower densities is certainly plausible.
The case of KELT-3 b can be compared to the simulations by Salz et al. (2016) for the hot planet WASP-77 b (Maxted et al. 2013), which has a slightly larger surface gravity and similar equilibrium temperature. These fairly compact planets have neutral-to-ionized layers that form closer to the planet (Salz et al. 2016, see Figure 8 of ), reducing the strength of the potential H transmission signal. Thus although the temperatures in the thermosphere are on the order K, there is little neutral hydrogen beyond 1.2 .
One explanation for the lack of H absorption around GJ 436 b, despite the fact that large quantities of neutral hydrogen are clearly present (Ehrenreich et al. 2015), is the amount of EUV flux received by the planet. Christie et al. (2013) found that the H absorption measured by Jensen et al. (2012) required an ionization rate larger than the nominal value by a factor of 3.5. This suggests that a significant population requires a large amount of EUV and XUV flux. The estimated EUV and XUV flux from GJ 436 is lower than that of HD 189733 by 1.5 magnitudes, in both cases (Salz et al. 2016). Thus although there is abundant neutral hydrogen around the planet, it is likely almost entirely in the ground state, a conclusion that is supported by the time series analysis in Section IV. The low peak temperature of 5000 K in the thermosphere, as simulated by Salz et al. (2016), may also be the reason for the lack of hydrogen: an excitation temperature of 14300 K is needed to produce . However, we caution that hot planets experience highly non-equilibrium conditions and thus cannot be assumed to have a single steady-state temperature in their extended atmospheres. Variability in absorption signatures in ground-state and excited hydrogen may be connected with the variable activity levels of the host star.
VI Summary and conclusions
We have presented a search for excited hydrogen absorption in H for the exoplanets KELT-3 b and GJ 436 b using the high-resolution Bench Spectrograph with Hydra on the WIYN 3.5-meter telescope. We report no detections of an extended atmosphere for either transit of either target. We also find no evidence for absorption by unbound circumplanetary material. We derive limits on the radial extent of uniform density atmospheres of hydrogen and find that both planets may host non-negligible atmospheres that produce line profiles below the signal-to-noise threshold of our observations. More sensitive observations with larger aperture telescopes could probe below these limits.
Our exploratory observations demonstrate the approximate limits of high-resolution transmission spectroscopy with 4-meter class telescopes. Future missions such as the Transiting Exoplanet Survey Satellite (TESS) will find many hot planets orbiting nearby bright stars. We also expect TESS to find a significant number of hot planets transiting active stars, which will be the preferred targets for detecting H absorption based on the results here and in Jensen et al. (2012) and Cauley et al. (2015); Cauley et al. (2016). These bright systems will also be ideal targets for 4-meter class transmission spectroscopy, allowing more efficient atmosphere detections and freeing up larger telescopes for observations of fainter targets. New methods for detecting extended atmospheres are needed once HST is retired and before the next space-based UV observatory is commissioned. Searching for Balmer line absorption with ground-based optical spectrographs offers a possible solution.
Acknowledgments: The authors thank the referee for their comments, which helped improve this manuscript. Data presented herein were obtained at the WIYN Observatory from telescope time allocated to NN-EXPLORE through the scientific partnership of the National Aeronautics and Space Administration, the National Science Foundation, and the National Optical Astronomy Observatory. This work was supported by a NASA WIYN PI Data Award, administered by the NASA Exoplanet Science Institute. This work was also completed with support from the National Science Foundation through Astronomy and Astrophysics Research Grant AST-1313268 (PI: S.R.). A. G. J. is supported by NASA Exoplanet Research Program grant 14-XRP142-0090 to the University of Nebraska-Kearney. This work has made use of NASA’s Astrophysics Data System. The authors would like to acknowledge Marla Geha for supplying the basic Hydra IDL reduction routines. We are also grateful to Vincent Bourrier and David Ehrenreich for providing the GJ 436 Ly model data.
References
- Astudillo-Defru & Rojo (2013) Astudillo-Defru, N., & Rojo, P. 2013, A&A, 557, 56
- Ballester et al. (2007) Ballester, G., Sing, D. K., & Herbert, F. 2007, Nature, 445, 511
- Barden et al. (1992) Barden, S. C., Armandroff, T., Massey, P., Groves, L., Rudeen, A. C., Vaughnn, D., and Muller, G. 1992, Hydra: Kitt Peak Multi-Object Spectroscopic System, in Fibre Optics in Astronomy II, ed. Peter M. Gray, A.S.P. conference series Vol. 37, p. 185.
- Barnes et al. (2016) Barnes, J. R., Haswell, C. A., Staab, D., & Anglada-Escudé, G. 2016, MNRAS, 462, 1012
- Ben-Jaffel & Ballester (2013) Ben-Jaffel, L., & Ballester, G. E. 2013, A&A, 553, A52
- Berta et al. (2011) Berta, Z. K., Charbonneau, D., Bean, J., et al. 2011, ApJ, 736, 12
- Bourrier et al. (2013) Bourrier, V., Lecavelier des Etangs, A., Dupuy, H., et al. 2013, A&A, 551, A63
- Bourrier et al. (2016) Bourrier, V., Lecavelier des Etangs, A., Ehrenreich, D., Tanaka, Y. A., & Vidotto, A. A. 2016, A&A, 591, A121
- Brogi et al. (2016) Brogi, M., de Kok, R. J., Albrecht, S., et al. 2016, ApJ, 817, 106
- Butler et al. (2004) Butler, R. P., Vogt, S. S., Marcy, G. W., et al. 2004, ApJ, 617, 580
- Cauley et al. (2015) Cauley, P. W., Redfield, S., Jensen, A. G., et al. 2015, ApJ, 810, 13
- Cauley et al. (2016) Cauley, P. W., Redfield, S., Jensen, A. G., & Barman, T. 2016, AJ, accepted
- Charbonneau et al. (2005) Charbonneau, D., Allen, L. E., Megeath, S. T., et al. 2005, ApJ, 626, 523
- Christie et al. (2013) Christie, D., Arras, P., & Li, Z.-Y. 2013, ApJ, 772, 144
- Draine (2011) Draine, B. T. 2011, Physics of the Interstellar and Intergalactic Medium (Princeton University Press, Princeton, NJ)
- Ehrenreich et al. (2012) Ehrenreich, D., Bourrier, V., Bonfils, X., et al. 2012, A&A, 547, 18
- Ehrenreich et al. (2015) Ehrenreich, D., Bourrier, V., Wheatley, P. J., et al. 2015, Nature, 522, 459
- Fossati et al. (2010) Fossati, L., Haswell, C. A., Froning, C. S., et al. 2010, ApJ, 714, L222
- Jensen et al. (2012) Jensen, A. G., Redfield, S., & Endl, M., et al. 2012, ApJ, 751, 86
- Knutson et al. (2014) Knutson, H. A., Benneke, B., Deming, D., & Homeier, D. 2014, Nature, 505, 66
- Kulow et al. (2014) Kulow, J. R., France, K., Linsky, J., & Loyd, R. O. P. 2014, ApJ, 786, 132
- Laughlin et al. (2011) Laughlin, G., Crismanti, M., & Adams, F. C. 2011, ApJ, 729, 7
- Lecavelier des Etangs et al. (2010) Lecavelier des Etangs, A., Ehrenreich, D., Vidal-Madjar, A., et al. 2010, A&A, 514, A72
- Lecavelier des Etangs et al. (2012) Lecavelier des Etangs, A., Bourrier, A., Wheatley, P. J., et al. 2012, A&A, 543, L4
- Louden & Wheatley (2015) Louden, T., & Wheatley, P. J. 2015, ApJL, 814, L24
- Maxted et al. (2013) Maxted, P. F. L., Anderson, D. R., Collier Cameron, A., et al. 2013, PASP, 125, 48
- Pepper et al. (2013) Pepper, J., Siverd, R. J., Beatty, T. G., et al. 2013, ApJ, 773, 64
- Salz et al. (2016) Salz, M., Czesla, S., Schneider, P. C., & Schmitt, J. H. M. M. 2016, A&A, 586, 75
- Snellen et al. (2010) Snellen, I. A. G., de Kok, R. J., de Mooij, E. J. W., & Albrecht, S. 2010, Nature, 465, 1049
- Torres et al. (2008) Torres, G., Winn, J. N., & Holman, M. J. 2008, ApJ, 677, 1324
- Turner et al. (2016) Turner, J. D., Pearson, K. A., Biddle, L. I., et al. 2016, MNRAS, 459, 789
- Vidal-Madjar et al. (2003) Vidal-Madjar, A., Lecavelier des Etangs, A., Désert, J.-M., et al. 2003, Nature, 422, 143
- Wyttenbach et al. (2015) Wyttenbach, A., Ehrenreich, D., Lovis, C., Udry, S., & Pepe, F. 2015, A&A, 577, A62