∎
HellRank: A Hellinger-based Centrality Measure
for Bipartite Social Networks
Abstract
Measuring centrality in a social network, especially in bipartite mode, poses many challenges. For example, the requirement of full knowledge of the network topology, and the lack of properly detecting top- behavioral representative users. To overcome the above mentioned challenges, we propose HellRank, an accurate centrality measure for identifying central nodes in bipartite social networks. HellRank is based on the Hellinger distance between two nodes on the same side of a bipartite network. We theoretically analyze the impact of this distance on a bipartite network and find upper and lower bounds for it. The computation of the HellRank centrality measure can be distributed, by letting each node uses local information only on its immediate neighbors. Consequently, one does not need a central entity that has full knowledge of the network topological structure. We experimentally evaluate the performance of the HellRank measure in correlation with other centrality measures on real-world networks. The results show partial ranking similarity between the HellRank and the other conventional metrics according to the Kendall and Spearman rank correlation coefficient.
Keywords:
Bipartite Social NetworksTop- Central NodesHellinger Distance Recommender Systems1 Introduction
Social networks have become a very important social structure of our modern society with hundreds of millions of users nowadays. With the growth of information spread across various social networks, the question of “how to measure the relative importance of users in a social network?” has become increasingly challenging and interesting, as important users are more likely to be infected by, or to infect, a large number of users. Understanding users’ behaviors when they connect to social networking sites creates opportunities for richer studies of social interactions. Also, finding a subset of users to statistically represent the original social network is a fundamental issue in social network analysis. This small subset of users (the behaviorally-representative users) usually plays an important role in influencing the social dynamics on behavior and structure.
The centrality measure is widely used in social network analysis to quantify the relative importance of nodes within a network. The most central nodes are often the nodes that have more weight, both in terms of the number of interactions as well as the number of connections to other nodes Silva2013. In social network analysis, such a centrality notion is used to identify influential users Mahyar2015TopK; Silva2013; Wei2013; Yustiawan2015, as the influence of a user is the ability to popularize a particular content in the social network. To this end, various centrality measures have been proposed over the years to rank the network nodes according to their topological and structural properties Cha2010; Friedkin2011; Zhao2013. These measures can be considered as several points of view with different computational complexity, ranging from low-cost measures (e.g., Degree centrality) to more costly measures (e.g., Betweenness and Closeness centralities) Wehmuth2013; Technology2015. The authors of Stephenson1989 concluded that centrality may not be restricted to shortest paths. In general, the global topological structure of many networks is initially unknown. However, all these structural network metrics require full knowledge of the network topology Wehmuth2013; Mahyar2015CScomdet.
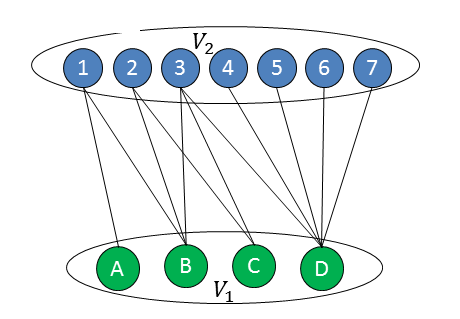
An interesting observation is that many real-world social networks have a bi-modal nature that allows the network to be modeled as a bipartite graph (see Figure 1). In a bipartite network, there are two types of nodes and the links can only connect nodes of different types Zhao2013. The Social Recommender System is one of the most important systems that can be modeled as a bipartite graph with users and items as the two types of nodes, respectively. In such systems, the centrality measure can have different interpretations from conventional centrality measures such as Betweenness, Closeness, Degree, and PageRank Kitsak2010. The structural metrics, such as Betweenness and Closeness centrality, are known as the most common central nodes’ identifier in one-mode networks, although in bipartite social networks they are not usually appropriate in identifying central users that are perfect representative for the bipartite network structure. For example, in a social recommender system mahyar2017recommender; taheri2017recommender, that can be modeled by the network graph in Figure 1, user is associated with items that have too low connections and have been considered less often by other users; meanwhile user is considered as the most central node based on these common centrality metrics, because it has more connections. However user is much more a real representative than in the network. In the real-world example of an online store, if one user buys a lot of goods, but these goods are low consumption, and another buys fewer goods, but these are widely, we treat the second user as being a synechdochic representative of all users of the store. This is quite different from a conventional centrality metric outcome.
Another interesting observation is that the common centrality measures are typically defined for non-bipartite networks. To use these measures in bipartite networks, different projection methods have been introduced to converting bipartite to monopartite networks Zhou2007; Sawant2013. In these methods, a bipartite network is projected by considering one of the two node sets and if each pair of these nodes shares a neighbor in the network, two nodes will be connected in the projected one-mode network Latapy2008; Liebig2014. One of the major challenges is that every link in a real network is formed independently, but this does not happen in the projected one-mode network. Because of lack of independency in the formation of links in the projected network, analysis of the metrics that use the random network Erdos1959 as a basis for their approach, is difficult. Classic random networks are formed by assuming that links are being independent from each other Opsahl2013. The second challenge is that the projected bipartite network nodes tend to form Cliques. A clique is a fully connected subset of nodes that all of its members are neighbors. As a result, the metrics that are based on triangles (i.e., a clique on three nodes) in the network, can be inefficient (such as structural holes or clustering coefficient measures) Wasserman1994; Opsahl2013.
Despite the fact that the projected one-mode network is less informative than its corresponding bipartite representation, some of the measures for monopartite networks have been extended to bipartite mode Kitsak2011; Opsahl2013. Moreover, because of requirement of full knowledge of network topology and lack of proper measure for detection of more behavioral representative users in bipartite social networks, the use of conventional centrality measures in the large-scale networks (e.g. in recommender systems) is a challenging issue. In order to overcome the aforementioned challenges and retain the original information in bipartite networks, proposing an accurate centrality measure in such networks seems essential Armour2014a; Liebig2014.
Motivated by these observations and taking into account users’ importance indicators for detection of central nodes in social recommender systems, we introduce a new centrality measure, called HellRank. This measure identifies central nodes in bipartite social networks. HellRank is based on the Hellinger distanceNikulin2001, a type of f-divergence measure, that indicates structural similarity of each node to other network nodes. Hence, this distance-based measure is accurate for detecting the more behavioral representative nodes. We empirically show that nodes with high HellRank centrality measure have relatively high Degree, Betweenness and PageRank centrality measures in bipartite networks. In the proposed measure, despite of different objectives to identify central nodes, there is a partial correlation between HellRank and other common metrics.
The rest of the paper is organized as follows. In Section 2, we discuss related work on behavioral representative and influence identification mechanisms. We also discuss centrality measures for bipartite networks, and highlight the research gap between our objectives and previous work. In Section 3, we introduce our proposed measure to solve the problem of centrality in bipartite networks. Experimental results and discussions are presented in Section 4. We conclude our work and discuss the future works in Section 5.
2 Related Work
We organize the relevant studies on social influence analysis and the problem of important users in three different categories. First, in Section 2.1, we study existing work on behavioral representative users detection methods in social networks. Second, in Section 2.2, we review previous mechanisms for identifying influential users in social networks by considering the influence as a measure of the relative importance. Third, in Section 2.3, we focus in more details on centrality measures for bipartite networks.
2.1 Behavioral Representative Users Detection
Unlike influence maximization, in which the goal is to find a set of nodes in a social network who can maximize the spread of influence chen2009efficient; kempe2003maximizing, the objective of behavioral representative users detection is to identify a few average users who can statistically represent the characteristics of all users landauer1988research. Another type of related work is social influence analysis. anagnostopoulos2008influence and singla2008yes proposed methods to qualitatively measure the existence of influence. crandall2008feedback studied the correlation between social similarity and influence. tang2009social presented a method for measuring the strength of such influence. The problem of sampling representative users from social networks is also relevant to graph sampling leskovec2006sampling; maiya2011benefits; ugander2013graph. zhu2007improving introduced a novel ranking algorithm called GRASSHOPPER, which ranks items with an emphasis on diversity. Their algorithm is based on random walks in an absorbing Markov chain. benevenuto2009characterizing presented a comprehensive view of user behavior by characterizing the type, frequency, and sequence of activities users engage in and described representative user behaviors in online social networks based on clickstream data. giroire2008cubicle found significant diversity in end-host behavior across environments for many features, thus indicating that profiles computed for a user in one environment yield inaccurate representations of the same user in a different environment. maia2008identifying proposed a methodology for characterizing and identifying user behaviors in online social networks.
However, most existing work focused on studying the network topology and ignored the topic information. sun2013learning aimed to find representative users from the information spreading perspective and ahmed2014network studied the network sampling problem in the dynamic environment. papagelis2013sampling presented a sampling-based algorithm to efficiently explore a user’s ego network and to quickly approximate quantities of interest. davoodi2012social focused on the use of the social structure of the user community, user profiles and previous behaviors, as an additional source of information in building recommender systems. tang2015sampling presented a formal definition of the problem of sampling representative users from social network.
2.2 Identifying Influential Users
Goyal2010 studied how to infer social probabilities of influence by developing an algorithm to scan over the log of actions of social network users using real data. Bharathi2007; Tang2009 focused on the influence maximization problem to model the social influence on large networks. TwitterRank, as an extension of PageRank metric, was proposed by Weng2010 to identify influential users in Twitter. Chen2013 used the Susceptible-Infected-Recovered (SIR) model to examine the spreading influence of the nodes ranked by different influence measures. Xu2012 identified influencers using joint influence powers through Influence network. Zhu2013 identified influencial users by using user trust networks. Li2014 proposed the weighted LeaderRank technique by replacing the standard random walk to a biased random walk. sun2014sparsity presented a novel analysis on the statistical simplex as a manifold with boundary and applied the proposed technique to social network analysis to rank a subset of influencer nodes. Tang2012 proposed a new approach to incorporate users’ reply relationship, conversation content and response immediacy to identify influential users of online health care community. Du2014 used multi-attribute and homophily characteristics in a new method to identify influential nodes in complex networks.
In the specific area of identifying influential users in bipartite networks, Beguerisse-Diaz2009 presented a dynamical model for rewiring in bipartite networks and obtained time-dependent degree distributions. Liebig2014 defined a bipartite clustering coefficient by taking differently structured clusters into account, that can find important nodes across communities. The concept of clustering coefficient will be discussed in further detail in the Section 2.2.1.
2.2.1 Clustering Coefficient
This measure shows the nodes’ tendency to form clusters and has attracted a lot of attention in both empirical and theoretical work. In many real-world networks, especially social networks, nodes are inclined to cluster in densely connected groups Opsahl2009. Many measures have been proposed to examine this tendency. In particular, the global clustering coefficient provides an overall assessment of clustering in the network Luce1949, and the local clustering coefficient evaluates the clustering value of the immediate neighbors of a node in the network Watts1998.
The global clustering coefficient is the fraction of 2-paths (i.e., three nodes connected by two links) that are closed by the presence of a link between the first and the third node in the network. The local clustering coefficient is the fraction of the links among a node’s interactions over the maximum possible number of links between them Watts1998; Opsahl2013.
Due to structural differences, applying these general clustering coefficients directly to a bipartite network, is clearly not appropriate Borgatti1997, Thus the common metrics were extended or redefined, and different clustering measures were defined in these networks. In one of the most common clustering coefficients in bipartite networks, 4-period density is measured instead of triangles Robins2004; Zhang2008. However, this measure could not consider the triple closure concept in the clustering as it actually consists of two nodes. This kind of measure can only be a measure of the level of support between two nodes rather than the clustering of a group of nodes. Accordingly, Latapy2008 defined the notion of clustering coefficient for pairs of nodes capturing correlations between neighborhoods in the bipartite case. Addtionally, Opsahl2013 considered the factor, , as the ratio of the number of closed 4-paths () to the number of 4-paths (), as:
| (1) |
2.3 Centrality Measures for Bipartite Networks
Various definitions for centrality have been proposed in which centrality of a node in a network is generally interpreted as the relative importance of that node freeman1978centrality; Chen2013. Centrality measures has attracted a lot of attentions as a tool to analyze various kinds of networks (e.g. social, information, and biological networks) Faust1997; Kang2011. In this section, we consider a set of well-known centrality measures including Degree, Closeness, Betweenness, Eigenvector and PageRank, all of them redefined for bipartite networks. Given bipartite network , where and are the two sides of network with and . The link set includes all links connecting nodes of to nodes of . For the network in Figure 1, and are equal to 4 and 7, respectively. Let be the adjacency matrix of this network, as shown below: