Incidence of H i 21-cm absorption in strong Fe ii systems at
Abstract
We present the results from our search for H i 21-cm absorption in a sample of 16 strong Fe ii systems ((Mg ii 2796) 1.0 Å and (Fe ii 2600) or 1 Å) at using the Giant Metrewave Radio Telescope and the Green Bank Telescope. We report six new H i 21-cm absorption detections from our sample, which have increased the known number of detections in strong Mg ii systems at this redshift range by 50%. Combining our measurements with those in the literature, we find that the detection rate of H i 21-cm absorption increases with , being four times higher in systems with 1 Å compared to systems with 1 Å. The (H i) associated with the H i 21-cm absorbers would be cm-2, assuming a spin temperature of 500 K (based on H i 21-cm absorption measurements of damped Lyman- systems at this redshift range) and unit covering factor. We find that H i 21-cm absorption arises on an average in systems with stronger metal absorption. We also find that quasars with H i 21-cm absorption detected towards them have systematically higher values than those which do not. Further, by comparing the velocity widths of H i 21-cm absorption lines detected in absorption- and galaxy-selected samples, we find that they show an increasing trend (significant at 3.8) with redshift at , which could imply that the absorption originates from more massive galaxy haloes at high-. Increasing the number of H i 21-cm absorption detections at these redshifts is important to confirm various trends noted here with higher statistical significance.
Keywords:
galaxies: quasar: absorption line galaxies: ISM1 Introduction
The resonant absorption lines of Mg ii detected towards background quasars have proved to be excellent probes of the gaseous haloes and circumgalactic medium (CGM) of 2 galaxies in a luminosity-unbiased way (Lanzetta et al., 1987; Sargent et al., 1988; Petitjean & Bergeron, 1990; Bergeron & Boissé, 1991; Steidel & Sargent, 1992; Srianand & Khare, 1994; Steidel, 1995; Nestor et al., 2005; Prochter et al., 2006; Quider et al., 2011; Zhu & Ménard, 2013). While weak Mg ii absorbers (i.e. absorbers having rest equivalent width of Mg ii , 1.0 Å) could be tracing co-planar accreting or recycled gas (Chen et al., 2010a; Chen et al., 2010b; Kacprzak et al., 2011; Kacprzak & Churchill, 2011; Lovegrove & Simcoe, 2011, e.g.), strong Mg ii absorbers (i.e. absorbers having 1.0 Å) are believed to be tracing galactic winds or outflows (Zibetti et al., 2007; Bouché et al., 2007; Weiner et al., 2009; Lundgren et al., 2009; Gauthier et al., 2009; Noterdaeme et al., 2010; Rubin et al., 2010; Ménard et al., 2011; Nestor et al., 2011, e.g.). Strong Mg ii absorbers at 1.65 have been shown to trace gas with high neutral hydrogen column densities (Rao et al., 2006, hereafter R06), like damped Lyman- systems (DLAs; (H i) cm-2; see Wolfe et al., 2005, for a review). Further, the incidence of DLAs among Mg ii absorbers is found to increase at high- (Matejek et al., 2013, 26;). Murphy et al. (2007) have found a correlation between metallicity and in DLAs, similar to the velocity-metallicity relation seen in DLAs (Ledoux et al., 2006; Prochaska et al., 2008a).
The strong Mg ii systems in the Mg ii absorber-galaxy catalog of Nielsen et al. (2013) sample a wide range of galaxy impact parameters, i.e. over 10200 kpc. Hence, such strong Mg ii absorbers can trace gas in a wide variety of environments like star-forming discs, CGM, galactic winds and outflows. It is likely that is dominated by high column density when the sightlines probe the galactic discs and by velocity spread of the absorbing gas in the other scenarios. If one is interested in studying the cold dense gas around galaxies, other parameters like equivalent width ratios of metal lines are required to select sightlines that probe low impact parameters. R06 have demonstrated that equivalent width ratios of Mg ii, Mg i and Fe ii absorption can be used to pre-select DLAs more successfully than by just using . They detect DLAs with a success rate of 42% by selecting Mg ii absorbers with and Å.
Further insights into the origin and physical conditions prevailing in the strong Mg ii systems and DLAs can be obtained by studying their associated H i 21-cm absorption. H i 21-cm absorption is an excellent tracer of the cold neutral medium (CNM; few 100 K) of galaxies (Kulkarni & Heiles, 1988), and has been observed to arise at small impact parameters ( 30 kpc) from 0.4 galaxies (Dutta et al., 2016). There have been numerous searches for H i 21-cm absorption in Mg ii systems and DLAs (Briggs & Wolfe, 1983; Lane, 2000; Kanekar & Chengalur, 2003; Curran et al., 2005; Gupta et al., 2009; Kanekar et al., 2009; Curran et al., 2010; Srianand et al., 2012; Gupta et al., 2012; Kanekar et al., 2014, e.g.). Gupta et al. (2009, hereafter G09 and G12, respectively); Gupta et al. (2012, hereafter G09 and G12, respectively) have shown that the H i 21-cm detection rate in strong Mg ii systems can be enhanced with appropriate equivalent width ratio cuts of Mg ii, Fe ii and Mg i.
In addition, searches of H i 21-cm absorption in samples of Mg ii systems and DLAs can be used to trace the redshift evolution of the CNM fraction in galaxies. Spin temperature () measurements and upper limits, derived using H i 21-cm optical depth and (H i) measured from DLAs, suggest that most of the gas along these sightlines traces the diffuse warm neutral medium (WNM; 104 K), and a small fraction of the total (H i) along these sightlines is associated with the CNM (Srianand et al., 2012; Kanekar et al., 2014). This is also supported by observations of typically low overall molecular fractions of in DLAs (Petitjean et al., 2000; Ledoux et al., 2003; Srianand et al., 2005; Noterdaeme et al., 2008), and physical conditions inferred in DLAs using C ii* and Si ii* fine structure lines (Neeleman et al., 2015). The above studies have indicated that the CNM covering factor in DLAs and Mg ii systems may be small (10-20%). On the other hand, Heiles & Troland (2003), using H i 21-cm emission and absorption measurements, have found that 40% of the H i gas is in the CNM in the Milky Way. Since the volume filling factor and the physical conditions of the CNM depend on feedback processes related to the in situ star formation (McKee & Ostriker, 1977; Wolfire et al., 1995; de Avillez & Breitschwerdt, 2004; Gent et al., 2013; Gatto et al., 2015), understanding the redshift evolution of H i 21-cm absorbers can shed light on the star formation history of galaxies as well.
In this work we wish to explore the connection between Mg ii systems, DLAs and cold H i gas by searching for H i 21-cm absorption in a sample of strong Mg ii systems, that satisfy additional constraints to increase the efficiency of detecting cold gas. Systems showing Si ii or C i absorption would have been excellent targets to search for cold gas, since strong Si ii absorption is likely to select high metallicity gas (Prochaska et al., 2008a; Jorgenson et al., 2013), whereas C i absorption is likely to probe dense molecular regions (Noterdaeme et al., 2011; Noterdaeme et al., 2016). However, the strong transitions of Si ii 1526 and C i 1656 are not covered simultaneously with the Mg ii doublet lines of the same system for a large redshift range. On the other hand, similar to the Mg ii doublet, strong Fe ii lines, like the 2600 Å transition, can be observed with ground-based telescopes at 0.42.5.
Strong Fe ii systems can arise from either very high metallicity sub-DLAs or high (H i) DLAs (Srianand, 1996). The H i 21-cm optical depth is directly proportional to (H i) and inversely to . There are indications for a weak anti-correlation between and the gas phase metallicity (see Kanekar et al., 2014, and references therein). Further, strong absorption from Mg ii ( 1 Å) and Fe ii (rest equivalent width of Fe ii 2600, 1 Å) are usually detected whenever galaxy nebular emission lines are directly detected in the Sloan Digital Sky Server (York et al., 2000, SDSS;) quasar spectra, indicating that impact parameters are 10 kpc (Noterdaeme et al., 2010, Joshi et al. 2016, in preparation). We also notice that 77% of the Mg ii systems showing signatures of 2175 Å bump studied by Jiang et al. (2011) have 1 Å. Hence, systems with strong Fe ii absorption could provide ideal targets for detecting high metallicity and/or high (H i) cold gas.
This paper is structured as follows. In Section 2, we describe the motivation behind our sample selection and give details of our sample. In Section 3, we describe our radio observations using the Giant Metrewave Radio Telescope (GMRT) and the Green Bank Telescope (GBT). The results from our search for H i 21-cm absorption are presented in Section 4. The detection rate of H i 21-cm absorption in strong Fe ii systems is discussed in Section 5. The connection of H i 21-cm absorption with metal line properties and dust content are discussed in Sections 6 and 7, respectively. Finally, we study the velocity width of the H i 21-cm absorption lines in Section 8. We summarize our results in Section 9. Throughout this work we have adopted a flat -cold dark matter cosmology with = 70 km s-1 Mpc-1 and = 0.30.
2 Sample Selection
While Mg ii absorption lines at 0.3 2.3 can be observed using ground-based optical telescopes, the atmospheric cutoff of light below 3000 Å restricts ground-based observations of H i lines at 1.5. However, ultraviolet (UV) spectroscopic observations with the Hubble Space Telescope (HST) make it possible to detect 1.65 DLAs and sub-DLAs (Rao et al., 2011; Meiring et al., 2011; Battisti et al., 2012; Turnshek et al., 2015; Neeleman et al., 2016, R06,). R06 have obtained UV observations of absorption in 197 Mg ii absorbers with 0.3 Å at 1.65, using the HST. Using their table 1, we plot the cumulative distribution of (H i) in absorbers with Å in left panel of Fig. 1. We also show the same for systems with both Å and Å, and for those with Å but Å11 1 For the cumulative distribution of systems with Å and Å, we use the subsamples 1 and 2 of R06, which were selected purely based on without any constraint on (see R06 for details), to avoid biases.. It can be seen that 32% of the Mg ii absorbers with 1.0 Å have (H i) cm-2. This fraction becomes 45% when the strong Mg ii absorbers also have 1.0 Å, i.e. strong Fe ii absorbers have a higher (by a factor of 1.4) probability of being DLAs. For comparison only 8% of the absorbers with 1.0 Å and 1.0 Å are DLAs. We note that the success rate of a 1.0 Å selection in detecting DLAs is consistent with that of a 2 selection suggested by R06 (see Section 1).
Next, from the SDSS Mg ii absorber catalog of Zhu & Ménard (2013), we identified 741 Mg ii absorbers at with 1.0 Å, which have been searched for absorption by Noterdaeme et al. (2012). In the right panel of Fig. 1 we show the cumulative distributions of (H i) in these systems, for the same three equivalent width cuts of Mg ii and Fe ii as described above. Note that Noterdaeme et al. (2012) provides (H i) measurements only for systems having (H i) cm-2. Hence, we show the cumulative distributions starting at (H i) = cm-2. Similar to above, we find that an additional cut of 1 Å increases the probability of selecting DLAs by a factor of 1.7 compared to just a 1 Å cut. It can be seen that 57% of the strong Fe ii absorbers are DLAs, compared to 34% of the absorbers with just 1.0 Å. Further, only 19% of the absorbers with 1.0 Å and 1.0 Å are DLAs.


From the above discussions it seems that a selection technique based on strong Fe ii absorption has higher (by a factor of 1.41.7) probability of detecting DLAs than that based solely on Mg ii absorption strength. Though, as can be seen from Fig. 1, for a limiting rest equivalent width of Fe ii, the DLA selection efficiency appears to decrease slightly with decreasing redshift. Similarly, Matejek et al. (2013), using infrared spectra of high- quasars, have found that the fraction of DLAs in Mg ii systems with 0.3 Å increases from 17% at 2 to 41% at 2. The metallicity in DLAs is known to decline with increasing redshift (Rafelski et al., 2014, e.g.). Hence, for a given equivalent width of Mg ii or Fe ii, the same absorber is likely to arise from a higher (H i) system at high- compared to at low-. This could be a possible explanation for a larger fraction of the strong Fe iiMg ii absorbers being DLAs at higher redshifts.
We set out to quantify the H i 21-cm absorption detection efficiency in such a strong Fe ii selected sample. Our sample of strong Fe ii absorbers is drawn from the Mg ii catalog of Zhu & Ménard (2013) constructed using the SDSS Data Release 12 (Alam et al., 2015, DR12;). We selected all the absorbers with 1.0 and 1.0, over the redshift ranges 0.51.0 and 1.11.5. Next, by cross-correlating the positions of the background quasars with radio sources within 1′′ radius in the Faint Images of the Radio Sky at Twenty-Centimeters (White et al., 1997, FIRST;) survey, we identified 17 and 18 strong Fe ii systems at 0.51.0 and 1.11.5, respectively, that are in front of quasars with peak flux density at 1.4 GHz greater than 100 mJy. The redshift ranges of 0.51.0 and 1.11.5 were chosen to enable observations with the GBT prime-focus PF1 800 MHz receiver and the GMRT 610 MHz receiver, respectively (see Section 3). The flux density cut of 100 mJy was used in order to achieve 3 integrated H i 21-cm optical depth sensitivity (for a line width of 10 km s-1) 0.3 km s-1, which is sensitive to detect 100 K gas with (H i) 51019 cm-2.
We visually inspected the optical spectra and radio images of the quasars to ensure that there are no false identifications. Among the 35 strong Fe ii absorbers, 11 are part of Mg ii samples that have been searched for H i 21-cm absorption in the literature 4 in G09, 3 in G12, 3 in Kanekar et al. (2009) (hereafter K09) and 1 in Lane (2000) (hereafter L00). From the remaining 24 systems, we selected 15 strong Fe ii absorbers, whose redshifted H i 21-cm frequencies fall in the radio frequency interference (RFI)-free observing bands of GBT and GMRT. In addition, we included the = 1.27384 Mg ii absorber towards J091927.61014603.0. Note that this system is not in the catalog of Zhu & Ménard (2013) and the peak flux density of the radio source from FIRST is less than 100 mJy (i.e. 59 mJy). But this system satisfies our criterion of 1.0 and 1.0, and has been identified as a 2175 Å absorber candidate by Jiang et al. (2011). Hence, our sample consists of 16 absorbers, of which seven (at 0.51.0) were observed with GBT, and nine (at 1.11.5) were observed with GMRT. The details of these 16 absorbers are presented in Table 1. The median values of various metal line parameters for our observed sample are: = 2.23 Å; = 1.55 Å; Mg ii doublet ratio, DR = 1.14; (Mg i 2852), R1 = 0.27; , R2 = 1.58.
| Quasar | SDSS | (Mg ii 2796) | (Mg ii 2803) | (Mg i 2852) | (Fe ii 2600) | ||
| name | name | (Å) | (Å) | (Å) | (Å) | ||
| (1) | (2) | (3) | (4) | (5) | (6) | (7) | (8) |
| J09190146 | J091927.61014603.0 | 1.286 | 1.2738 | 2.70 0.15 | 1.99 0.15 | 0.27 0.13 | 2.24 0.28 |
| J09216215 | J092136.22621552.5 | 1.447 | 1.1035 | 4.11 0.10 | 3.62 0.13 | 0.98 0.10 | 2.86 0.09 |
| J09525048 | J095227.30504850.6 | 1.091 | 0.9985 | 2.10 0.04 | 1.94 0.04 | 0.40 0.05 | 1.30 0.04 |
| J11113252 | J111131.77325255.8 | 2.362 | 1.4753 | 2.23 0.13 | 2.35 0.14 | 0.96 0.10 | 1.55 0.12 |
| J11114507 | J111114.81450735.0 | 1.486 | 0.6865 | 1.83 0.14 | 1.93 0.14 | 0.83 0.15 | 1.73 0.16 |
| J12011114 | J120140.25111447.6 | 2.296 | 1.4846 | 2.66 0.14 | 2.40 0.13 | 0.31 0.10 | 1.57 0.12 |
| J12416020 | J124129.57602041.3 | 2.066 | 1.2379 | 4.73 0.06 | 4.48 0.06 | 1.34 0.07 | 3.38 0.08 |
| J12452232 | J124557.77223205.3 | 1.478 | 0.5808 | 1.64 0.05 | 1.40 0.05 | 0.16 0.04 | 1.14 0.05 |
| J12551817 | J125531.75181750.9 | 1.371 | 0.7580 | 2.20 0.18 | 1.88 0.18 | 0.71 0.17 | 1.23 0.18 |
| J13274326 | J132720.97432627.9 | 2.086 | 0.9542 | 2.42 0.12 | 2.09 0.10 | 0.47 0.16 | 1.53 0.11 |
| J13425110 | J134224.31511012.4 | 2.598 | 1.4880 | 3.18 0.07 | 2.92 0.07 | 1.06 0.07 | 1.74 0.06 |
| J13510830 | J135116.91083039.8 | 1.442 | 1.4270 | 2.59 0.05 | 2.09 0.05 | 0.85 0.08 | 1.43 0.07 |
| J15042854 | J150426.69285430.5 | 2.285 | 1.2208 | 1.87 0.07 | 1.58 0.07 | 0.50 0.08 | 1.06 0.07 |
| J15101640 | J151038.63164010.2 | 1.827 | 1.2139 | 2.22 0.09 | 1.70 0.08 | 0.34 0.09 | 1.29 0.09 |
| J22190229 | J221930.79022945.4 | 2.218 | 0.9804 | 2.19 0.12 | 2.08 0.12 | 0.64 0.12 | 1.78 0.13 |
| J23301100 | J233040.84110018.6 | 1.502 | 0.9488 | 1.55 0.05 | 1.32 0.05 | 0.40 0.06 | 1.07 0.05 |
Notes. Column 1: quasar name used in this work. Column 2: SDSS name (J2000) of the quasar. Column 3: redshift of quasar. Column 4: redshift of intervening Fe ii system. Columns 5, 6, 7 and 8: rest frame equivalent widths (in Å) of the Mg ii 2796, Mg ii 2803, Mg i 2852 and Fe ii 2600 absorption lines, respectively, taken from Zhu & Ménard (2013) (except in case of J09190146, where we measure these ourselves).
The 1.4 GHz peak flux densities obtained by the FIRST survey of the radio sources in our sample are listed in Table 2. All the sources except one are compact (White et al., 1997, deconvolved sizes 2′′;) in the FIRST images (resolution 5′′). The radio source J15101640 is resolved in the FIRST image, with a deconvolved size of 2.91.3′′, and with the peak emission accounting for 86% of the total emission. Low-frequency (1.4 GHz) sub-arcsecond-scale images are not available for any of the sources in our sample. However, 2.3 GHz Very Long Baseline Array (VLBA) images are available for 8 of the sources from the VLBA Calibrator Survey (VCS)22 2 http://www.vlba.nrao.edu/astro/calib/. We assume that the covering factor () of the absorbing gas is equal to the core fraction, i.e. we assume that the gas covers only the core component seen in VLBA images. Hence, we estimate from the ratio of the peak flux density in the VCS image to the total arcsecond-scale flux density (see Table 2). The total arcsecond-scale flux densities at 2.3 GHz have been estimated by interpolating flux densities available from the NASA extragalactic database 33 3 https://ned.ipac.caltech.edu/ (Condon et al., 1998; Gregory & Condon, 1991).
| Quasar | 1.4 GHz Peak Flux | Morph. | |
|---|---|---|---|
| Density (mJy beam-1) | |||
| (1) | (2) | (3) | (4) |
| J09190146 | 59 | C | — |
| J09216215 | 1213 | C | 0.60 |
| J09525048 | 105 | C | 0.71 |
| J11113252 | 107 | C | — |
| J11114507 | 239 | C | — |
| J12011114 | 161 | C | — |
| J12416020 | 433 | C | 0.88 |
| J12452232 | 131 | C | — |
| J12551817 | 366 | C | 0.36 |
| J13274326 | 589 | C | 0.91 |
| J13425110 | 144 | C | — |
| J13510830 | 335 | C | 0.92 |
| J15042854 | 549 | C | 0.60 |
| J15101640 | 138 | R | — |
| J22190229 | 183 | C | — |
| J23301100 | 1174 | C | 0.59 |
Notes. Column 1: quasar name. Column 2: FIRST 1.4 GHz peak flux density in mJy beam-1. Column 3: morphology from FIRST image (5′′ resolution), where C is for compact and R is for resolved. Column 4: covering factor (assumed to be the core fraction) determined from 2.3 GHz VLBA images (see Section 2 for details).
3 Radio Observations
The seven systems at 0.51.0 were observed with the prime-focus PF1 800 MHz receiver at GBT (Proposal ID: 16A141). We used VEGAS as the backend with a bandwidth of 11.72 MHz split into 32768 channels (spectral resolution of 0.1 km s-1 per channel, velocity coverage 4000 km s-1). The observations were carried out in standard position switching mode, with 2 min spent on-source and same amount of time spent at the off-source position. A dump time of 2 s was used. The data were acquired in two linear polarization products, XX and YY. The nine systems at 1.11.5 were observed with the 610 MHz receiver at GMRT, using the 2 MHz baseband bandwidth split into 512 channels (spectral resolution 2 km s-1 per channel, velocity coverage 1000 km s-1). Data were acquired in two polarization products, LL and RR. Standard calibrators were regularly observed during the observations for flux density, bandpass, and phase calibrations. In both the GBT and the GMRT observations, the pointing centre was at the quasar coordinates and the band was centred at the redshifted H i 21-cm frequency.
The GMRT data were reduced using the National Radio Astronomy Observatory (NRAO) Astronomical Image Processing System (aips) following standard procedures as described in Gupta et al. (2010). The GBT data were reduced using a pipeline developed using NRAO’s gbtidl package as described in G12. The details of the radio observations of the sources are given in Table 3.
All the nine radio sources observed with GMRT, except J15101640, are compact in our GMRT images. Note that the sources, J11113252 (deconvolved size 2.20.2′′) and J13510830 (deconvolved size 2.00.9′′), are considered as compact since 90% of the total emission is contained in a single Gaussian component. In case of J15101640, the synthesized beam of our GMRT image is 6.23.9′′, and the radio emission can be represented by a single Gaussian component with deconvolved size 2.90.5′′, which contains 81% of the total emission, similar to the FIRST image. Note that in all the GMRT data cubes, the H i 21-cm absorption spectra were extracted at the location of the continuum peak flux density.
In case of seven radio sources observed with GBT, we obtained the flux density of five of them from the GBT spectrum. For two sources, J12551817 and J22190229, the flux scale could not be calibrated properly in our GBT observations. For these sources, the flux densities at the redshifted H i 21-cm frequency have been estimated by interpolating between the flux densities from the FIRST and the TEXAS (Douglas et al., 1996) surveys at 1.4 GHz and 365 MHz, respectively. The flux densities at the redshifted H i 21-cm frequency of all the radio sources observed by us are given in Table 4.
| Quasar | Date | Time | |
| (h) | (km s-1) | ||
| (1) | (2) | (3) | (4) |
| GBT | |||
| J09525048 | 18 February 2016 | 1.7 | 0.2 |
| 13 March 2016 | 0.7 | 0.2 | |
| 21 May 2016 | 0.7 | 0.2 | |
| J11114507 | 24 February 2016 | 1.0 | 0.1 |
| 11 March 2016 | 0.3 | 0.1 | |
| J12452232 | 18 February 2016 | 0.8 | 0.1 |
| J12551817 | 18 February 2016 | 0.6 | 0.1 |
| J13274326 | 24 February 2016 | 0.5 | 0.1 |
| 11 March 2016 | 0.2 | 0.1 | |
| 13 March 2016 | 0.6 | 0.1 | |
| J22190229 | 23 February 2016 | 0.5 | 0.1 |
| 11 March 2016 | 0.4 | 0.1 | |
| J23301100 | 23 February 2016 | 0.3 | 0.1 |
| GMRT | |||
| J09190146 | 24 November 2015 | 6.4 | 2.0 |
| 12 June 2016 | 4.2 | 2.0 | |
| J09216215 | 25 November 2015 | 0.8 | 1.8 |
| J11113252 | 31 October 2015 | 5.5 | 2.1 |
| J12011114 | 14 December 2015 | 5.1 | 2.1 |
| J12416020 | 22 November 2015 | 3.2 | 1.9 |
| J13425110 | 21 November 2015 | 5.2 | 2.1 |
| 26 April 2016 | 5.4 | 2.1 | |
| J13510830 | 22 January 2016 | 3.2 | 2.1 |
| J15042854 | 25 November 2015 | 3.2 | 1.9 |
| J15101640 | 4 January 2016 | 2.9 | 1.9 |
| 5 January 2016 | 3.2 | 1.9 | |
Notes. Column 1: quasar name. Column 2: date of observation. Column 3: time on source in h. Column 4: channel width in km s-1.
4 Parameters derived from H i 21-cm absorption spectra
The results from our search for H i 21-cm absorption in the 16 strong Fe ii absorbers are summarized in Table 4. We have detected H i 21-cm absorption in 6 out of these 16 strong Fe ii systems. We provide the standard deviation in the optical depth at 2 km s-1 spectral resolution (), and 3 upper limit on the integrated optical depth from spectra smoothed to 10 km s-1 (). In case of H i 21-cm absorption detections, we provide the peak optical depth () and the total integrated optical depth (). From Kanekar et al. (2014) we see that the mean and median in DLAs over 0.51.5 are 670 K and 460 K, respectively. We estimate (H i) from of the detections, or 3 upper limit to it from in case of non-detections, assuming a typical of 500 K and = 1. The (H i) associated with the H i 21-cm absorption will be cm-2 under these assumptions, i.e. these systems will satisfy the definition of being DLAs. The optical depth sensitivity in 8 out of the 10 cases of H i 21-cm non-detection rules out the system being DLA if = 500 K and = 1. Table 4 also gives the velocity width which contains 90% of the total optical depth (), and the velocity offset of the peak H i 21-cm optical depth from the strongest metal component in the SDSS spectrum (). The H i 21-cm absorption lines show a wide range of velocity spreads, with 13158 km s-1, and are detected within 100 km s-1 of the redshift obtained from metal line absorption in the SDSS spectra.
The H i 21-cm absorption spectra are shown in Fig. 2. We note that tentative absorption features are present towards J12416020 and J23301100 at the redshift of the metal absorption. However, these features are not present consistently in both the polarizations and are at significance level. Hence, we consider these as non-detections. The Gaussian fits to the H i 21-cm absorption profiles are overplotted in Fig. 2. The number of Gaussian components is determined based on the fit with the minimum . The details of the Gaussian fits, i.e. , full-width-at-half-maximum (FWHM) and of individual Gaussian components, are provided in Table 5. Constraints on the kinetic temperature, , using the FWHM of the absorption lines, i.e.,
| (1) |
and on the (H i), i.e.,
| (2) |
are provided in the same table. The FWHMs of the absorption components range from 5131 km s-1. The large linewidths are most likely dominated by mechanisms other than pure thermal broadening, since even the typical temperature (104 K) in WNM corresponds to a FWHM of 20 km s-1 (Wolfire et al., 1995; Heiles & Troland, 2003). Assuming a typical of 500 K and = 1, we find that all the H i 21-cm absorption components will be arising from DLAs.
| Quasar | Peak Flux | Spectral | (H i) | |||||||
| Density | rms | ( K) | ||||||||
| (mJy | (km s-1) | (mJy | (km s-1) | (km s-1) | () | (km s-1) | (km s-1) | |||
| beam-1) | beam-1) | ( cm-2) | ||||||||
| (1) | (2) | (3) | (4) | (5) | (6) | (7) | (8) | (9) | (10) | (11) |
| J09190146 | 183 | 2.0 | 1.0 | 0.005 | 0.02 | 0.068 | 1.61 0.11 | 15 1 | 158 | 100 |
| J09216215 | 1332 | 1.8 | 9.6 | 0.009 | 0.05 | 0.082 | 0.40 0.05 | 4 1 | 13 | 13 |
| J09525048 | 155 | 2.3 | 2.0 | 0.013 | — | 0.199 | — | 1.8 | — | — |
| J11113252 | 239 | 2.1 | 3.6 | 0.015 | — | 0.188 | — | 1.7 | — | — |
| J11114507 | 184 | 1.9 | 2.7 | 0.015 | — | 0.203 | — | 1.9 | — | — |
| J12011114 | 109 | 2.1 | 3.7 | 0.034 | — | 0.424 | — | 3.9 | — | — |
| J12416020 | 259 | 1.9 | 2.4 | 0.009 | — | 0.150 | — | 1.4 | — | — |
| J12452232 | 180 | 1.8 | 2.1 | 0.012 | — | 0.250 | — | 2.3 | — | — |
| J12551817 | 856 | 2.0 | 6.4 | 0.007 | 0.10 | 0.095 | 2.09 0.08 | 19 1 | 40 | 67 |
| J13274326 | 647 | 2.3 | 4.4 | 0.007 | 0.02 | 0.080 | 0.36 0.07 | 3 1 | 20 | 2 |
| J13425110 | 157 | 2.2 | 2.7 | 0.017 | 0.10 | 0.252 | 3.54 0.23 | 32 2 | 56 | 25 |
| J13510830 | 247 | 2.1 | 2.1 | 0.009 | — | 0.129 | — | 1.2 | — | — |
| J15042854 | 1082 | 1.9 | 2.3 | 0.002 | — | 0.030 | — | 0.3 | — | — |
| J15101640 | 257 | 1.9 | 0.9 | 0.003 | — | 0.041 | — | 0.4 | — | — |
| J22190229 | 200 | 2.3 | 3.3 | 0.016 | 0.29 | 0.300 | 5.32 0.22 | 48 2 | 58 | 59 |
| J23301100 | 1745 | 2.2 | 9.1 | 0.005 | — | 0.066 | — | 0.6 | — | — |
Notes. Column 1: quasar name. Column 2: peak flux density in mJy beam-1 of the local continuum. Column 3: channel width in km s-1. Column 4: spectral rms in mJy beam-1. Column 5: standard deviation of the H i 21-cm optical depth. Column 6: maximum H i 21-cm optical depth in case of H i 21-cm detections. Column 7: 3 upper limit on integrated H i 21-cm optical depth from spectra smoothed to 10 km s-1. Column 8: integrated H i 21-cm optical depth in case of H i 21-cm detections. Column 9: (H i) assuming = 500 K and = 1, in units of cm-2 (3 upper limit in case of non-detections). Column 10: velocity width which contains 90% of the total optical depth in case of detections. Column 11: velocity offset of the peak H i 21-cm optical depth from the strongest metal component in the SDSS spectrum in case of detections.
Note that the values in Columns 4 and 5 are at the spectral resolution specified in Column 3.


| Quasar | ID | FWHM | (H i) | |||
|---|---|---|---|---|---|---|
| ( K) () | ||||||
| (km s-1) | (K) | ( cm-2) | ||||
| (1) | (2) | (3) | (4) | (5) | (6) | (7) |
| J09190146 | 1 | 1.27308 | 131 21 | 0.013 0.004 | 373774 | 16 7 |
| J09216215 | 1 | 1.10360 | 9 2 | 0.04 0.01 | 1908 | 4 2 |
| J12551817 | 1 | 0.75761 | 29 2 | 0.06 0.01 | 18060 | 17 4 |
| 2 | 0.75766 | 5 1 | 0.05 0.03 | 591 | 3 2 | |
| J13274326 | 1 | 0.95421 | 13 7 | 0.02 0.01 | 3600 | 3 2 |
| J13425110 | 1 | 1.48804 | 24 5 | 0.05 0.04 | 12777 | 12 10 |
| 2 | 1.48825 | 39 10 | 0.06 0.04 | 33987 | 22 20 | |
| J22190229 | 1 | 0.98060 | 13 1 | 0.10 0.01 | 3923 | 13 3 |
| 2 | 0.98075 | 10 1 | 0.26 0.02 | 2394 | 26 3 | |
| 3 | 0.98090 | 15 2 | 0.06 0.01 | 5023 | 10 3 |
Notes. Column 1: quasar name. Column 2: absorption component identification. Column 3: redshift of absorption component. Column 4: FWHM (km s-1) of the Gaussian component. Column 5: peak optical depth of the Gaussian component. Column 6: upper limit on (K), obtained assuming the line width is purely due to thermal motions. Column 7: (H i) assuming = 500 K and = 1, in units of cm-2.
5 Incidence of H i 21-cm absorption in strong Fe ii systems
We define the detection rate of H i 21-cm absorption () as the fraction of systems showing H i 21-cm detections with and , where is a 3 optical depth sensitivity. We use = 0.3 km s-1 (corresponding to a sensitivity of (H i) 5 1019 cm-2 for = 100 K and = 1) throughout this work to estimate , unless otherwise mentioned 44 4 = 0.3 km s-1 is chosen also to enable comparisons with existing H i 21-cm absorption measurements in the literature.. The quoted errors represent Gaussian 1 confidence intervals computed using tables of Gehrels (1986) assuming a Poisson distribution. Note that due to lack of uniform measurement of for all the systems, we do not correct the optical depths for in subsequent discussions.
We combine our H i 21-cm measurements with those of strong Mg ii systems (i.e., 1 Å) at 0.51.5 from G09 and G12, that satisfy our criterion of being strong Fe ii absorbers with 1.0 Å. Note that for the absorber at = 0.6216 towards J093035.08464408.7 from G12, we consider the recent measurement of H i 21-cm absorption (which appeared as a tentative feature in G12) using deeper observations by Zwaan et al. (2015). The summary of all the strong Fe ii absorbers considered here for statistical analyses is given in Table 6. In total we consider 46 strong Fe ii systems out of which 16 show H i 21-cm absorption. We refer to the sample presented in this work (see Table 1) as S1, and the combined sample as S2. Note that sample S2 is homogeneous with regards to analysis of the radio data. Fig. 3 shows the distribution of and in sample S2.
| Sample | No. of | H i 21-cm | Reference |
|---|---|---|---|
| systems | detections | ||
| S1 | 16 | 6 | This work |
| G09 | 18 | 5 | Gupta et al. (2009) |
| G12 | 12 | 5∗ | Gupta et al. (2012) |
| S2 | 46 | 16 | S1 G09 G12 |
∗ With the improved parameters from the H i 21-cm absorption spectrum towards J093035.08464408.7 reported in Zwaan et al. (2015)

We estimate the detection rate of H i 21-cm absorption in the Fe ii samples over 0.51.5 as, = 0.40 (0.36 for = 0.255 5 Since lower values of will select the weaker H i 21-cm absorbers and higher values will select the stronger absorbers, we provide the detection rates for = 0.2 for comparison.) for S1, and = 0.30 (0.39 for = 0.2) for S2. We observe no evolution of within the uncertainties over the redshift range studied, for both S1 and S2 (see Fig. 4). This is consistent with the constant detection rate of H i 21-cm absorption in strong Mg ii systems found by G12. Recall that our sample selection procedure picked three strong Fe ii systems that are part of the Mg ii sample of K09 and one system that is part of the Mg ii sample of L00 (see Section 2). Including these measurements from K09 and L00 in the sample S2 does not change our statistical results within the uncertainties, i.e. = 0.27 (0.39 for = 0.2).

To determine the detection efficiency of H i 21-cm absorption of a Fe ii equivalent width based selection technique, we plot as a function of in Fig. 5. For the strong Fe ii systems in S2, we plot in two bins of demarcated at the median value, = 1.5 Å. For comparison, we also plot (0.08) in strong Mg ii systems with 1 Å from G09 and G12. We caution that the strong Mg ii systems, that have been searched for H i 21-cm absorption in the literature, are biased towards high , with 65% of them having 1.0, compared to 37% of the strong Mg ii systems in SDSS at 0.51.5 from Zhu & Ménard (2013) having 1.0. Hence, the number of systems with 1 Å is only one third of sample S2. We find that the detection efficiency of H i 21-cm absorption in systems with 1 Å (sample S2) is a factor of 3.8 times higher than that in systems with 1 Å, albeit not statistically significant due to the large uncertainties. However, the increasing trend of with is valid over both the redshift ranges, 0.51.0 and 1.11.5.
Additionally, we plot in Fig. 5 the cumulative distribution of as a function of , i.e., for = Å, it gives in systems with Å. It can be seen that increases as we go for samples with higher . This increasing trend also holds for different optical depth sensitivities, on correcting the optical depths for , and on considering the additional measurements from K09 and L00. G09 and G12 have found that the detection rate of H i 21-cm absorption can be increased by up to a factor of 2 by imposing constraints on DR, R1 and R2. Here we have demonstrated that a simple 1 Å based selection would work just as well for increasing the probability of detecting H i 21-cm absorption. Additionally, we note that assuming a typical = 500 K (see Section 4) and = 1, all the 16 H i 21-cm absorption detected in strong Fe ii systems would be arising from DLAs. Hence, strong Fe ii systems seem to have a high probability of harbouring high (H i) cold gas.

From the detection rate of H i 21-cm absorption in strong Fe ii systems and that of DLAs in strong Fe ii systems, we can estimate the detection rate of H i 21-cm absorption in DLAs, i.e., . Using obtained for S2 (see Fig. 4) and = 0.45 obtained for the 1.65 Mg ii sample of R06 (see Section 2), we estimate = 0.80 at 0.51.0 and = 0.58 at 1.11.5. In comparison, the detection rate of H i 21-cm absorption in 1 DLAs is 0.62 (Dutta et al., 2016, see), and that in 2.03.5 DLAs is 0.22 (Srianand et al., 2012, see). Note that all the detection rates estimates are for = 0.3 km s-1. Hence, appears to be increasing with decreasing redshift, even though the errors are large. This increasing trend of the H i 21-cm absorption detection rate in DLAs with decreasing redshift has also been noted by K09 and G12 (Curran et al., 2005; Curran & Webb, 2006; Curran, 2010; Curran, 2012, however see also,). This is similar to the increase in detection rate of absorption in DLAs/sub-DLAs from 10% at (Noterdaeme et al., 2008) to 50% at (Muzahid et al., 2015). In addition, as noted by Dutta et al. (2016), the incidence of H i 21-cm absorption in absorption-selected samples is much higher than that in quasar-galaxy pairs that are selected on the basis of galaxies, implying patchy distribution and small sizes (parsec to sub-parsec scale) of cold gas clouds in the extended discs/haloes of galaxies. The increase in incidence of H i 21-cm absorption with decreasing redshift can be explained as a result of the increase in the CNM filling factor in galaxies with time.
6 H i 21-cm absorption and metals
6.1 Metal line properties
The metal line ratios like DR, R1 and R2 are found to be more robust indicators of high (H i) systems than alone (R06). Further, G09 and G12 have found that a higher detection rate of H i 21-cm absorption can be obtained in systems limited to restricted ranges of these parameters. Here, we investigate the dependence of H i 21-cm absorption in strong Fe ii systems on their metal absorption. For the literature systems, we consider the rest equivalent widths of metal lines as given in G09 and G12. We plot the H i 21-cm absorption strength of the strong Fe ii systems in S2 as a function of the metal line equivalent width ratios, DR, R1 and R2 in Fig. 6. We find a positive correlation between of the H i 21-cm absorption detections and R1: Kendall’s rank correlation coefficient, = 0.38, with the probability of the correlation arising by chance, = 0.04, which is significant at = 2.0 assuming Gaussian statistics; and Spearman rank correlation coefficient, = 0.49, = 0.05, = 1.9. Since higher R1 values are likely to be arising in systems with high (H i), this may imply a weak correlation of with (H i). However, the correlation becomes less significant () when we include the upper limits () as censored data points and perform survival analysis using the ‘cenken’ function under the ‘nada’ package in r. We also do not find any correlation of the H i 21-cm absorption strength with , , DR and R2 (i.e. they are at significance). Note that most of the H i 21-cm detections arise in systems with DR 1, i.e. in the saturated regime.
It is important to keep in mind that the metal line equivalent widths and ratios measured from low resolution SDSS spectra are averaged over several absorption components. High resolution optical spectra of Mg ii systems show that the metal line absorption usually consists of multiple components, with the number of components increasing with (Churchill et al., 2003, e.g.). Hence, the lack of correlation between the H i 21-cm absorption strength and the metal line parameters estimated from SDSS could be because the H i 21-cm absorption arises from certain specific metal line components (Srianand et al., 2012; Rahmani et al., 2012; Dutta et al., 2015, e.g. G09;). This emphasizes the need for high resolution optical spectra of the metal absorption lines.
Finally, there are eleven ultrastrong Mg ii systems, i.e. those with 3.0 Å, in S2. It has been suggested that ultrastrong Mg ii absorbers may arise in galactic superwinds (Bond et al., 2001; Nestor et al., 2011). However, their large equivalent widths could also be driven by gas dynamics of the intragroup medium (Gauthier, 2013, e.g.). Typically 7% of 1 Å absorbers in SDSS satisfy the definition of ultrastrong Mg ii absorbers. This fraction becomes 12% when the absorbers also have 1 Å. However, ultrastrong Mg ii systems constitute 24% of sample S2. H i 21-cm absorption has been detected in four of these. We do not find these absorbers to be different from the rest of the strong Fe ii absorbers in terms of their H i 21-cm absorption detection rate, optical depths and velocity widths. While the metal equivalent widths are large in these systems, the velocity widths of the H i 21-cm absorption are in the range of 1260 km s-1.


6.2 Average metal content
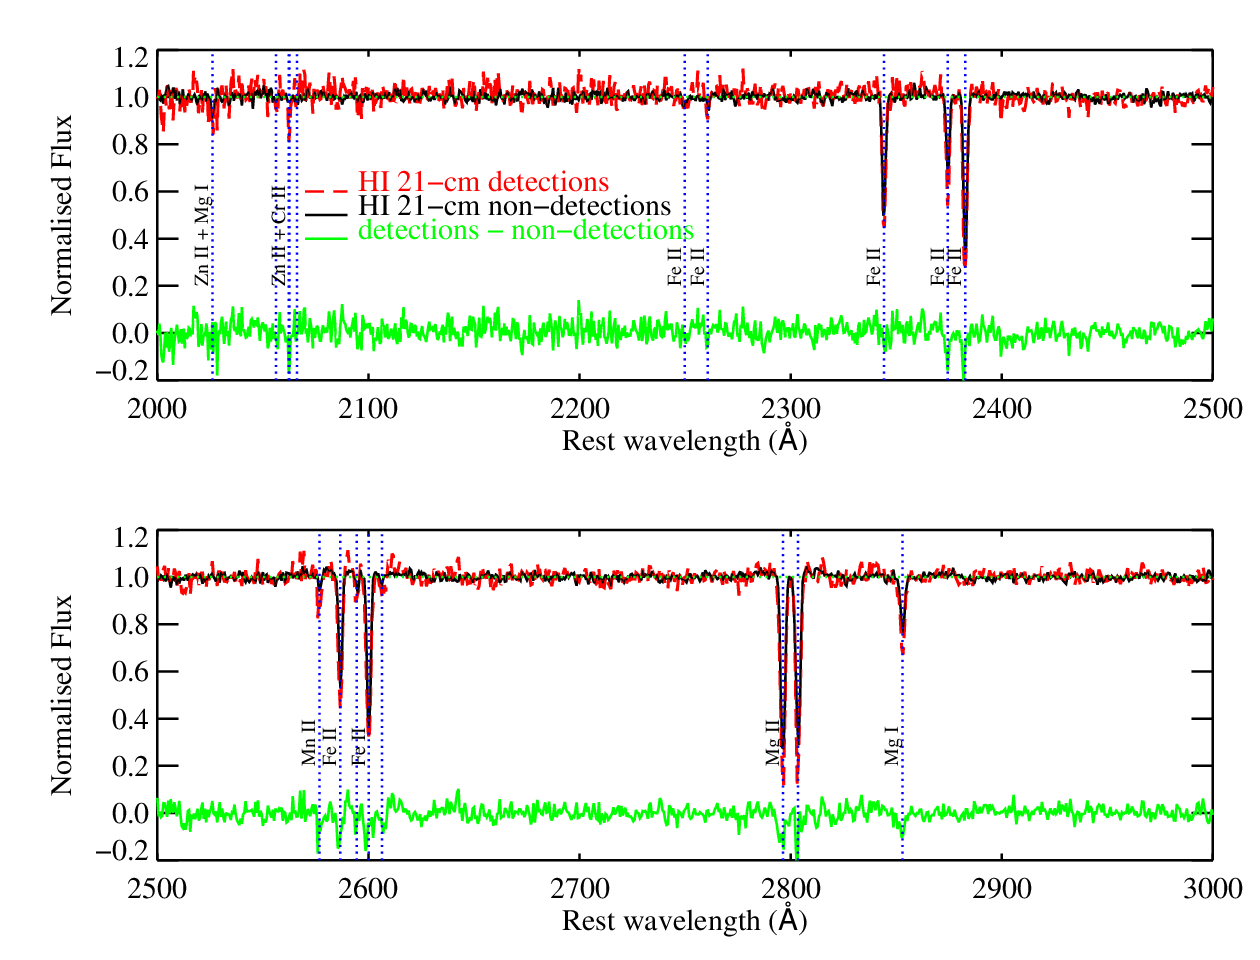
To check if there is any difference in the average metal line properties of the systems which show H i 21-cm absorption from those which do not, we stacked the SDSS spectra of the background quasars in sample S2, with and without H i 21-cm absorption separately. The resultant median stacked spectra are shown in panel (a) of Fig. 7, and the rest equivalent widths of different metal transitions in the stacked spectra are listed in Table 7. We consider the rest wavelength range of 20003000 Å, which is uniformly covered for all the systems. It can be seen that the systems which show H i 21-cm absorption, also show systematically stronger absorption (i.e. larger equivalent widths by ) from Mg ii, Mg i and Fe ii, than those which do not. The absorption lines of Cr ii, Mn ii and Zn ii are also stronger for systems with H i 21-cm detections than for those without, though the differences in equivalent widths are not more that significant. We expect strong Fe ii and H i 21-cm absorption to probe sightlines close to galaxies. Nebular emission lines are usually detected in the stacked spectra of strong Mg ii absorbers (Noterdaeme et al., 2010; Ménard et al., 2011). However, the number of systems in our stacked spectrum of H i 21-cm absorbers is small, and upper limits on average luminosity of the nebular emission lines of H, [O ii] and [O iii] are 5, 4 and 5, in units of erg s-1, respectively.
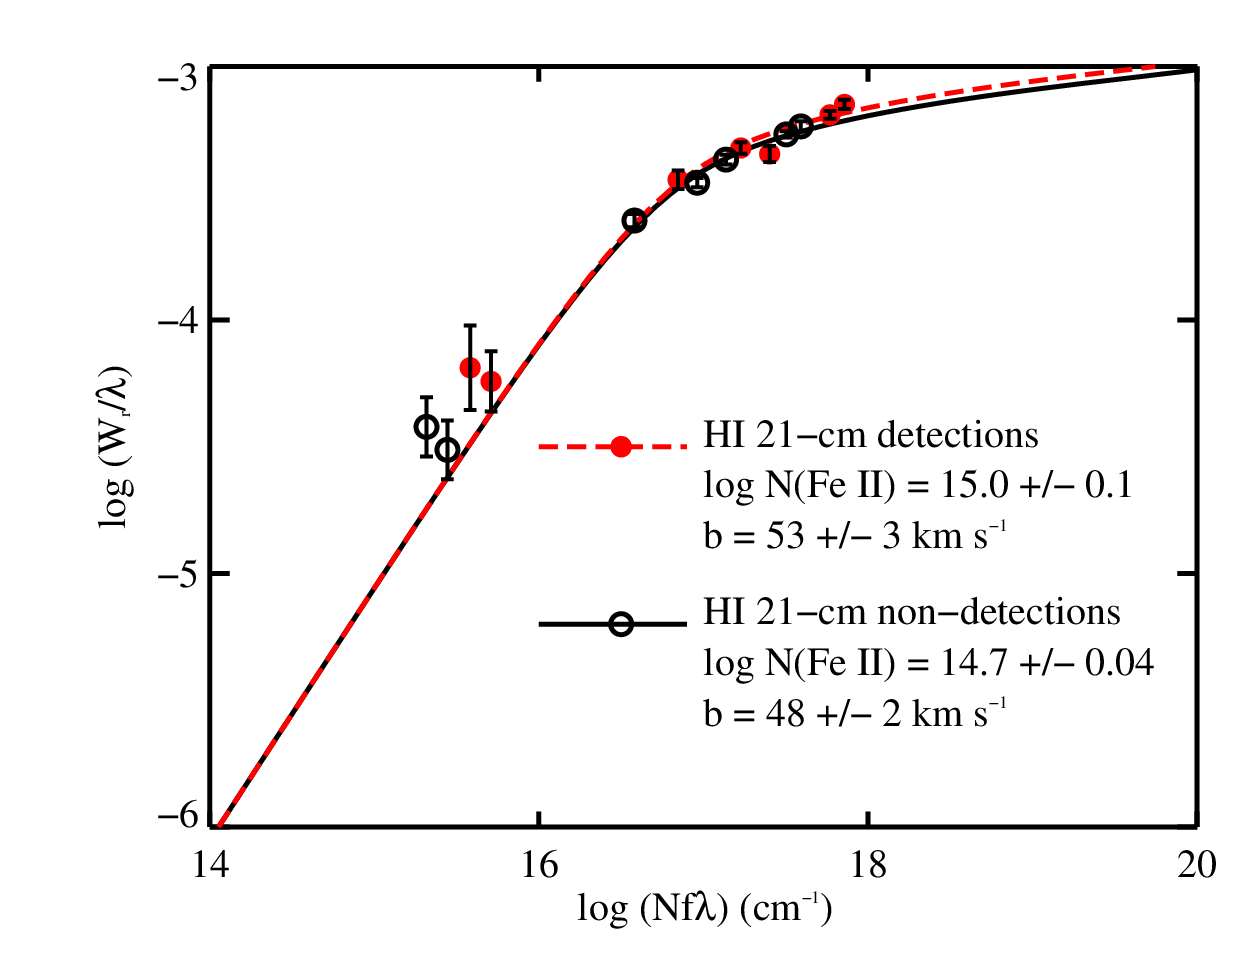
Using different absorption lines of Fe ii detected in the stacked spectra, we compute the column density () and effective Doppler parameter () by constructing a single cloud curve-of-growth (COG) (see panel (b) of Fig. 7). Note that the spectral resolution of the SDSS spectra does not allow us to measure and accurately. However, a single cloud COG can still give an indication of the column density and velocity field. The effective parameter obtained for Fe ii lines in the stacked spectrum of H i 21-cm detections is slightly higher than that for Fe ii lines in the stacked spectrum of non-detections. The larger effective parameter could reflect larger number of absorption components, and hence higher probability of detecting H i 21-cm absorption from a cold gas component. The stacked spectrum of H i 21-cm detections gives two times higher (Fe ii) than that of the non-detections. Even if we consider only the two weak transitions of Fe ii 2249 and 2260, which are unlikely to be affected by saturation, we get two times higher (Fe ii) for the stacked spectrum of H i 21-cm detections compared to that of the non-detections. Therefore, it seems that systems which give rise to H i 21-cm absorption are likely to have stronger metal absorption (i.e. higher column density) on average than those which do not. This is also consistent with the increase in detection rate of H i 21-cm absorption with increasing (see Fig. 5).
| Transition | REW(detections) | REW(non-detections) |
|---|---|---|
| (Å) | (Å) | |
| (1) | (2) | (3) |
| Mg ii 2796 | 2.22 0.08 | 1.88 0.05 |
| Mg ii 2803 | 2.08 0.07 | 1.75 0.05 |
| Mg i 2852 | 0.77 0.07 | 0.54 0.03 |
| Fe ii 2600 | 1.68 0.06 | 1.40 0.04 |
| Fe ii 2586 | 1.23 0.06 | 0.90 0.04 |
| Fe ii 2382 | 1.69 0.07 | 1.38 0.06 |
| Fe ii 2374 | 0.85 0.07 | 0.59 0.03 |
| Fe ii 2344 | 1.06 0.04 | 1.01 0.02 |
| Fe ii 2260 | 0.13 0.04 | 0.07 0.02 |
| Fe ii 2249 | 0.15 0.04 | 0.09 0.02 |
| Mn ii 2606 | 0.14 0.06 | 0.05 0.04 |
| Mn ii 2594 | 0.20 0.06 | 0.06 0.04 |
| Mn ii 2576 | 0.28 0.06 | 0.07 0.04 |
| Zn ii Cr ii 2062 | 0.22 0.06 | 0.03 0.03 |
| Zn ii Mg i 2026 | 0.25 0.06 | 0.13 0.02 |
Notes. Column 1: metal line transition. Columns 2 and 3: rest equivalent widths of the transition in the stacked spectra of quasars with H i 21-cm absorption detections and non-detections, respectively.
7 Dust content of H i 21-cm absorbers
Dust grains play an important role in the heating and cooling of the neutral gas phases of the ISM (Wolfire et al., 1995), and also in the formation of molecules in the cold and dense phases (Gould & Salpeter, 1963; Hollenbach & Salpeter, 1971). The large homogeneous database of SDSS quasar spectra has made it possible to statistically quantify the dust content of absorber populations like Mg ii systems, Ca ii systems and DLAs through differential reddening measurements (York et al., 2006; Wild et al., 2006; Ménard et al., 2008; Vladilo et al., 2008; Budzynski & Hewett, 2011; Khare et al., 2012; Ménard & Fukugita, 2012; Sardane et al., 2015; Murphy & Bernet, 2016). Such studies have found that Mg ii systems rarely show strong reddening due to dust in the spectra of the background quasars (mean 0.02). Jiang et al. (2011) have found only 39 cases that are 2175 Å dust extinction bump candidates among 2951 strong Mg ii systems from SDSS with 1 Å at 1.0 1.86. However, the Mg ii line strength is generally found to be correlated with the reddening. For example, Budzynski & Hewett (2011) have found that the dependence of on can be modeled by a power-law for 1 (Å) 5, and 83% of the high confidence 2175 Å candidates from Jiang et al. (2011) have 2 Å and 1 Å. Recently, Ledoux et al. (2015) have shown that dust content of C i absorbers at 1.5 4.5 selected from SDSS is significant, with mean = 0.065 and 30% of them showing the 2175 Å extinction feature. Moreover, C i absorbers provide ideal targets to search for tracers of translucent molecular gas like CO (Noterdaeme et al., 2011; Noterdaeme et al., 2016, e.g.). Noterdaeme et al. (2008) have found that the presence of molecular absorption in 1.8 DLAs is closely related to the dust content and metallicity. H i 21-cm absorption can also provide an efficient way to reveal cold and dusty absorbers (Srianand et al., 2008, e.g.). Indeed a possible anti-correlation between the H i 21-cm spin temperature and gas phase metallicity has been reported (see Kanekar et al., 2014, and references therein). Here we investigate the dust content of strong Fe ii absorbers and its connection with H i 21-cm absorption, first in our present sample S1 (Section 7.1) and then in the full sample S2 (Section 7.2).
7.1 Dust content in sample S1
We estimate the quasar reddening, , by fitting the quasar spectral energy distribution (SED) using the SDSS composite quasar spectrum (Vanden Berk et al., 2001), reddened by the Milky Way (MW), Small Magellanic Cloud (SMC), Large Magellanic Cloud (LMC) or LMC2 supershell extinction curves (Gordon et al., 2003). We follow the same procedure as detailed in the works of Srianand et al. (2008) and Noterdaeme et al. (2009); Noterdaeme et al. (2010). In case of multiple epoch spectra available of the same quasar, we fit the SED of all of them and take the fit which gives the minimum . We find that the values obtained from fitting multiple epoch spectra of the same quasar can differ by 1020%. This should be taken as the typical systematic error in the values. We note that in the majority of cases, a better fit was obtained for SDSS-DR7 spectra than for SDSS-Baryon Oscillation Spectroscopic Survey (BOSS) spectra of the same quasar. This could be due to flux calibration overestimate of the blue side of the BOSS spectra.
We consider systems with 0.1 to be showing signatures of reddening, since below this the distribution of values could be dominated by the quasar SED-induced uncertainty. We find that 4 out of 16 quasars in our sample S1 (J09190146, J09216215, J12452232, and J13274326) have 0.1. H i 21-cm absorption has been detected towards three of these quasars (J09190146, J09216215 and J13274326). Note that the system towards J09190146 has been identified as a median-confidence (4.8) 2175 Å absorber candidate by Jiang et al. (2011). The SED of these four quasars are best fit with SMC extinction law (see Fig. 8). We note that the SED fit of J12452232 is not very good, which could be due to the complex intrinsic quasar emission. The errors provided for take into account the uncertainties in the extinction law parameters. For each of these four quasars, we applied the same SED fitting procedure with SMC extinction law to a control sample of SDSS non-BAL quasars within = 0.050.1 of and = 0.51.0 of of the quasars and having spectra with signal-to-noise ratio 10. The details of the control samples are provided in Fig. 8. The standard deviation of the values reflects the typical systematic error in the SED-fitting method due to the dispersion of the unreddened quasar SED. In case of the above four quasars, we find that their reddening is significant at level.
In Table 8, we have estimated the (H i) for the above four systems in terms of the dust-to-gas-ratio relative to SMC (), using the observed mean relation between and (H i) in the SMC (Gordon et al., 2003). Further, comparing this with the measurement we have estimated ( ). In case of J09216215 and J13274326, where we have estimates of (see Table 2), we find that the obtained for = 1 is higher by a factor of 2 than the upper limit on the gas kinetic temperature from the H i 21-cm line width (see Table 5). Hence, the extinction per hydrogen atom in these systems could be at least a factor of 2 higher than what is observed in the SMC. This could also be the reason for non-detection of H i 21-cm absorption towards J12452232. The possibility of the extinction per hydrogen atom being higher in high- absorbers has been suggested by G12. Further, from fig. 11 of Ledoux et al. (2015), it can be seen that in few of the high- C i systems, the versus (H i) relation is consistent with the reddening per hydrogen atom being upto ten times higher than that seen in the Milky Way and the Magellanic clouds. This could imply a different grain chemistry or small grain size (i.e. larger total grain surface area) in these high- absorbers (Shaw et al., 2016; Noterdaeme et al., 2016, see e.g.).


| Quasar | (H i) | ( ) | ||
|---|---|---|---|---|
| (cm-2) | (K) | |||
| (1) | (2) | (3) | (4) | (5) |
| J09190146 | 0.20 0.02 | 7 | 2500 | — |
| J09216215 | 0.12 0.01 | 4 | 6000 | 3 |
| J12452232 | 0.31 0.03 | 11 | 24000 | — |
| J13274326 | 0.11 0.01 | 4 | 6000 | 2 |
Notes. Column 1: quasar name. Column 2: obtained from SED fit. SMC extinction curve gives best fit in these cases. Column 3: (H i) in units of (cm-2) obtained from the relation between (H i) and in the SMC (Gordon et al., 2003). is the dust-to-gas ratio relative to SMC. Column 4: ( ) (K) obtained by comparing Column 3 with measurements given in Table 4. Column 5: in case of J09216215 and J13274326 where we have estimates of (see Table 2), we constrain by using the upper limit on (see Table 5).
7.2 Dust content in sample S2
We estimated for all the strong Mg ii systems that have been searched for H i 21-cm absorption (G09, G12). The of the strong Mg ii systems is correlated with both and at 2 significance level. We find that strong Fe ii absorbers tend to cause more reddening, with median = 0.05 for systems with 1 Å, compared to median = 0.01 for systems with 1 Å. A two-sided Kolmogorov-Smirnov (KS) test between the distribution of the strong and weak Fe ii systems suggests that the maximum deviation between the two cumulative distribution functions is = 0.50 with a probability of = 0.01 (where is the probability of finding this value or lower by chance). Hence, our strong based selection technique tends to select dusty absorbers. Though we note that among the strong Fe ii absorbers there is no correlation of with and (i.e. they are at significance). We plot versus for the strong Fe ii systems in panel (a) of Fig. 9. In addition, we do not find any redshift evolution of .
Next, we check whether among the strong Fe ii systems, H i 21-cm absorption leads to more reddening in the quasar spectra. We show the histogram and cumulative distributions of the best-fit values for the systems with H i 21-cm detections and non-detections in panel (b) of Fig. 9. It can be seen that systems which show H i 21-cm absorption tend to cause more reddening in the quasar spectra. The median for H i 21-cm detections is 0.10, while it is 0.02 for the non-detections. A two-sided KS test between the two distributions gives = 0.42 with = 0.09. The connection between H i 21-cm absorption and dust is further illustrated in panel (c) of Fig. 9, which shows the geometric mean stacked SDSS quasar spectra of the H i 21-cm detections and non-detections. It can be clearly seen that H i 21-cm absorption on average causes more reddening in the quasar spectra. We fit the stacked spectrum of H i 21-cm detections considering the stacked spectrum of H i 21-cm non-detections as a template. The best fit extinction curve is SMC, and the differential obtained is 0.05. In addition, we find that the H i 21-cm detection rate shows tentative evidence of increasing with reddening, i.e. = 0.25 (0.25 for = 0.2) for 0.1 and = 0.38 (0.75 for = 0.2) for 0.1. However, the increase of with is not statistically significant due to the large uncertainties, and a larger sample is required to confirm this trend.
Note that in the case of J09190146, unlike in the rest, we knew that the quasar showed signatures of reddening, based on the results of Jiang et al. (2011), before searching for H i 21-cm absorption. However, we find that the above results do not change beyond the statistical uncertainties on excluding this system, i.e. this system does not dominate the statistics. For example, on excluding this system, two-sided KS test between the distributions of H i 21-cm detections and non-detections gives = 0.39 with = 0.16, and the stacked spectrum of H i 21-cm detections show differential of 0.04 with respect to that of the non-detections.
A correlation between and (H i) is expected based on observations in the Milky Way and the Magellanic clouds (Bohlin et al., 1978; Gordon et al., 2003; Gudennavar et al., 2012). However, we do not find any significant () correlation of with for the strong Fe ii systems. Finally, we note that 72% of the systems with 0.1 have SMC type of dust. This is comparable to 74% of the C i absorbers having SMC type of dust (Ledoux et al., 2015). Two out of the five H i 21-cm detections with 0.1 have LMC type of dust and are discussed in detail in Srianand et al. (2008). The remaining three have SMC type of dust and are discussed in Section 7.1 (see also Fig. 8).


8 Velocity width of H i 21-cm absorption
8.1 Redshift evolution
The 16 H i 21-cm absorption lines detected in the strong Fe ii systems (i.e. sample S2) exhibit a wide range of velocity widths, i.e. 8160 km s-1(median = 56 km s-1), and FWHM of individual Gaussian components 3130 km s-1(median = 23 km s-1). We compare the H i 21-cm absorption velocity width in the strong Fe ii systems with that in other intervening samples selected based on different criteria the sample of 0.4 quasar-galaxy pairs (QGPs; see Dutta et al., 2016, and references therein), and samples of Mg ii systems (which do not satisfy our criterion of 1 Å at 0.51.5) (see G12 and references therein) and DLAs (see Kanekar et al., 2014; Kanekar, 2014, and references therein). Note that for this analysis we do not consider proximate absorbers with redshifts within 3000 km s-1 of the quasar redshift (Møller et al., 1998; Ellison et al., 2002; Prochaska et al., 2008b), since the absorption could be associated with the quasar and intrinsic H i 21-cm absorption lines tend to be broader (Geréb et al., 2015; Curran et al., 2016). Hence, we do not consider the H i 21-cm absorption towards J09190146, which is 1700 km s-1 blueshifted from the quasar emission redshift. This is the broadest H i 21-cm absorption line among all the Fe ii systems (the absorption can be fit with a single Gaussian component of FWHM = 131 km s-1). In addition, we do not consider the very broad (FWHM235 km s-1) H i 21-cm absorption line detected towards J162439.09234512.2 (Curran et al., 2007a), as well as the H i 21-cm absorption lines detected towards gravitational lenses (Chengalur et al., 1999; Kanekar & Chengalur, 2003), where the velocity widths could be dominated by other factors like the radio structure.
Note that the different samples listed above probe different redshift ranges. When restricting to 1, we do not find any difference in the distributions of the galaxy-selected (or absorption-blind) sample of QGPs and the absorption-selected samples of Mg iiFe iiDLAs. Similarly, we do not find any difference in the distributions of the strong Fe ii systems and the other Mg ii systems and DLAs, over 0.51.5. Note that the distributions in QGPs, DLAs, Mg ii and Fe ii systems are also similar when we consider common redshift ranges.
The left panel of Fig. 10 shows as a function of for the QGPs, the strong Fe ii systems and other Mg ii systems and DLAs. It can be seen that of H i 21-cm absorbers shows an increasing trend with redshift. Test for correlation between and for all the H i 21-cm absorbers gives a positive correlation, with = 0.34, = 1.4 10-4, = 3.8 and = 0.48, = 1.4 10-4, = 3.6. Note that inclusion of the proximate systems and the systems from Chengalur et al. (1999); Kanekar & Chengalur (2003); Curran et al. (2007a), leads to the significance of the anti-correlation becoming 3. On the other hand, if we consider only the measurements from absorption-selected samples (i.e. excluding the measurements from QGPs), the anti-correlation is significant at 2.5.
The increasing trend of with redshift indicates that the velocity dispersion of H i gas could be larger in high- galaxies. From fig. 4 of Ledoux et al. (2006) it can be seen that for a given metallicity, the low-ionization metal lines in DLAs tend to be have larger velocity widths at 2.4. The velocity-metallicity correlation in DLAs is believed to reflect the mass-metallicity relation in galaxies (Tremonti et al., 2004; Møller et al., 2013; Neeleman et al., 2013). Moreover, fig. 3 of Erb et al. (2006) shows that for a given metallicity, galaxies will have larger stellar masses at 2 compared to at 0.1. Hence, this may mean that for a given metallicity, the average velocity width is higher at high-, as it originates from more massive galaxy haloes compared to at low-. Therefore, one possible explanation of the vs. correlation is that a typical H i 21-cm absorber may be probed by larger mass haloes at high-
In addition to , the FWHM of individual Gaussian components of the H i 21-cm absorption profiles also show correlation with . The median FWHM (8 km s-1) of the H i 21-cm absorption lines detected at (which divides the sample into equal halves and corresponds to a lookback time of 6.6 Gyr) gives 1400 K, while the median FWHM (18 km s-1) at gives 7000 K. The large upper limits on the kinetic temperature indicates that non-thermal motions are most likely to dominate the line widths. The line widths could be driven by turbulent motion, which is closely linked with the supernova rate and hence the star formation rate (Mac Low & Klessen, 2004; Elmegreen & Scalo, 2004; McKee & Ostriker, 2007; Tamburro et al., 2009). Moreover, it is known that the star formation rate on average is higher at higher redshifts (Madau & Dickinson, 2014). However, the H i 21-cm velocity width depends not just on the gas structure and kinematics, but on the background radio source structure as well. To gain further insight into the redshift evolution of the H i 21-cm velocity width, we study its dependence on various physical parameters next.


8.2 Dependence on physical parameters
Curran et al. (2007b) have reported a 2.22.8 level correlation between H i 21-cm absorption line widths and . However, G09 and K09 do not find similar correlation. Since and information cannot be uniformly obtained over the redshift range of H i 21-cm absorption measurements, we focus here on the systems at 0.32.3. For these systems, we do not find any correlation of of the H i 21-cm absorption lines with as well as (i.e. they are at significance). The absence of correlation between the H i 21-cm absorption width and or can be explained if the H i 21-cm absorbing gas originates from only one or few of the metal line components, which are not necessarily the strongest. Indeed this has been observed in few cases where high resolution optical spectra are available (Srianand et al., 2012; Rahmani et al., 2012; Dutta et al., 2015, G09;).
Further, we do not find any correlation of with DR, R1 and R2 (i.e. they are at significance). However, we find that the broadest H i 21-cm absorption lines occur when R2 is 1.2 (see right panel of Fig. 10). If we consider the measurement towards J09190146 (shown as a star in Fig. 10), there is a weak 1.5 anti-correlation between and R2 (significance reduces to 1.2 on excluding it). Assuming that both Mg ii and Fe ii absorption trace the same velocity field and parameters in the range 4060 km s-1 (as indicated by our analysis in Section 6.2), from single-cloud curve-of-growth we find that values of R2 1.2 will occur in the saturated part where (Fe ii) 3 1015 cm-2. We can put a lower limit on (H i) 1020 cm-2 assuming solar metallicity and solar abundance of Fe (Asplund et al., 2009). Since Fe is usually prone to depletion onto dust grains (Savage & Sembach, 1996; Draine, 2003; Jenkins, 2009), this is a strict lower limit on (H i). Hence, such large (Fe ii) are expected from self-shielded regions with high (H i). The probability of encountering multiple cold H i clouds along such sightlines would be high, which can explain the observed broad H i 21-cm lines. On the other hand, when R2 is higher, (H i) would be lower and in turn the probability of encountering multiple cold gas clouds along such sightlines would be lower. This can explain the low values when R2 1.5. The scatter in the values when R2 is close to 1 can be explained if H i 21-cm absorption does not always arise from all the metal line components, as also discussed above.
As noted in Section 8.1, the velocity width of the H i 21-cm absorption lines also depends on the radio structure of the background sources. We note that G12 have not found any correlation of with the linear size of the radio sources measured from VLBA images. However, the three Fe ii systems with 100 km s-1 are towards radio sources with extended morphology at arcsecond-scales (G12). Note that in case of the broad proximate absorber towards J09190146, the radio source is compact in our GMRT image. Even when the radio sources are compact at arcsecond-scales, if radio structures are present at parsec-scales, that could lead to broadening of the line (Srianand et al., 2013; Srianand et al., 2015; Biggs et al., 2016, e.g.). Hence, we emphasize the need for multi-wavelength VLBA sub-arcsecond-scale images of all the radio sources towards which H i 21-cm absorption lines are detected in order to characterize their radio structure and address the origin of the velocity widths.
9 Summary
Using strong Mg ii systems ( 1 Å) having measurements of both (H i) and at and , we have found that the probability of having log (H i) 20.3, i.e. DLA column densities, can be increased by a factor of 1.41.7, by selecting strong Fe ii systems with 1 Å. Hence, we have searched for H i 21-cm absorption in a sample of strong Fe ii systems at selected from SDSS-DR12, using GMRT and GBT. We have detected H i 21-cm absorption in six of these systems.
Combining our sample with that of strong Fe ii systems from G09 and G12, we have estimated the detection rate of H i 21-cm absorption in strong Fe ii systems to be 0.30 for = 0.3 km s-1. We have found that the detection rate increases with , being four times higher in systems with 1 Å compared to in systems with 1 Å. The detection rate of H i 21-cm absorption in strong Fe ii systems remains constant within the uncertainties over . For = 500 K (typical of DLAs at this redshift range) and = 1, all the H i 21-cm absorption in strong Fe ii systems would arise from DLAs. Hence, a based selection appears to be efficient in detecting high (H i) cold gas. From the detection rate of H i 21-cm absorption in strong Fe ii systems and that of DLAs in strong Fe ii systems, we estimate the detection rate of H i 21-cm absorption in DLAs to be 0.67 at for = 0.3 km s-1. This is three times higher than that estimated in DLAs and may indicate towards an increasing filling factor of cold gas in DLAs with time.
We do not find any significant correlation of the H i 21-cm absorption strength with the metal line properties. However, the metal absorption are systematically stronger in the stacked SDSS spectrum of the systems which show H i 21-cm absorption than in that of the H i 21-cm non-detections. In addition, the H i 21-cm absorbers tend to cause more significant reddening in the spectrum of the background quasars and there is a tendency for the detection rate of H i 21-cm absorbers to be higher towards more reddened quasars. The stacked spectrum of quasars with H i 21-cm absorption detected towards them is more reddened than that of quasars without any H i 21-cm absorption. Hence, the above imply that H i 21-cm absorption is more likely to arise in metal rich dusty cold gas. Note that highly reddened systems are likely to be missed out in samples selected on the basis of optical/UV spectra. Budzynski & Hewett (2011) have shown that Mg ii samples, constructed from flux-limited quasar surveys, suffer 24% and 34% incompleteness for absorbers with 1 Å and 2 Å, respectively. Hence, upcoming blind H i 21-cm absorption surveys with the Square Kilometre Array pre-cursors could unravel a new population of dusty absorbers towards highly reddened quasars.
By comparing the velocity widths of intervening H i 21-cm absorption lines detected in samples of QGPs, DLAs and Mg ii systems at , we find evidence
for the velocity widths to be increasing with redshift, which is significant at . This could be because a typical H i 21-cm absorber may be originating
from a larger mass galaxy halo at high- compared to at low-. However, the H i 21-cm velocity width depends on various factors like kinematics and structure
of the absorbing gas as well as structure of the background radio source, and these need to be better understood in order to correctly interpret the redshift
evolution. Finally, we emphasize the need for more H i 21-cm absorption detections to confirm different trends noted in this work with higher statistical significance.
ACKNOWLEDGEMENTS
We thank the anonymous referee for useful comments.
We thank the staff at GMRT and GBT for their help during the observations.
GMRT is run by the National Centre for Radio Astrophysics of the Tata Institute of Fundamental Research.
GBT is run by the National Radio Astronomy Observatory (NRAO). The NRAO is a facility of the National Science Foundation operated under cooperative agreement by Associated Universities, Inc.
NG, PN, RS and PPJ acknowledge the support from Indo-Fench centre for the promotion of Advanced Research (IFCPAR) under Project No. 5504-2.
JK acknowledges financial support from the Danish Council for Independent Research (EU-FP7 under the Marie-Curie grant agreement no. 600207) with reference DFF-MOBILEX–5051-00115.
This research has made use of the NASA/IPAC Extragalactic Database (NED) which is operated by the Jet Propulsion Laboratory, California Institute of Technology,
under contract with the National Aeronautics and Space Administration.
Funding for SDSS-III has been provided by the Alfred P. Sloan Foundation, the Participating Institutions, the National Science Foundation, and the U.S. Department of Energy Office of Science. The SDSS-III web site is http://www.sdss3.org/. SDSS-III is managed by the Astrophysical Research Consortium for the Participating Institutions of the SDSS-III Collaboration including the University of Arizona, the Brazilian Participation Group, Brookhaven National Laboratory, Carnegie Mellon University, University of Florida, the French Participation Group, the German Participation Group, Harvard University, the Instituto de Astrofisica de Canarias, the Michigan State/Notre Dame/JINA Participation Group, Johns Hopkins University, Lawrence Berkeley National Laboratory, Max Planck Institute for Astrophysics, Max Planck Institute for Extraterrestrial Physics, New Mexico State University, New York University, Ohio State University, Pennsylvania State University, University of Portsmouth, Princeton University, the Spanish Participation Group, University of Tokyo, University of Utah, Vanderbilt University, University of Virginia, University of Washington, and Yale University.
References
- Alam et al. (2015) Alam S., et al., 2015, ApJS, 219, 12
- Asplund et al. (2009) Asplund M., Grevesse N., Sauval A. J., Scott P., 2009, ARA&A, 47, 481
- Battisti et al. (2012) Battisti A. J., et al., 2012, ApJ, 744, 93
- Bergeron & Boissé (1991) Bergeron J., Boissé P., 1991, A&A, 243, 344
- Biggs et al. (2016) Biggs A. D., Zwaan M. A., Hatziminaoglou E., Péroux C., Liske J., 2016, MNRAS, 462, 2819
- Bohlin et al. (1978) Bohlin R. C., Savage B. D., Drake J. F., 1978, ApJ, 224, 132
- Bond et al. (2001) Bond N. A., Churchill C. W., Charlton J. C., Vogt S. S., 2001, ApJ, 562, 641
- Bouché et al. (2007) Bouché N., Murphy M. T., Péroux C., Davies R., Eisenhauer F., Förster Schreiber N. M., Tacconi L., 2007, ApJ, 669, L5
- Briggs & Wolfe (1983) Briggs F. H., Wolfe A. M., 1983, ApJ, 268, 76
- Budzynski & Hewett (2011) Budzynski J. M., Hewett P. C., 2011, MNRAS, 416, 1871
- Chen et al. (2010a) Chen H.-W., Helsby J. E., Gauthier J.-R., Shectman S. A., Thompson I. B., Tinker J. L., 2010a, ApJ, 714, 1521
- Chen et al. (2010b) Chen H.-W., Wild V., Tinker J. L., Gauthier J.-R., Helsby J. E., Shectman S. A., Thompson I. B., 2010b, ApJ, 724, L176
- Chengalur et al. (1999) Chengalur J. N., de Bruyn A. G., Narasimha D., 1999, A&A, 343, L79
- Churchill et al. (2003) Churchill C. W., Vogt S. S., Charlton J. C., 2003, AJ, 125, 98
- Condon et al. (1998) Condon J. J., Cotton W. D., Greisen E. W., Yin Q. F., Perley R. A., Taylor G. B., Broderick J. J., 1998, AJ, 115, 1693
- Curran (2010) Curran S. J., 2010, MNRAS, 402, 2657
- Curran (2012) Curran S. J., 2012, ApJ, 748, L18
- Curran & Webb (2006) Curran S. J., Webb J. K., 2006, MNRAS, 371, 356
- Curran et al. (2005) Curran S. J., Murphy M. T., Pihlström Y. M., Webb J. K., Purcell C. R., 2005, MNRAS, 356, 1509
- Curran et al. (2007a) Curran S. J., Tzanavaris P., Murphy M. T., Webb J. K., Pihlström Y. M., 2007a, MNRAS, 381, L6
- Curran et al. (2007b) Curran S. J., Tzanavaris P., Pihlström Y. M., Webb J. K., 2007b, MNRAS, 382, 1331
- Curran et al. (2010) Curran S. J., Tzanavaris P., Darling J. K., Whiting M. T., Webb J. K., Bignell C., Athreya R., Murphy M. T., 2010, MNRAS, 402, 35
- Curran et al. (2016) Curran S. J., Duchesne S. W., Divoli A., Allison J. R., 2016, MNRAS, 462, 4197
- Douglas et al. (1996) Douglas J. N., Bash F. N., Bozyan F. A., Torrence G. W., Wolfe C., 1996, AJ, 111, 1945
- Draine (2003) Draine B. T., 2003, ARA&A, 41, 241
- Dutta et al. (2015) Dutta R., Srianand R., Muzahid S., Gupta N., Momjian E., Charlton J., 2015, MNRAS, 448, 3718
- Dutta et al. (2016) Dutta R., Srianand R., Gupta N., Momjian E., Noterdaeme P., Petitjean P., Rahmani H., 2016, preprint, (arXiv:1610.05316)
- Ellison et al. (2002) Ellison S. L., Yan L., Hook I. M., Pettini M., Wall J. V., Shaver P., 2002, A&A, 383, 91
- Elmegreen & Scalo (2004) Elmegreen B. G., Scalo J., 2004, ARA&A, 42, 211
- Erb et al. (2006) Erb D. K., Shapley A. E., Pettini M., Steidel C. C., Reddy N. A., Adelberger K. L., 2006, ApJ, 644, 813
- Gatto et al. (2015) Gatto A., et al., 2015, MNRAS, 449, 1057
- Gauthier (2013) Gauthier J.-R., 2013, MNRAS, 432, 1444
- Gauthier et al. (2009) Gauthier J.-R., Chen H.-W., Tinker J. L., 2009, ApJ, 702, 50
- Gehrels (1986) Gehrels N., 1986, ApJ, 303, 336
- Gent et al. (2013) Gent F. A., Shukurov A., Fletcher A., Sarson G. R., Mantere M. J., 2013, MNRAS, 432, 1396
- Geréb et al. (2015) Geréb K., Maccagni F. M., Morganti R., Oosterloo T. A., 2015, A&A, 575, A44
- Gordon et al. (2003) Gordon K. D., Clayton G. C., Misselt K. A., Landolt A. U., Wolff M. J., 2003, ApJ
- Gould & Salpeter (1963) Gould R. J., Salpeter E. E., 1963, ApJ, 138, 393
- Gregory & Condon (1991) Gregory P. C., Condon J. J., 1991, ApJS, 75, 1011
- Gudennavar et al. (2012) Gudennavar S. B., Bubbly S. G., Preethi K., Murthy J., 2012, ApJS, 199, 8
- Gupta et al. (2009) Gupta N., Srianand R., Petitjean P., Noterdaeme P., Saikia D. J., 2009, MNRAS, 398, 201
- Gupta et al. (2010) Gupta N., Srianand R., Bowen D. V., York D. G., Wadadekar Y., 2010, MNRAS, 408, 849
- Gupta et al. (2012) Gupta N., Srianand R., Petitjean P., Bergeron J., Noterdaeme P., Muzahid S., 2012, A&A, 544, A21
- Heiles & Troland (2003) Heiles C., Troland T. H., 2003, ApJ, 586, 1067
- Hollenbach & Salpeter (1971) Hollenbach D., Salpeter E. E., 1971, ApJ, 163, 155
- Jenkins (2009) Jenkins E. B., 2009, ApJ, 700, 1299
- Jiang et al. (2011) Jiang P., Ge J., Zhou H., Wang J., Wang T., 2011, ApJ, 732, 110
- Jorgenson et al. (2013) Jorgenson R. A., Murphy M. T., Thompson R., 2013, MNRAS, 435, 482
- Kacprzak & Churchill (2011) Kacprzak G. G., Churchill C. W., 2011, ApJ, 743, L34
- Kacprzak et al. (2011) Kacprzak G. G., Churchill C. W., Evans J. L., Murphy M. T., Steidel C. C., 2011, MNRAS, 416, 3118
- Kanekar (2014) Kanekar N., 2014, ApJ, 797, L20
- Kanekar & Chengalur (2003) Kanekar N., Chengalur J. N., 2003, A&A, 399, 857
- Kanekar et al. (2009) Kanekar N., Prochaska J. X., Ellison S. L., Chengalur J. N., 2009, MNRAS, 396, 385
- Kanekar et al. (2014) Kanekar N., et al., 2014, MNRAS, 438, 2131
- Khare et al. (2012) Khare P., vanden Berk D., York D. G., Lundgren B., Kulkarni V. P., 2012, MNRAS, 419, 1028
- Kulkarni & Heiles (1988) Kulkarni S. R., Heiles C., 1988, Neutral hydrogen and the diffuse interstellar medium. pp 95–153
- Lane (2000) Lane W. M., 2000, PhD thesis, University of Groningen
- Lanzetta et al. (1987) Lanzetta K. M., Turnshek D. A., Wolfe A. M., 1987, ApJ, 322, 739
- Ledoux et al. (2003) Ledoux C., Petitjean P., Srianand R., 2003, MNRAS, 346, 209
- Ledoux et al. (2006) Ledoux C., Petitjean P., Fynbo J. P. U., Møller P., Srianand R., 2006, A&A, 457, 71
- Ledoux et al. (2015) Ledoux C., Noterdaeme P., Petitjean P., Srianand R., 2015, A&A, 580, A8
- Lovegrove & Simcoe (2011) Lovegrove E., Simcoe R. A., 2011, ApJ, 740, 30
- Lundgren et al. (2009) Lundgren B. F., et al., 2009, ApJ, 698, 819
- Mac Low & Klessen (2004) Mac Low M.-M., Klessen R. S., 2004, Reviews of Modern Physics, 76, 125
- Madau & Dickinson (2014) Madau P., Dickinson M., 2014, ARA&A, 52, 415
- Matejek et al. (2013) Matejek M. S., Simcoe R. A., Cooksey K. L., Seyffert E. N., 2013, ApJ, 764, 9
- McKee & Ostriker (1977) McKee C. F., Ostriker J. P., 1977, ApJ, 218, 148
- McKee & Ostriker (2007) McKee C. F., Ostriker E. C., 2007, ARA&A, 45, 565
- Meiring et al. (2011) Meiring J. D., et al., 2011, ApJ, 732, 35
- Ménard & Fukugita (2012) Ménard B., Fukugita M., 2012, ApJ, 754, 116
- Ménard et al. (2008) Ménard B., Nestor D., Turnshek D., Quider A., Richards G., Chelouche D., Rao S., 2008, MNRAS, 385, 1053
- Ménard et al. (2011) Ménard B., Wild V., Nestor D., Quider A., Zibetti S., Rao S., Turnshek D., 2011, MNRAS, 417, 801
- Møller et al. (1998) Møller P., Warren S. J., Fynbo J. U., 1998, A&A, 330, 19
- Møller et al. (2013) Møller P., Fynbo J. P. U., Ledoux C., Nilsson K. K., 2013, MNRAS, 430, 2680
- Murphy & Bernet (2016) Murphy M. T., Bernet M. L., 2016, MNRAS, 455, 1043
- Murphy et al. (2007) Murphy M. T., Curran S. J., Webb J. K., Ménager H., Zych B. J., 2007, MNRAS, 376, 673
- Muzahid et al. (2015) Muzahid S., Srianand R., Charlton J., 2015, MNRAS, 448, 2840
- Neeleman et al. (2013) Neeleman M., Wolfe A. M., Prochaska J. X., Rafelski M., 2013, ApJ, 769, 54
- Neeleman et al. (2015) Neeleman M., Prochaska J. X., Wolfe A. M., 2015, ApJ, 800, 7
- Neeleman et al. (2016) Neeleman M., Prochaska J. X., Ribaudo J., Lehner N., Howk J. C., Rafelski M., Kanekar N., 2016, ApJ, 818, 113
- Nestor et al. (2005) Nestor D. B., Turnshek D. A., Rao S. M., 2005, ApJ, 628, 637
- Nestor et al. (2011) Nestor D. B., Johnson B. D., Wild V., Ménard B., Turnshek D. A., Rao S., Pettini M., 2011, MNRAS, 412, 1559
- Nielsen et al. (2013) Nielsen N. M., Churchill C. W., Kacprzak G. G., Murphy M. T., 2013, ApJ, 776, 114
- Noterdaeme et al. (2008) Noterdaeme P., Ledoux C., Petitjean P., Srianand R., 2008, A&A, 481, 327
- Noterdaeme et al. (2009) Noterdaeme P., Ledoux C., Srianand R., Petitjean P., Lopez S., 2009, A&A, 503, 765
- Noterdaeme et al. (2010) Noterdaeme P., Srianand R., Mohan V., 2010, MNRAS, 403, 906
- Noterdaeme et al. (2011) Noterdaeme P., Petitjean P., Srianand R., Ledoux C., López S., 2011, A&A, 526, L7
- Noterdaeme et al. (2012) Noterdaeme P., et al., 2012, A&A, 547, L1
- Noterdaeme et al. (2016) Noterdaeme P., et al., 2016, preprint, (arXiv:1609.01422)
- Petitjean & Bergeron (1990) Petitjean P., Bergeron J., 1990, A&A, 231, 309
- Petitjean et al. (2000) Petitjean P., Srianand R., Ledoux C., 2000, A&A, 364, L26
- Prochaska et al. (2008a) Prochaska J. X., Chen H.-W., Wolfe A. M., Dessauges-Zavadsky M., Bloom J. S., 2008a, ApJ, 672, 59
- Prochaska et al. (2008b) Prochaska J. X., Hennawi J. F., Herbert-Fort S., 2008b, ApJ, 675, 1002
- Prochter et al. (2006) Prochter G. E., Prochaska J. X., Burles S. M., 2006, ApJ, 639, 766
- Quider et al. (2011) Quider A. M., Nestor D. B., Turnshek D. A., Rao S. M., Monier E. M., Weyant A. N., Busche J. R., 2011, AJ, 141, 137
- Rafelski et al. (2014) Rafelski M., Neeleman M., Fumagalli M., Wolfe A. M., Prochaska J. X., 2014, ApJ, 782, L29
- Rahmani et al. (2012) Rahmani H., Srianand R., Gupta N., Petitjean P., Noterdaeme P., Vásquez D. A., 2012, MNRAS, 425, 556
- Rao et al. (2006) Rao S. M., Turnshek D. A., Nestor D. B., 2006, ApJ, 636, 610
- Rao et al. (2011) Rao S. M., Belfort-Mihalyi M., Turnshek D. A., Monier E. M., Nestor D. B., Quider A., 2011, MNRAS, 416, 1215
- Rubin et al. (2010) Rubin K. H. R., Weiner B. J., Koo D. C., Martin C. L., Prochaska J. X., Coil A. L., Newman J. A., 2010, ApJ, 719, 1503
- Sardane et al. (2015) Sardane G. M., Turnshek D. A., Rao S. M., 2015, MNRAS, 452, 3192
- Sargent et al. (1988) Sargent W. L. W., Steidel C. C., Boksenberg A., 1988, ApJ, 334, 22
- Savage & Sembach (1996) Savage B. D., Sembach K. R., 1996, ARA&A, 34, 279
- Shaw et al. (2016) Shaw G., Rawlins K., Srianand R., 2016, MNRAS, 459, 3234
- Srianand (1996) Srianand R., 1996, ApJ, 462, 643
- Srianand & Khare (1994) Srianand R., Khare P., 1994, ApJ, 428, 82
- Srianand et al. (2005) Srianand R., Petitjean P., Ledoux C., Ferland G., Shaw G., 2005, MNRAS, 362, 549
- Srianand et al. (2008) Srianand R., Gupta N., Petitjean P., Noterdaeme P., Saikia D. J., 2008, MNRAS, 391, L69
- Srianand et al. (2012) Srianand R., Gupta N., Petitjean P., Noterdaeme P., Ledoux C., Salter C. J., Saikia D. J., 2012, MNRAS, 421, 651
- Srianand et al. (2013) Srianand R., Gupta N., Rahmani H., Momjian E., Petitjean P., Noterdaeme P., 2013, MNRAS, 428, 2198
- Srianand et al. (2015) Srianand R., Gupta N., Momjian E., Vivek M., 2015, MNRAS, 451, 917
- Steidel (1995) Steidel C. C., 1995, in Meylan G., ed., QSO Absorption Lines. p. 139 (arXiv:astro-ph/9509098)
- Steidel & Sargent (1992) Steidel C. C., Sargent W. L. W., 1992, ApJS, 80, 1
- Tamburro et al. (2009) Tamburro D., Rix H.-W., Leroy A. K., Mac Low M.-M., Walter F., Kennicutt R. C., Brinks E., de Blok W. J. G., 2009, AJ, 137, 4424
- Tremonti et al. (2004) Tremonti C. A., et al., 2004, ApJ, 613, 898
- Turnshek et al. (2015) Turnshek D. A., Monier E. M., Rao S. M., Hamilton T. S., Sardane G. M., Held R., 2015, MNRAS, 449, 1536
- Vanden Berk et al. (2001) Vanden Berk D. E., et al., 2001, AJ, 122, 549
- Vladilo et al. (2008) Vladilo G., Prochaska J. X., Wolfe A. M., 2008, A&A, 478, 701
- Weiner et al. (2009) Weiner B. J., et al., 2009, ApJ, 692, 187
- White et al. (1997) White R. L., Becker R. H., Helfand D. J., Gregg M. D., 1997, ApJ, 475, 479
- Wild et al. (2006) Wild V., Hewett P. C., Pettini M., 2006, MNRAS, 367, 211
- Wolfe et al. (2005) Wolfe A. M., Gawiser E., Prochaska J. X., 2005, ARA&A, 43, 861
- Wolfire et al. (1995) Wolfire M. G., Hollenbach D., McKee C. F., Tielens A. G. G. M., Bakes E. L. O., 1995, ApJ, 443, 152
- York et al. (2000) York D. G., et al., 2000, AJ, 120, 1579
- York et al. (2006) York D. G., et al., 2006, MNRAS, 367, 945
- Zhu & Ménard (2013) Zhu G., Ménard B., 2013, ApJ, 770, 130
- Zibetti et al. (2007) Zibetti S., Ménard B., Nestor D. B., Quider A. M., Rao S. M., Turnshek D. A., 2007, ApJ, 658, 161
- Zwaan et al. (2015) Zwaan M. A., Liske J., Péroux C., Murphy M. T., Bouché N., Curran S. J., Biggs A. D., 2015, MNRAS, 453, 1268
- de Avillez & Breitschwerdt (2004) de Avillez M. A., Breitschwerdt D., 2004, A&A, 425, 899