Charge Density Waves and the Hidden Nesting of Purple Bronze K0.9Mo6O17
Abstract
We introduce the first multiorbital effective tight-binding model to describe the effect of electron-electron interactions in this system. Upon fixing all the effective hopping parameters in the normal state against an ab initio band structure, and with only the overall scale of the interactions as the sole adjustable parameter, we find that a self-consistent Hartree-Fock solution reproduces extremely well the experimental behavior of the charge density wave (CDW) order parameter in the full range , as well as the precise reciprocal space locations of the partial gap opening and Fermi arc development. The interaction strengths extracted from fitting to the experimental CDW gap are consistent with those derived from an independent Stoner-type analysis.
The layered purple bronze K0.9Mo6O17 (KMO) has a triple- charge density wave (CDW) phase below [1] and became the hallmark of “hidden nesting” [2, 3] because (i) despite its 3D layered structure, it has a strongly anisotropic Fermi surface (FS) topology, (ii) has a robust CDW phase below , (iii) does not develop a lattice distortion despite the commensurate CDW wave vector () [4], and (iv) none of the formal Fermi sheets are individually nested by . Although the most recent experiments favor a purely electronically driven CDW instability [4], the K and Na purple bronzes remain largely unexplored theoretically. Despite seminal work by Whangbo et al. establishing the essential of the noninteracting electronic structure [3], there is no encompassing microscopic model that addresses the role of interactions and is capable of reproducing the key experimental observations associated with the CDW phase. This contrasts with the related Li0.9Mo6O17, known to be quasi-1D and for which microscopic frameworks based on the Hubbard model [5] and Luttinger liquid theory [6] have been proposed.
In a recent experiment, Mou et al. reported an outstanding difference between electronic states in the bulk and at the surface of KMO, inferred from observations by angle-resolved photoemission spectroscopy (ARPES) of a much higher at the surface ( K) [4] and a tenfold increase of the associated “surface CDW gap.” These remarkable findings stress the urgency for a theoretical understanding of the mechanisms underlying such a large tunability of both and in the same compound and, in particular, clarifying whether or not that arises from variations in the strength of the relevant interactions, and whether interactions are strong or weak.
We establish here an effective model for KMO that (i) accurately accounts for the noninteracting physics of the relevant -derived bands, (ii) identifies the dominant Coulomb interactions and their magnitudes, (iii) captures extremely well the temperature dependence of the CDW gap, and (iv) accurately reproduces the band folding, renormalized FS, and Fermi arcs below .
I Noninteracting tight binding.
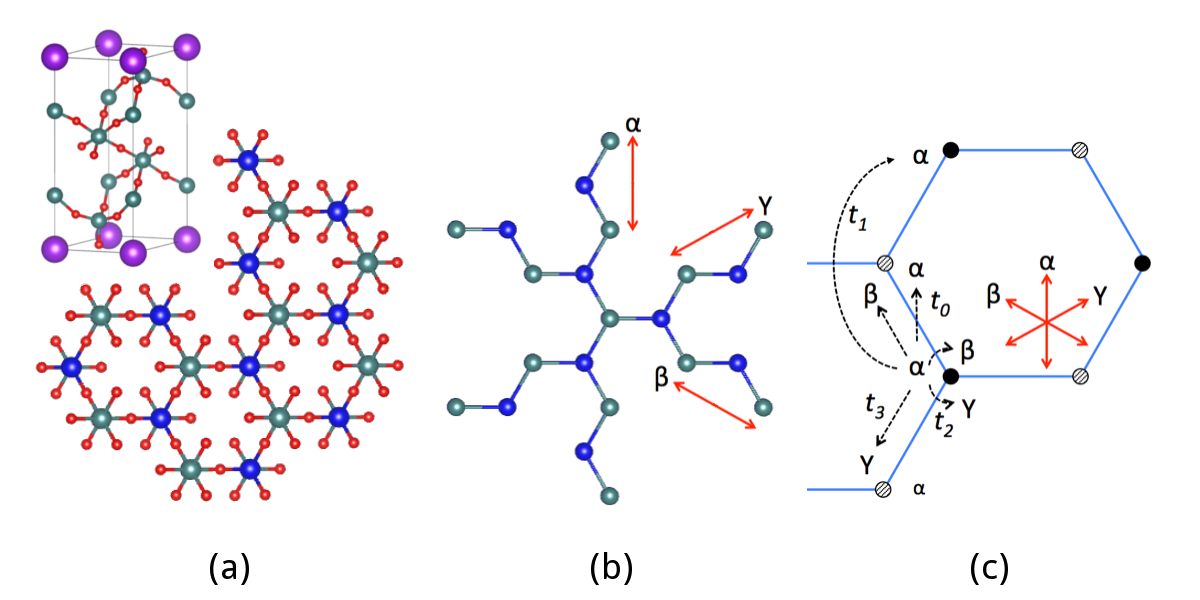
The crystal structure of KMO is illustrated in Fig. 1(a) [7, 8, 1]. The system is a good and strongly two-dimensional metal [7, 9, 10], understood as the result of the oxygen-mediated overlap between -derived orbitals in the two inner slabs that leads to three half-filled bands [7, 2]. The directional character of these effective overlaps leads to weakly hybridized quasi-1D Fermi sheets [2] [Fig. 2(a)] that underlie the hidden nesting and its CDW instability [3, 11, 12]. Partial gaps are believed to develop below , since the system loses only of its conductivity in the normal phase [7, 9, 10, 13].
Figure 1(a) shows that the network of Mo atoms in the electronically relevant two inner layers defines a honeycomb lattice. To make full use of the symmetry we introduce three effective and equivalent orbitals: and . Their overlap reflects the effective -mediated overlap between orbitals with a () character along the intra-(inter) chain directions. Each orbital is associated with one of the three equivalent directions denoted by the red arrows in Fig. 1(b). For example, in Fig. 1(c), there is a sizable hopping between orbitals along the upward-running zigzag chain, but a negligible one among orbitals along the other two zigzag directions, and equivalently for and . We consider the four hopping parameters represented in Fig. 1(c): and account for the intraorbital hopping (, , and ) among nearest and next-nearest neighbors along the corresponding zigzag direction, respectively; is an on-site interorbital hopping (, etc.); is a nearest-neighbor interorbital hopping on the bonds shared by the two corresponding chains (e.g., it represents the hopping between and ). The Fourier transform of this six-orbital tight-binding (TB) Hamiltonian is represented by
| (1) |
where destroys an electron with crystal momentum at orbital and sublattice . The explicit six-dimensional matrix is provided in supplementary information (SI) [14], together with the details of the ab initio calculations and an extended discussion of alternative approaches to obtain an appropriate TB model, such as through density-functional theory (DFT)-derived Wannier functions [15]. The TB parameters and chemical potential are determined by fitting the three partially filled bands to the DFT band structure within 1 eV of the Fermi level and ensuring the filling factor is preserved in the resulting TB [14]. We obtained meV.

Figure 2(a) shows that this effective Hamiltonian precisely captures the experimental FS [11, 4] and reproduces the overall features of the three occupied DFT bands Fig. 2(c). In particular, the two inner electron and outer hole pockets arise from the avoided crossings of the underlying 1D FSs as a result of the small hybridization (controlled by ) between these effective 1D chains. A naïve consideration of the Peierls instability for each independent 1D chain would not uniquely predict the CDW wave vectors in this system. Conversely, none of the individual 2D Fermi sheets is nested by the experimental , and the consideration of the nesting condition of each Fermi sheet independently would predict a different set of CDW wave vectors. This “contradiction” between the apparent nesting vectors of a strongly anisotropic 2D FS and the actual that describe the CDW is the essence of the hidden nesting concept [3]: The experimentally observed are preferred because each can simultaneously nest two of the three “hidden” 1D bands over the entire BZ.
II Coulomb interactions.
The good band structure fitting captured by the noninteracting model in Fig. 2(a) suggests that interactions between quasiparticles are relatively small, at least in the normal state. These are introduced in the framework of a multiorbital extended Hubbard model, similar to the description of iron-based superconductors [16], where only the direct coupling terms are considered (no exchange):
| (2) |
denotes the volume of the system, and is the density operator. Both on-site and neighboring interactions include intraorbital Hubbard terms between electrons with different spins and interorbital Coulomb-like terms. We distinguish interactions along the chain directions (intrachain) and across adjacent chains (interchain) due to the anisotropy in the orbitals involved. Our choice of three effective parameters captures the essential details of the electronic interactions in this system [14]: () defines intrachain intra(inter)-sublattice interactions (quasi-1D, along each equivalent zigzag), and the anisotropy factor determines the extent to which the full interacting Hamiltonian is more of a 1D nature ( for interactions only among orbitals belonging to the same chain) or more 2D ().
III Stoner analysis and Hartree-Fock treatment.
To assess the magnitude of the interactions capable of driving the system into the CDW phase, we studied the generalized Stoner criterion for this instability along the same lines used, for example, in multiorbital iron-based superconductors [16]. The RPA is used to obtain the strength of the interaction parameters compatible with the experimental at [14]. Fig. 2(b) shows the dominant diagonal element (intrasublattice and intraorbital) of the electronic susceptibility matrix as a function of the temperature and momentum along in two cases: the 1D limit of decoupled chains and the full 2D TB model (see Supplemental Material for details [14]). From the Stoner criterion, we estimate . The upper bound is obtained in the limit of 1D-only interactions, , and the lower for isotropic interactions, . Since these are considerably smaller than the bandwidth, we may treat this as a weak or intermediate coupling system, justifying a posteriori the analysis based on the RPA. Note that the bare susceptibility curves plotted in Fig. 2(b) at 115 and 220 K differ only slightly, which suggests that a small change in the interaction parameters (a different screening environment) can easily raise from 115 to 220 K.
In order to describe the temperature dependence of the CDW order parameter, we perform a Hartree-Fock mean field (MF) decoupling of the interactions in Eq. (2) and minimize the electronic free energy with respect to the order parameters , where [14]. The minimization is done numerically due to the large 24-dimensional structure of the decoupled Hamiltonian ().

Consider first the simpler case of interactions restricted to each chain (intraorbital interactions, but complete 2D hoppings). In this case, the MF solution depends only on the difference ; we set and vary until is either 115 or 220 K, in order to compare the results with the experimental transitions attributed to the bulk and surface [4]. The temperature dependence of the gap () along is presented in Fig. 3(a). Since in this case the Coulomb interactions are determined by one effective parameter only, it is not surprising to find a BCS-like behavior in . Significantly, in order to make K, we must have , in agreement with our independent estimate based on the generalized Stoner criterion. Moreover, the zero-temperature gap , consistent with the experimental value attributed to the bulk [4]. In other words, three nearly independent zigzag chains seemingly suffice to explain well, quantitative and qualitatively, the bulk properties of KMO at the MF level. Figure 3(a) also illustrates the high sensitivity of to the magnitude of , since a 10% increase in the latter causes a twofold amplification of . Even though this suggests that can be very sensitive to the local details of the interactions (screening, in particular) and might be easily placed at the values K attributed to the surface, the associated low-temperature gap is far from the reported value of [4]. Conversely, setting () leads to K.
The more general, yet manageable, model of the Coulomb interactions introduces the three independent parameters , , and described earlier. Compared with the 1D limit, the CDW phase is now more stable as, for the same value of , we obtain a larger . If , , and , we obtain perfect agreement with the experimentally reported values [4]. The full temperature dependence shown in Fig. 3(b) matches very well with the experimental data. Note that this parameter set is still far from the isotropic limit and fulfills the Stoner bounds obtained above.

Furthermore, the model captures the crucial fact that the gap opens at the right position along in the folded BZ. This is shown in detail in Fig. 4(a), where, moreover, it is clear that the point remains gapless despite a finite amount of repulsion among some of the folded bands. This ensures that the system undergoes a metal-metal transition, rather than metal-insulator, upon entering the CDW phase, in accord with transport experiments [17, 10]. The remaining electron-hole pockets at in the CDW phase are also consistent with the experimental fact that charge carriers change from electron- to hole-like when entering the CDW [7, 1]. To better illustrate the FS restructuring below , the spectral function at is shown in Fig. 4(b): The gaps along and the finite band overlaps at create Fermi arcs centered at , compatible with the ARPES observations of enhanced spectral weight at these points [11, 4]. The corresponding density of states (DOS) of the noninteracting model in the normal state is compared with the -integrated spectral function in Fig. 4(c). Whereas the former is nearly constant near , the spectral function has a marked dip below , in qualitative agreement with earlier STM measurements [18] but remains finite as anticipated from the persistence of the Fermi arcs in Fig. 4(b).
We note that this Fermi arc scenario is the one intuitively expected within the hidden nesting picture: Since the hybridization between the underlying 1D chains is strongest at where they would otherwise be degenerate, the vicinity of this point is where the least nesting occurs among the 1D Fermi surfaces. The tendency for gap opening is strongest at (stronger nesting) than at . Moreover, the experimental FS at [11, 4] has a clear predominance of spectral weight at , consistent with Fig. 4(b) 11 1 Nevertheless, we have explicitly verified that the model easily accommodates a fully gapped scenario where both and become gapped below by increasing , which renders the interactions more two-dimensional. .
Figure 4(a) also shows that there are, in fact, two “gaps” along because there are two quasidegenerate bands there in the normal state as a result of the BZ folding. Whereas in the 1D treatment of the interactions, the gap opens without lifting this degeneracy, the more 2D interaction lifts it and the two bands are pushed down by different amounts, as shown explicitly in Fig. 4(a) and 4(b) and in Fig. 3(b) as a function of the temperature. The ARPES data also reveal two gaps at this point, one attributed to the bulk and another that backbends below attributed to the surface layers. It is tempting to relate them to the features of Fig. 4(a) along . However, on the one hand, the splitting of the two bands below seen in Fig. 4(a) cannot correspond to the two bands in the experiment, because the splitting of either of them follows a BCS trend as a function of the temperature [Fig. 3(b)], unlike the surface gap that seems to set in instantaneously below . On the other hand, the second band in Fig. 4(a) is a consequence of the BZ folding, and the experiments, despite the robust CDW, show no sign of backfolding in the bands attributed to the bulk of the system. Hence, either the second band that is being pushed down along in Fig. 4(a) lies further away from the Fermi level in the real system than with the parameters chosen in Fig. 4(a), or the backfolded spectral weight is too weak to be detected experimentally, in which case this secondary gap would be discernible only in the extended zone, on the FSs cut by the BZ boundary, for example. Measurements along larger portions of the extended zone would help clarify the renormalization of the band structure in the CDW phase.
IV Discussion.
The essence of our model lies in the three coupled effective 1D chains illustrated in Fig. 1(b). Their weak hybridization entails a strongly anisotropic FS and, through hidden nesting and Coulomb interactions, determines a robust CDW instability [2, 3]. The interaction parameters estimated in the RPA have magnitudes in the range eV expected for the octahedral MoO6 network [20] and are entirely consistent with the magnitudes needed to reproduce the experimental temperature dependence of the gap in (Fig. 3). The emergence of a band gap at this particular point in the BZ is not an obvious expectation a priori (it is not nested by ), and is another strong validating point.
That the experimental and full dependence of the CDW gap are remarkably well described within a MF BCS-type theory (Fig. 3) might seem unexpected at first given the reduced dimensionality. We attribute it to the combination of three factors: (i) Although the effective 1D chains are a useful concept for the modeling, we saw that the actual system is quasi-2D given the nature of the electronic hybridization and interactions, which stabilizes the MF solution; (ii) phase fluctuations, which tend to be the dominant suppressor of CDW order, are gapped in a commensurate CDW [21]; (iii) the FS is fully gapped at except for the tiny pockets or arcs we find around (Fig. 4) and where ARPES reveals pseudogap-type behavior [12].
Points (ii) and (iii) leave essentially no elementary nor collective excitations to destabilize the MF solution, indicating that the Ginzburg criterion may be well satisfied over a large range of temperature below . Point (ii) is particularly important, in that it might explain not only the MF behavior of the bulk but also the strikingly different signatures of the gap attributed to the surface: A simple rescaling of the parameters cannot explain the secondary gap along seen in ARPES. This would seem to indicate that different microscopic details could be in play at the surface (this sometimes called “extraordinary phase transition” is common in other correlated systems [22, 23]). A strongly-correlated state has been suggested [4] but, not only is that in sharp contrast with the weak-coupling nature of this system in the bulk, it is incompatible with the experimental absence of any anomalous signatures in the normal state (including quasiparticle renormalization) other than the “anomalous” secondary gap. Another possibility, that we favor, is that fluctuations might be strongly enhanced at the surface. Figure 3(a) shows that is very sensitive to the strength of interactions, as would be required to explain the higher stability of the CDW at the surface from reduced screening, but the experimental dependence is highly non-MF there. However, reduced screening combined with bolstered fluctuations can explain the downsizing in surface in comparison with that (over)estimated in the MF based on the measured surface gap. The lock-in energy that drives commensurability is usually reinforced by interlayer CDW coupling, which will diminish for the surface slab. That can reduce the gap of the phase modes or even suppress it, since incommensurability can be favored under poor screening [24], thus explaining the enhanced fluctuations. Current experiments are not conclusive as to the (in)commensurability on the surface but do reveal superlattice diffraction peaks much above the “surface ,” albeit broadened and weak [4]. This might point to phase fluctuations through discommensurations taking place at the surface, in line with the above picture.
Acknowledgements.
We thank A.H. Castro Neto, C. Chen, and F. Hipólito for fruitful discussions. The Singapore National Research Foundation supported this work with Grants No. NRF-CRP6-2010-05 (L.S. and V.M.P.) and No. NRF-NRFF2013-03 (H.L.).References
- [1] M. Greenblatt, Chem. Rev. 88, 31 (1988).
- [2] M. H. Whangbo, E. Canadell, and C. Schlenker, J. Am. Chem. Soc. 109, 6308 (1987).
- [3] M. H. Whangbo, E. Canadell, P. Foury, and J. -P. Pouget, Science 252, 96 (1991).
- [4] D. Mou, A. Sapkota, H.-H. Kung, V. Krapivin, Y. Wu, A. Kreyssig, X. Zhou, A. I. Goldman, G. Blumberg, R. Flint, and A. Kaminski, Phys. Rev. Lett. 116, 196401 (2016).
- [5] J. Merino and R. H. McKenzie, Phys. Rev. B 85, 235128 (2012).
- [6] P. Chudzinski, T. Jarlborg, and T. Giamarchi, Phys. Rev. B 86, 075147 (2012).
- [7] R. Buder, J. Devenyi, J. Dumas, J. Marcus, J. Mercier, C. Schlenker, and H. Vincent, J. Phys. (Paris) Lett. 43, 59 (1982).
- [8] H. Vincent, M. Ghedira, J. Marcus, J. Mercier, and C. Schlenker, J. Solid State Chem. 47, 113 (1983).
- [9] L. Degiorgi, P. Wachter, M. Greenblatt, W. H. McCarroll, K. V. Ramanujachary, J. Marcus, and C. Schlenker, Phys. Rev. B 38, 5821 (1988).
- [10] X. Xu, A. F. Bangura, C. Q. Niu, M. Greenblatt, S. Yue, C. Panagopoulos, and N. E. Hussey, Phys. Rev. B 85, 195101 (2012).
- [11] G. H. Gweon, J. W. Allen, J. A. Clack, Y. X. Zhang, D. M. Poirier, P. J. Benning, C. G. Olson, J. Marcus, and C. Schlenker, Phys. Rev. B 55, R13353 (1997).
- [12] M. A. Valbuena, J. Avila, V. Pantin, S. Drouard, H. Guyot, and M. C. Asensio, Appl. Surf. Sci. 252, 5415 (2006).
- [13] K. Breuer, C. Stagarescu, K. E. Smith, M. Greenblatt, and K. Ramanujachary, Phys. Rev. Lett. 76, 3172 (1996).
- [14] Details are provided in Supplementary Material which includes Refs. [25, 26, 27, 28, 29, 30, 31, 32, 33].
- [15] N. Marzari, A. A. Mostofi, J. R. Yates, I. Souza, and D. Vanderbilt, Rev. Mod. Phys. 84, 1419 (2012).
- [16] S. Graser, T. A Maier, P. J. Hirschfeld, and D. J Scalapino, New J. Phys. 11, 025016 (2009).
- [17] C. Escribe-Filippini K. Konaté, J. Marcus, C. Schlenker, R. Almairac, R. Ayroles, and C. Roucau, Philos. Mag. B 50, 321 (1984).
- [18] P. Mallet, K. M. Zimmermann, P. Chevalier, J. Marcus, J. Y. Veuillen, and J. M. Gomez Rodriguez, Phys. Rev. B 60, 2122 (1999).
- [19] Nevertheless, we have explicitly verified that the model easily accommodates a fully gapped scenario where both and become gapped below by increasing , which renders the interactions more two-dimensional.
- [20] M. Nuss and M. Aichhorn, Phys. Rev. B 89, 045125 (2014).
- [21] G. Gruner, Density Waves in Solids (Addison-Wesley, Reading, MA, 1994).
- [22] C. Brun, Z. Z. Wang, P. Monceau, and S. Brazovskii, Phys. Rev. Lett. 104, 256403 (2010).
- [23] J. A. Rosen et al., Nat. Commun. 4, 1977 (2013).
- [24] S. E. Brown, E. Fradkin, and S. A. Kivelson, Phys. Rev. B 71, 224512 (2005).
- [25] J. P. Perdew, K. Burke, and M. Ernzerhof, Phys. Rev. Lett. 77, 3865 (1996).
- [26] T. Moriya, Spin Fluctuations in Itinerant Electron Magnetism (Springer, New York, 1985).
- [27] W. McMillan, Phys. Rev. B 12, 1187 (1975).
- [28] X. Gonze et al., Comput. Phys. Commun. 180, 2582 (2009).
- [29] J. Kuneš, R. Arita, P. Wissgott, A. Toschi, H. Ikeda, and K. Held, Comp.Phys. Commun. 181, 1888 (2010).
- [30] O. Parcollet, M. Ferrero, T. Ayral, H. Hafermann, I. Krivenko, L. Messio, and P. Seth, Comp.Phys. Commun. 196, 398 (2015).
- [31] D. Sénéchal, arXiv:0806.2690 .
- [32] B. Edegger, H. Evertz, and R. Noack, Physical review letters 96, 146401 (2006).
- [33] T. Podlich, M. Klinke, B. Nansseu, M. Waelsch, R. Bienert, J. He, R. Jin, D. Mandrus, and R. Matzdorf, J. Phys. Condens. Matter 25, 014008 (2013).
See pages 1 of CDW_in_KMoO_Sup.pdfSee pages 2 of CDW_in_KMoO_Sup.pdfSee pages 3 of CDW_in_KMoO_Sup.pdfSee pages 4 of CDW_in_KMoO_Sup.pdfSee pages 5 of CDW_in_KMoO_Sup.pdfSee pages 6 of CDW_in_KMoO_Sup.pdfSee pages 7 of CDW_in_KMoO_Sup.pdfSee pages 8 of CDW_in_KMoO_Sup.pdfSee pages 9 of CDW_in_KMoO_Sup.pdfSee pages 10 of CDW_in_KMoO_Sup.pdfSee pages 11 of CDW_in_KMoO_Sup.pdfSee pages 12 of CDW_in_KMoO_Sup.pdfSee pages 13 of CDW_in_KMoO_Sup.pdf