The Role of Host Galaxy for the Environmental Dependence of Active Nuclei in Local Galaxies
Abstract
We discuss the environment of local hard X-ray selected active galaxies, with reference to two independent group catalogues. We find that the fraction of these AGN in S0 host galaxies decreases strongly as a function of galaxy group size (halo mass) – which contrasts with the increasing fraction of galaxies of S0 type in denser environments. However, there is no evidence for an environmental dependence of AGN in spiral galaxies. Because most AGN are found in spiral galaxies, this dilutes the signature of environmental dependence for the population as a whole. We argue that the differing results for AGN in disk-dominated and bulge-dominated galaxies is related to the source of the gas fuelling the AGN, and so may also impact the luminosity function, duty cycle, and obscuration. We find that there is a significant difference in the luminosity function for AGN in spiral and S0 galaxies, and tentative evidence for some difference in the fraction of obscured AGN.
Keywords:
galaxies: active – galaxies: Seyfert – galaxies: nuclei – galaxies: haloes – galaxies: luminosity function1 Introduction
The role of environment in the triggering of active galactic nuclei (AGN) is a topic that has received much attention in the literature. One reason is that, because we understand that interactions and mergers may lead to gas inflow and hence accretion onto a central massive black hole, there has been a general expectation that AGN should exist in denser environments than inactive galaxies. However, finding such a link has proven to be difficult and any relations between AGN and environment are weak. Sabater et al. (2013) summarize some specific issues that may contribute to the lack of a clear consensus. They point out that there are many definitions of ‘environment’, which may be local or large scale, including a high local density of neighbours, membership of a group or cluster and the relative location within that group or cluster, and galaxy-galaxy interactions (e.g. pairs). They also note that the environmental dependence may differ according to AGN luminosity and whether the physical feeding mechanism is radiatively efficient (e.g. X-ray and optical samples) or not (e.g. low excitation radio samples). An additional complication is the short timescale variability of AGN (Hickox et al., 2014), which implies that comparing AGN to a control sample may completely remove any relation between the AGN and the phenomenon being studied. As described by Davies et al. (2014), a simple way to understand this intuitively is to hypothesize that, for example, gas inflow is triggered at some point in every galaxy that is part of a group. Over a Gyr timescale, inflow will occur at different times in different galaxies, perhaps more than once. In any snapshot, one sees only a random subset of active galaxies, which will be different for another snapshot. One might conclude from a snapshot that AGN fuelling is related to the group environment; but since at any given time many galaxies in the group are inactive, the conclusion from using a control sample would be that it is not, contradicting the original hypothesis. A way to avoid this problem could be to look at the incidence of AGN activity as a function of environment, for example as was done by Arnold et al. (2009). With a sample of 10 groups and 6 clusters, they find that the fraction of AGN (with erg s-1) in groups is a factor 2 higher than in clusters, although the result has marginal significance. Due to concerns about the differing morphological mix of galaxies in these different environments, they also looked at the AGN fraction in early type galaxies, finding a similar result.
Many other studies of the environment of X-ray selected AGN have used correlation analysis to assess the clustering bias on different scales as well as the typical halo mass. Recent examples include Gilli et al. (2009) who found a strong clustering signal for AGN with median and erg s-1. The correlation length matched that of galaxies with stellar mass M⊙, and implied a typical halo mass of M⊙. Fanidakis et al. (2013) found that AGN (erg s) typically reside in haloes of mass M⊙. DiPompeo et al. (2014) found similar halo masses for the infrared selected AGN they studied at , with M⊙ and M⊙ depending on whether the AGN are obscured or not. These papers highlight that the luminosity, selection technique, and redshift of an AGN population are also important factors in assessing environment. Indeed, Martini et al. (2013) show that at –1.5 there may be a reversal in the incidence of AGN in clusters versus the field.
More locally, using a large number of galaxies from the Sloan Digital Sky Survery (SDSS), with AGN identified via their [O III] line emission, Li et al. (2006) found little difference between the clustering of AGN and control galaxies on scales greater than 1 Mpc, suggesting that the halos of active and inactive galaxies have similar masses. Between 100 kpc and 1 Mpc AGN were more weakly clustered, a result these authors argued could be explained if AGN are preferentially located at the centres of their haloes. And at scales less than 70 kpc, AGN appeared to be marginally more clustered. The importance of the local environment was also highlighted by Serber et al. (2006), who looked at quasars (identified by ) in the SDSS, finding they are overdense on scales 100 kpc, but have no difference compared to the general population at larger 1 Mpc scales. This suggests that galaxy-galaxy interactions might be important. However, from a snapshot survey of AGN (selected in the 0.3-3.5 keV soft X-ray band, and identified as AGN using optical emission line widths and ratios), Schade, Boyle, & Letwasky (2000) emphasized the lack of evidence for strong interactions or merging activity. Indeed, Sabater et al. (2015) have argued that the availability of cold gas in the nuclear regions, rather than local galaxy density or galaxy-galaxy interactions, is the key driver for AGN activity and luminosity. In contrast, among very hard X-ray selected galaxies the situation may be different, since Koss et al. (2010) found a higher fraction of interactions and close pairs of galaxies among these AGN than in the general galaxy population.
Schade, Boyle, & Letwasky (2000) also noted that the host galaxies of AGN appear to be drawn at random from the overall galaxy population, although with a slight bias towards early types. The difference in the environment for early type and late type AGN hosts was the specific focus of a study by de Souza et al. (2016), who selected Seyferts from the SDSS via optical line ratios. They found that the fraction of Seyferts in spiral hosts is independent of their radial location in the halo and the halo mass, a result that matches our findings for spiral galaxies in this paper. However they show that the Seyfert fraction in elliptical galaxies appears to increase at larger cluster radii, although it is generally lower in more massive halos. Reconciling this result with Wilman & Erwin (2012) who found a clear trend with halo mass for the AGN fraction in elliptical hosts, emphasizes the role of AGN selection. These authors show that in this case the increase in AGN fraction both with stellar mass and with halo mass is driven by radio AGN rather than radiatively efficient Seyferts.
In our analysis here, we employ a technique that is complementary to the commonly used correlation analysis. We use existing group catalogues to assess environment, and look simply at the sizes of the groups (i.e. halo occupation number, which is related to halo mass) in which local, moderately luminous AGN are found. We make use of the very hard X-ray selected AGN in the Swift BAT catalogue and look at the environmental dependence separately for the two most common types of host galaxy, spirals and lenticulars. In doing so, we build on the work of Davies et al. (2014) and Hicks et al. (2013), who discuss secular inflow and external accretion in disk-dominated and bulge-dominated hosts. In addition to their own sample, these authors made use of published integral field spectroscopy data of AGN with matched inactive samples (Dumas et al., 2007; Westoby et al., 2012). Comparing the spatially resolved stellar and gas kinematics, they found that the presence of gas and its co- versus counter- rotation with respect to the stars was consistent with secular inflow from the host galaxy for AGN in spirals but with accretion from the environment for S0 galaxies. Similar misalignments between the stellar and molecular gas kinematics have also been reported for two early type LINERs (Müller-Sánchez et al., 2013). However, these authors could not probe the environment itself. That is our aim in this paper, to test whether the environmental dependence differs for AGN in spirals versus S0 hosts.
In Sec. 2 we describe the sample of AGN we use and the group catalogues with which we cross-correlate them. The analysis itself is the focus of Sec. 3. Then in Sec. 4 and Sec. 5 we discuss the additional topics of luminosity function and obscured fraction, that one may expect to differ if the environmental dependence of AGN activity depends itself on the host galaxy. We then finish with a summary of our conclusions in Sec. 6.
2 Sample Selection
2.1 Active Galaxies
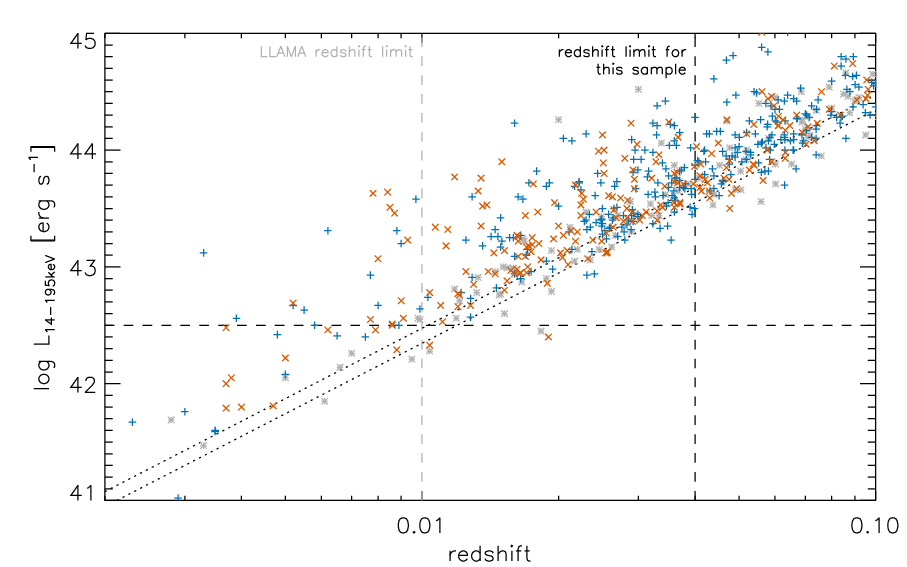
The sample of AGN we study is related to the LLAMA (Local Luminous AGN with Matched Analogues) sample described in Davies et al. (2015), who also give a detailed description of the selection and the rationale for it. The key aspect is that these are selected from the all-sky flux limited 14–195 keV 58-month Swift BAT survey in such a way as to create a volume limited sample of active galaxies that is as unbiassed as possible, for detailed study using high resolution spectroscopy and adaptive optics integral field spectroscopy. The sole selection criteria were (corresponding to a distance of Mpc), erg s (using redshift distance), and so that they are observable from the VLT. This yielded 20 AGN. A set of inactive galaxies were selected to match in terms of host galaxy type, mass (using H-band luminosity as a proxy), inclination, presence of a bar, and distance.
Although small, this volume limited sample is sufficient for detailed studies of the molecular and ionised gas kinematics and distributions, as well as the stellar kinematics and populations, in the nuclear and circumnuclear regions. And, despite being insufficient itself for a statistical analysis of the type discussed in this paper, it provides the rationale for this work. In such a small sample, the group properties of individual galaxies can be assessed carefully using a variety of catalogues and metrics. A suprising outcome of doing so was that, while the inactive galaxies (both early and late types) were distributed fairly evenly across the range of environments from clusters through groups to isolated galaxies, the situation was different for the AGN. While for AGN in late type hosts the environmental distribution matched the inactive late type galaxies, none of the AGN in early type hosts were in large groups or clusters. This is indicative of a strong environmental effect for AGN in early type hosts, but the number of objects involved is too small to reach a robust conclusion.
In order to increase the number of AGN for the purposes of the study here, we go beyond the LLAMA sample while keeping as close as possible to the original ideal. We therefore select all AGN at with erg s in the 70-month catalogue (Baumgartner et al., 2013) as shown in Fig. 1. In addition we have excluded two objects for which the counterparts were mis-identified and are at redshift higher than our threshold, and included a number of additional sources that meet our criteria as given in Ricci et al. (in prep.) and Ricci et al. (2015). This yields 350 AGN. This sample is no longer volume limited but otherwise imposes no additional bias compared to the LLAMA sample. An obvious concern would be that the large number of more distant AGN that are excluded because they are below the survey flux limit, may impose a redshift bias on the distribution of host galaxy morphology. In order to address this, we show in Sec. 2.2 for the specific context of host galaxy morphological classification, that there is no bias with respect to redshift.


2.2 Group Catalogues
To assess the environment we cross-correlate the AGN with two group/cluster catalogues, which are both based largely on the 2MASS Redshift Survey (Huchra et al., 2012) of galaxies brighter than but in which the groupings are defined in completely different ways. Using two independent catalogues based on the same set of galaxies allows us to minimise the impact of any bias from the way the groups are defined, and better assess the uncertainties.
The first catalogue is that of Tempel et al. (2016), which is based on a friends-of-friends algorithm with additional refinement procedures, applied to a combined catalogue of galaxies from several surveys of the local universe. Since the galaxy identifications are based on the PGC catalogue (Paturel et al. 2003, constituting the framework of the HYPERLEDA database), we have adopted the host galaxy morphological classifications given in the PGC catalogue. Of the selected AGN, we find 199 in the Tempel et al. (2016) catalogue that also have morphological host galaxy classifications.
The second catalogue is that of Tully (2015a), for which groups were constructed using an iterative method in which initial halos are defined according to scaling relations, and then overlapping halos are assigned to a single group halo. Host galaxy morphological classifications from de Vaucouleurs et al. (1991) are given in the data tables of this catalogue, and so we use those. In a comparison of their catalogue to this one, Tempel et al. (2016) pointed out that the groups are only reliable to . We have therefore limited our analysis with the Tully (2015a) catalogue to that redshift (noting that this restriction applies to the groups rather than individual galaxies, a few of which have redshifts greater than 0.033). This leaves 229 AGN with both group classifications and host classifications.
As comparison samples we take all the galaxies that have morphological identifications in each group catalogue to the same redshift limit. This yields about 23500 and 27000 objects with host classifications in the Tempel et al. (2016) and Tully (2015a) group catalogues respectively.
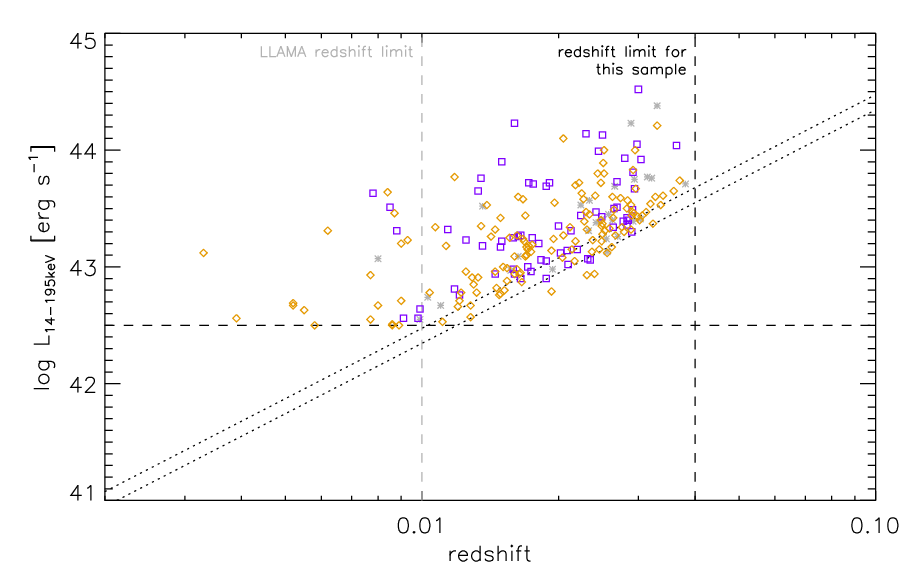
In order to confirm that there is no major difference in galaxy mass between the active and comparison samples, we plot in Fig. 2 the H-band luminosity calculated from the J-H and J-K colours and K-band luminosity given by Tully (2015a). The H-band luminosity can be used as a proxy for stellar mass since the uncertainty in the H-band mass-to-light ratio is about 0.2 dex (Davies et al. 2015, using masses from Koss et al. 2011). For the AGN hosts we find a median luminosity of with a distribution of dex; while for the galaxies as a whole we find with dex. When comparing the galaxy luminosities of AGN in S0 and spiral hosts, we find in both cases with dex. Using the morphological classifications in Tully (2015a) we also show in Fig. 4 that there is no bias in host galaxy type with redshift due to the flux limited nature of the sample.
2.3 Halo mass and Group Size

| log Mhalo [M⊙] | Ngal | [km/s-1] |
|---|---|---|
| 12 | 1 | 90 |
| 13 | 3 | 200 |
| 14 | 15 | 450 |
| 15 | 200 | 900 |
An important consideration is whether the environment should be defined in terms of halo mass or group size (i.e. halo occupation number). Halo mass is more closely linked to the theoretical framework of dark matter and so is easier to apply in a cosmological context, while group size is more directly linked to the observations. Halo mass is also insensitive to the inclusion of additional low mass galaxies while the group size is dependent on the sensitivity, and hence lower mass limit, of the catalogue. On the other hand, if using group size it is easy to distinguish between a single massive galaxy and a group of lower mass galaxies even though their respective (group) halo masses may be similar. And, perhaps most importantly, halo mass is not easy to derive for groups with only a few galaxies. Because most galaxies are in groups of 3 or less, we use group size as the metric for environment during our analysis.
We note, however, that there is a reasonably good relation between the group size and mean halo mass. This is shown in Fig. 5 for the groups in the Tempel et al. (2016) catalogue, where halo mass was derived by the authors based on the kinematics and separations of the galaxies in each group. We speculate that the large scatter in halo mass for small groups suggests that many of these groups may not be gravitationally bound (i.e. the halo mass may be over-estimated). The figure matches a similar plot shown in Fig. 3 of Yang et al. (2005) for the groups that those authors defined using SDSS galaxies. And similar scaling relations have been shown by Wilman & Erwin (2012) and Tully (2015b), the latter of which were used to build the group catalogue in Tully (2015a).
Comparison of different results in the literature can be difficult because some authors use halo mass, while others use the dispersion of the galaxy systemic velocities or number of galaxies (halo occupation number) in the group or cluster. An approximate conversion between these quantities is given in Table 1. This rough guide is valid for typical depths of relevant wide-field surveys (i.e. the depth to which all-sky surveys are largely complete within at least the local 100 Mpc volume) over the last decade, for galaxies with stellar mass of order M⊙. It is valid locally at , but on the other hand many of the studies of halo mass of X-ray selected AGN have been performed at . Moster et al. (2010) looked at how the occupation number and stellar-to-halo mass ratio depend on both halo mass and redshift, finding that from to 1 there is at most a reduction by a factor 2 in the stellar mass for halos of M⊙, with less difference at higher halo mass. Thus, the conversions given in Table 1 can be used up to at a precision that is sufficient for the analysis presented in this paper.
3 The Role of Host Galaxy for Environmental Dependence


Before embarking on an analysis of the AGN environments, we first confirm that the group catalogues reproduce the well-established morphology density relation. The expected result appears in Fig 6, which shows that the fraction of spirals (Sa to Sd) in dense environments is reduced from about 70% to 30%, while the fraction of S0 (including S0/a) hosts increases from 20% to 40%. And, although they are not the focus of this paper, it also shows that the fraction of ellipticals, while smaller still, also increases with environment density. These trends have been known for decades (Dressler, 1980), and have been the subject of numerous studies at redshifts from (Goto et al., 2003; Wilman & Erwin, 2012) to (Smith et al., 2005; Postman et al., 2005), and have been extended to a kinematic relation (Cappellari et al., 2011). We do not discuss this relation further, but use it only to set the context for further analysis focussing on the AGN sub-population.
3.1 Typical Group Size and Halo Mass


A number of recent studies of the environments of X-ray selected AGN have used correlation functions to assess the clustering bias on different angular scales. They have concluded that AGN are typically found in halos with masses of –13 (Gilli et al., 2009; Fanidakis et al., 2013; DiPompeo et al., 2014; Georgakakis et al., 2014). Based on the approximate conversion to halo occupation number given in Table 1, this corresponds to small groups such as pairs and triplets of galaxies. And, as can be seen in Fig. 7, about 2/3 of local hard X-ray selected AGN can be found in groups with 1–3 members – a result that is consistent with the conclusions of Arnold et al. (2009) that the fraction of X-ray selected AGN at increases from clusters to groups and Martini et al. (2013) that at the majority of AGN are found in the field. This applies to the AGN populations as a whole, as well as to the two most common types (spiral and S0 galaxies) separately. It also applies to the galaxy population, irrespective of whether the galaxies are active or inactive: 2/3 of the galaxies listed in the group catalogues belong to groups with only 1–3 members. Thus we confirm the emerging consensus that the majority of AGN are found in halos containing 1–3 galaxies. However, we caution that this is most likely due to the strongly skewed group size distribution of galaxies apparent in Fig. 7 (i.e. completely dominated by small groups). Unless there were a very strong trend of AGN fuelling with environment – in the specific sense that despite the majority of galaxies being in small groups there would be almost no AGN in groups of that size – an inevitable conclusion will be that the distribution of AGN with group size will, to zeroth order, follow that of galaxies; and hence the typical halo/group size of AGN will roughly match that of galaxies. Fig. 7 shows that AGN do have a similar group size distribution as galaxies and hence appear to be distributed randomly among them. This could at least partially be understood as a result of AGN variability (Hickox et al., 2014). It is only when one looks deeper, as we do in Sec. 3.2, that the underlying trends and causes begin to emerge.
3.2 AGN in disk versus bulge dominated galaxies

In this section we look at the fraction of galaxies that host AGN as a function of group size (or equivalently halo mass). We note that it is a comparative study, since the absolute AGN fractions are affected (by a factor ) by the exclusion of those without morphological classifications. Since only 5–10% of the AGN are in ellipticals or irregulars, we focus on the two most common host types. These are spirals (Sa to Sd), which account for almost 2/3 of the AGN; and lenticular or S0 (including S0/a) hosts, which account for almost 1/3 of the AGN. Of the 350 hard X-ray selected AGN, we find 229 in the Tully (2015a) group catalogue that are listed with clear host morphological classifications. Of these, 67 are in S0 hosts and 135 in spiral galaxies. Similarly, there are 199 AGN in the Tempel et al. (2016) group catalogue with host morphological classifications, of which 59 are S0 and 128 are spiral galaxies. Thus about 2/3 of hard X-ray selected AGN are in spirals and about 1/3 are in S0 hosts. A similar result was reported by Koss et al. (2011), who found a significant excess of spirals among Swift BAT AGN, which becomes even more pronounced at higher stellar masses. These are both consistent with the result found by Gabor et al. (2009) at in the COSMOS field, that the host galaxies of AGN span a broad range peaking between bulge-dominated and disk-dominated systems.
Using two group catalogues provides two estimates of the fraction of AGN in a given host type as a function of group size. Since the groupings are independent, we use them as if they were two separate samplings of the true distributions. For the two host types in each catalogue, we derive the uncertainties on the fraction of AGN in each bin under the assumption that a fixed number of AGN are distributed with equal probability throughout the respective galaxy population. We then calculate the weighted average of the two catalogues to provide the maximum likelihood estimate of the mean in each bin, together with its uncertainty. Fig. 8 shows the resulting distribution, based on the two catalogues, of the AGN fraction as a function of group size. Consistent results are also seen when looking at equivalent plots for each catalogue separately.
It is striking that the trend is different for spirals and S0 hosts. The left panel shows no evidence for a dependence on group size of the AGN fraction in spiral galaxies (although with the data available we cannot rule out a dependence). Indeed, using a test, we cannot reject the null hypothesis that the data are consistent with a uniform distribution of AGN. Given the predominance of AGN in spiral galaxies, this will tend to dilute any measurement of an environemtal impact in the population as a whole unless one takes account of the host type. In contrast, the right panel does show a very clear trend for the AGN fraction in S0 hosts, which decreases significantly in large groups and clusters. And a test indicates that the null hypothesis should be rejected with a 5.4 significance.
This result seems initially surprising because the fraction of S0 galaxies increases in denser environments. However, it is consistent with the conclusions of Davies et al. (2014). These authors argued that if AGN in spiral galaxies are fuelled via secular processes from the gas reservoir in the host, then one can expect (i) gas to be present in both active and inactive galaxies, (ii) that the gas and stars are always co-rotating, and (iii) that there is no environmental dependence. They tested these expectations by combining the samples of Dumas et al. (2007) and Westoby et al. (2012) for which there was spatially resolved kinematics for both stars and gas for active and matched inactive galaxies. Of the 10 AGN in disk-dominated galaxies, the gas and stars were co-rotating in all (although with misalignments up to 55∘ in some cases); and in the 7 controls, gas was detected in 5 and was also always co-rotating with the stars. Fig. 8 now confirms the lack of environmental dependence for AGN in spiral galaxies.
The same authors argued that if AGN in bulge-dominated galaxies were fuelled via external accretion of gas from the environment onto the galaxy, one can expect (i) a lack of gas in inactive galaxies that contrasts with the presence of gas in active galaxies, (ii) that the gas and stars should sometimes be counter-rotating, and (iii) that the environment matters. In testing these expectations, they found that of the 11 AGN in bulge-dominated galaxies, all had gas detections; and of the 8 for which stellar kinematics could be measured, in only 5 was the gas co-rotating with the stars while 3 exhibited counter-rotation. And for the 6 controls, gas was detected in only 2. Fig 8 now confirms that there is an environmental dependence for AGN in S0 galaxies, and that they are preferentially found in small groups.
This conclusion is consistent with the results of surveys of early-type galaxies (Sarzi et al., 2006; Davis et al., 2011), which found essentially no kinematically misaligned elliptical or lenticular galaxies in clusters. As explained also by Davis & Bureau (2016), it implies that external accretion of cold gas is shut off in dense environments. The reason is understood to be simply that the intra-cluster gas is ionised and so cannot easily be accreted. That S0 galaxies cannot accrete gas in dense environments could also explain why they cannot fuel AGN in such environments.
To end this section we speculate that if, as implied above, the source of gas differs for AGN in spirals and S0 hosts, one might expect differences also in luminosity function and obscuration. These ideas are explored further in Sec. 4 and 5 respectively. But first we attempt to verify our result in Sec. 3.3 using data from an independent analysis of AGN environment and host type.
3.3 An Independent Comparison

In order to cross-check our results, we make use of an independent sample which was defined and analysed by Wilman & Erwin (2012). It contains 911 bright () galaxies out to , based on the SDSS group catalogue of Yang et al. (2007). Host types are primarily taken from de Vaucouleurs et al. (1991), although there are some re-classifications by the authors, as well as some new classifications. The analysis of Wilman & Erwin (2012) focussed on how the morphology – spiral, lenticular (S0), or elliptical – relates to central versus satellite galaxies in groups and clusters; but it also addressed the topic of AGN, which were identified via standard optical emission line ratios. We simply re-use their data to look at the dependence of the AGN fraction on halo mass for different host types, without distinguishing whether the galaxy is central or satellite.

The result is given in Fig. 9, showing the AGN fraction as a function of halo mass for elliptical, spiral, and S0 galaxies separately. The AGN fractions, of up to a few ten percent, are very much higher than the equivalent fractions in Fig. 8 for our sample. The reason is that, rather than selecting only X-ray bright Seyferts, the optical line ratio selection used by Wilman & Erwin (2012) includes low luminosity AGN and LINERs. As pointed out by Ho (2008), about 10% of local galaxies have a Seyfert (and most of these are modest to low luminosity) while LINERs make up another 20%. As such, the difference in the numbers of AGN between our sample and that of Wilman & Erwin (2012) is expected as a direct result of the AGN selection.
For AGN in S0 galaxies there is a clear peak in the AGN fraction at –13.5 with a significant drop at high halo masses, while for spiral galaxies the trend is much shallower. This is qualitatively consistent with our finding in Fig. 8, that for spiral galaxies there is at most only a mild environmental dependence of AGN activity while for S0 galaxies the dependence is strong and disfavours cluster environments with large halo masses.
There is also a reduction in the AGN fractions to the smallest halo masses. We can only speculate that the reason for this may be related to the smallest halos (i.e. those below M⊙) containing only single moderate mass galaxies or small groups of low mass galaxies. One may expect these to contain AGN that, compared to those in more massive galaxies, are on average lower luminosity. And that may lead to issues about detectability, for example due to weak optical line emission.
Fig. 9 also shows that the fraction of AGN in ellipticals increases with halo masses, suggesting that the large scale fuelling mechanism for these is distinct from S0 galaxies. It is beyond the scope of this paper to discuss the cause of that trend in detail. But it is probably related to the increased incidence of elliptical galaxies in dense environments (see Fig. 6). Elliptical galaxies may host radio AGN, which typically accrete at lower Eddington ratios and are radiatively inefficient (Heckman & Best, 2014). They can be found in regimes where the large gas supply needed to power X-ray bright radiatively efficient AGN cannot be sustained.
4 Hard X-ray Luminosity Function
The hard X-ray (14–195 keV) luminosity distribution of the 229 AGN in our sample that are also in the Tully (2015a) group catalogue is shown as the black line in the left panel of Fig. 10. The distributions for AGN in S0 hosts and spiral hosts are overplotted. A simple statistical comparison using the two-sample Kolmogorov-Smirnov test shows that there is a 12% probability that the difference between the AGN luminosities in S0 hosts and spiral hosts could arise by chance. While this is not low enough to make the difference significant, it is important to realise that in this case the power of the test is limited because the strong central peak in the distributions is artificial. At higher luminosities the luminosity function drops steeply, while at lower luminosities we are missing a large number of AGN due to the flux limit of the Swift BAT survey.
In order to overcome this limitation, the right panels of Fig. 10 show the ratio of the distributions for AGN in spiral and S0 galaxies with respect to the parent, i.e. total AGN, distribution (and we note that Fig. 4 implies that there should be no bias resulting from missing low luminosity AGN due to the flux limited nature of the sample). These are relative luminosity functions in the sense that they show how the luminosity distribution for AGN in a specific type of host galaxy would appear if the luminosity distribution for the whole AGN population were flat. Uncertainties have been derived in a similar way as described in Sec. 3.2. To do so, we have generated random subsamples, of the appropriate size for the spirals and S0s respectively, whose average luminosity distribution matches that of the parent AGN sample. The standard deviation of the number of sources in each bin is adopted as the uncertainty on the measurement. It should be borne in mind that an implicit assumption of this method is that the spiral and S0 subsamples have the same distribution as the parent sample. To assess the difference in these distributions we focus on the slope (rather than the scale, which depends only on the relative number of AGN in S0 vs spiral hosts). The slopes for the relative luminosity distributions, shown as dashed lines in the right panels of Fig. 10, are for the AGN in S0 hosts and for those in spirals. A test indicates that the slopes are different with a 2.4 significance, confirming that the luminosities of AGN in spiral and S0 hosts are weighted towards lower and higher luminosities respectively.
We can understand this difference by considering the luminosity function as being dependent on both the black hole mass distribution and the Eddington ratio distribution. In this perspective, it is a secondary relation (note that since it reflects the absolute accretion rate, one might be tempted to consider it a primary relation; however, there would be a second constraint of black hole mass since a black hole cannot normally accrete above its Eddington limit). And we can show that the black hole mass distribution should differ. Laurikainen et al. (2010) (see also Weinzirl et al. 2009) find that the bulge fraction for S0 galaxies is 0.3–0.35, decreasing to 0.25 for Sa, 0.1–0.15 for Sb to Sc, and 0.1 for later types. One might therefore expect the bulge fraction to differ by a factor 2–3 between the average of the spiral galaxies and that of the S0 galaxies. Since the galaxies in our sample have similar total masses, as apparent from Fig. 2, their bulge masses should differ by about the factor of 2–3 above. Then, if these galaxies lie close to the relation which has a slope close to 1 (Marconi & Hunt, 2003; Häring & Rix, 2004), their black holes may also differ by a factor of 2–4 in mass. Hence, for similar Eddington ratios, the average luminosity of the disk-dominated galaxies is expected to be about 0.3–0.6 dex lower than that for the bulge-dominated galaxies in our sample. This is consistent with the 0.5 dex difference in the median (or 0.3 dex for the mean) luminosities of the normalised distributions.
5 Obscuration
We can look at the fraction of obscured AGN using the Seyfert classifications given in the Swift BAT catalogue. Before doing so, it is important to decide what counts as an obscured AGN, whether this is only type Seyfert 2, or if Seyfert 1.8–1.9 should be included, or even Seyfert 1.5? Burtscher et al. (2015) argue that Seyfert 2 types are obscured by at least mag, and Seyfert 1i 11 1 Seyfert 1i have broad lines detected at near-infrared wavelengths but not in optical spectra. Without the near-infrared spectra they would be classified as Sy 2. But the presence of a broad line in the near-infrared indicates the obscuration is not extreme. have mag. By deriving extinction directly from the broad lines themselves, Schnorr-Müller et al. (2016) find that Seyfert 1.8–1.9 types are obscured by -8 mag, and that even Seyfert 1.5 may have mag. These results apply to the luminosity range of the AGN analysed by Schnorr-Müller et al. (2016), which is rather narrow with a standard deviation of 0.4 dex around the median of erg s. In a more general context across the full range of AGN luminosities Stern & Laor (2012) argue that much of the variation in Seyfert sub-type classification must be due to differences in the covering factor of the narrow line region, and Elitzur et al. (2014) suggest that the classification follows an evolutionary sequence. However, the AGN in our sample also lie in a rather restricted range of moderate luminosities, and so we take the Seyfert sub-type classification as indicative of obscuration.
Several studies have looked at the question of whether dusty filaments and dust lanes along the line of sight to an AGN – i.e. non-nuclear obscuration – can play a role in the classification. In particular, Prieto et al. (2014) showed that such phenomena can cause -6 mag of extinction, potentially changing the AGN optical classification. By invoking the presence of gas in the galaxy’s local environment, this concept goes in the same direction as Koulouridis et al. (2006), and also earlier work by Dultzin-Hacyan et al. (1999), who argue for an evolutionary scenario between Seyfert and starburst, based on the higher fraction of Seyfert 2 than Seyfert 1 galaxies with a close neighbour (they note also that there is little difference in large scale environment). There have been a number of other studies suggesting that the local environment of Seyfert 2s is overdense compared to that of Seyfert 1s (Strand, Brunner, & Myers, 2008; Jiang et al., 2016; Gordon et al., 2016). However, these studies reach different conclusions about the scale on which the overdensity of Seyfert 2s is seen, ranging from Mpc to tens of kpc. A more dense environment is expected to lead to more interactions and hence impact also the host galaxies, and there is some evidence for this too (Hunt & Malkan, 2004; Villaroel & Korn, 2014). And from detailed integral field spectroscopy of molecular gas combined with dust structure maps, Davies et al. (2014) argue that gas and dust in the central regions of some galaxies can appear chaotic as a result of the galaxy’s local environment. Below we argue that the excess of close neighbours among Seyfert 2s may play a more important role for AGN in S0 hosts than in spiral hosts.
| host | unobscured | obscured1 | other2 |
|---|---|---|---|
| galaxy | Sy 1–1.5 | Sy 1.8–2 | |
| S0 | % (%) | % (%) | % |
| spiral | % (%) | % (%) | % |
1 We use Sy 1.8 as the threshold to define obscured AGN.
2 ‘Other’ refers to all classifications that are not a single Seyfert type (e.g. multiple types, ULIRG, etc).
Numbers in brackets refer to obscured and unobscured fractions of AGN when ‘other’ classifications are excluded.
| host | unabsorbed | absorbed |
|---|---|---|
| galaxy | N() cm-2 | N() cm-2 |
| S0 | % (%) | % (%) |
| spiral | % (%) | % (%) |
We have used threshold column of N and N to indicate an absorbed AGN, since these correspond to optical classifications of Sy 2and Sy 1.8 respectively for defining optically obscured AGN (see Burtscher et al. 2016 and Schnorr-Müller et al. 2016).
Bearing in mind that moderate obscuration corresponding to only -6 mag is sufficient to change the optical classification, for the purposes of this study, we consider Seyfert 1–1.5 as unobscured and Seyfert 1.8–2 to be obscured. Table 2 reports the fractions of obscured and unobscured Seyferts in spiral and S0 hosts. Since some fraction of the AGN have unclear or multiple classifications (here referred to as ‘other’), we also show in parentheses the fraction of obscured and unobscured Seyferts excluding those.
An independent assessment of the same physical phenomenon can be found by looking at the fractions of X-ray absorbed and unabsorbed AGN in the different hosts. We have used absorbing columns derived through a consistent analysis of the 0.3–150 keV band by Ricci et al. (in prep.) and Ricci et al. (2015), who provide the details for the modelling of the X-ray spectra. In our analysis we have excluded Blazars since the NH measured in these objects may be affected by the extended X-ray emission from the jet. We have used two threshold column densities of 1022.3 cm-2 and 1021.5 cm-2 to define absorbed AGN, since these correspond approximately to thresholds of Sy 2 and Sy 1.8 in definitions of optical obscuration (Burtscher et al., 2016; Schnorr-Müller et al., 2016). The absorbed and unabsorbed fractions are shown in Table 3.
Both optical obscuration and X-ray absorption show the same general trend. For the luminosity range considered here, AGN in disk galaxies are consistent with an equal split between unobscured and obscured or equivalently unabsorbed and absorbed. However the fraction of obscured or absorbed AGN in S0 galaxies appears to be higher at about a 2 level of significance.
If AGN in S0 hosts are fuelled by externally accreted gas, then that gas could provide a source of obscuration towards the nucleus, that is additional to the gas internal to the galaxy on small scales. Since much of the nuclear obscuration is expected to occur on small scales, on might expect that the additional obscuration on large scales should make only a minor difference to the obscured fraction. However, this is a marginal result and so we consider it as indicative rather than robust.
6 Conclusions
We have presented an analysis of the environment, host type, and luminosity distribution for about 200 AGN selected from the Swift BAT hard X-ray survey according to erg s and . To do so, we have used two independent group catalogues which are based on similar galaxy surveys but with the groups defined in different ways. The main conclusions are:
- •
Our data support the emerging consensus that the typical halo mass of local X-ray selected AGN is of order M⊙, corresponding to a typical group size of not more than a few galaxies. However, we also caution that this is most likely a consequence of the fact that most galaxies (at the sensitivity of current all-sky galaxy catalogues) are in such haloes.
- •
Most hard X-ray selected AGN are in spiral galaxies, and these show no evidence for an environmental dependence (although our data do not rule out a dependence). We argue that this is because the galaxies have their own internal gas supply which is sufficient to fuel an AGN.
- •
The fraction of S0 hosts with an AGN decreases in large groups and clusters (in contrast to the fraction of S0 galaxies itself, which, as expected for the well established morphology density relation, increases in denser environments). We argue that this is because AGN in S0 hosts are fuelled by gas from the environment that falls into the galaxy. While this is possible in small groups, gas in an intra-cluster medium is ionised and so cannot be accreted onto the galaxy efficiently.
- •
There is a difference in the luminosity functions of AGN in bulge-dominated and disk-dominated galaxies, with the latter having significantly more lower luminosity AGN. This can be understood in the context of their relative bulge sizes and the relation.
- •
There is some evidence that the fraction of obscured AGN is higher in S0 galaxies than spirals. If confirmed, this could be due to the importance of external accretion for fuelling AGN in S0 hosts, which implies the presence of gas and dust in the group environment around the galaxy that could lead to additional obscuration.
Acknowledgements
RD thanks all those at the Hidden Monsters conference who provided useful feedback that has been included in this paper. R.A.R. acknowledges support from FAPERGS (project No. 2366-2551/14-0) and CNPq (project No. 470090/2013-8 and 302683/2013).
References
- Arnold et al. (2009) Arnold T., Martini P., Mulchaey J., Berti A., Jeltema T., 2009, ApJ, 707, 1691
- Baumgartner et al. (2013) Baumgartner W., Tueller J., Markwardt C., Skinner G., Barthelmy S., Mushotzky R., Evans P., Gehrels N., 2013 ApJS, 207, 19
- Burtscher et al. (2015) Burtscher L., Orban de Xivry G., Davies R., Janssen A., Lutz D., 2015, A&A, 578, A47
- Burtscher et al. (2016) Burtscher L., Davies R., Graciá-Carpio J., Koss M., Lin M.-Y., 2016, A&A, 586, A28
- Cappellari et al. (2011) Cappellari M., Emsellem E., Krajnović D., McDermid R., Serra P., et al., 2011, MNRAS, 416, 1680
- Davies et al. (2014) Davies R., Maciejewski W., Hicks E., Emsellem E., Erwin P., et al., 2014 ApJ, 792, 101
- Davies et al. (2015) Davies R., Burtscher L., Rosario D., Storchi-Bergmann T., Contursi A., 2015, ApJ, 806, 127
- Davis et al. (2011) Davis T., Alatalo K., Sarzi M., Bureau M., Young L., et al., 2011, MNRAS, 417, 882
- Davis & Bureau (2016) Davis T., Bureau M., 2016, MNRAS, 457, 272
- de Souza et al. (2016) de Souza R., Dantas M., Krone-Martins A., Cameron E., Coelho P., et al., 2016, MNRAS, 461, 2115
- de Vaucouleurs et al. (1991) de Vaucouleurs G., de Vaucouleurs A., Corwin H., et al., 1991, Third Reference Catalogue of Bright Galaxies (Berlin: Springer)
- DiPompeo et al. (2014) DiPompeo M., Myers A., Hickox R., Geach J., Hainline K., 2014, MNRAS, 442, 3443
- Dressler (1980) Dressler A., 1980, ApJ, 236, 351
- Dultzin-Hacyan et al. (1999) Dultzin-Hacyan D., Krongold Y., Fuentes-Guridi I., Marziani P., 1999, ApJ, 513, L111
- Dumas et al. (2007) Dumas G., Mundell C., Emsellem E., Nagar N., 2007, MNRAS, 379, 1249
- Elitzur et al. (2014) Elitzur M., Ho L., Trump J., 2014, MNRAS, 438, 3340
- Fanidakis et al. (2013) Fanidakis N., Georgakakis A., Mountrichas G., Krumpe M., Baugh C., et al., 2013, MNRAS, 435, 679
- Gabor et al. (2009) Gabor J., Impey C., Jahnke K., Simmons B., Trump J., et al., 2009, ApJ, 691, 705
- Georgakakis et al. (2014) Georgakakis A., Mountrichas G., Salvato M., Rosario D., Pérez-González P., 2014, MNRAS, 443, 3327
- Gilli et al. (2009) Gilli R., Zamorani G., Miyaji T., Silverman J., Brusa M., et al., 2009, A&A, 494, 33
- Gordon et al. (2016) Gordon Y., Owers M., Pimbblet K., Croom S., Alpaslan M., et al., 2016, MNRAS, 2016, in press
- Goto et al. (2003) Goto T., Tamauchi C., Fujita Y., Okamura S., Sekiguchi M., Smail I., Bernardi M., Gomez P., 2003, MNRAS, 346, 601
- Hicks et al. (2013) Hicks E., Davies R., Maciejewski W., Emsellem E., Malkan M., Dumas G., Müller-Sánchez F., Rivers A., 2013, ApJ, 768, 107
- Häring & Rix (2004) Häring N., Rix H.-W., 2004, ApJ, 604, L89
- Huchra et al. (2012) Huchra J., Macri L., Masters K., Jarrett T., Berlind P., et al., 2012, ApJS, 199, 26
- Jiang et al. (2016) Jiang N., Wang H., Mo H., Dong X.-B., Wang T., Zhou H., 2016, ApJ, 832, 111
- Koulouridis et al. (2006) Koulouridis E., Plionis M., Chavushyan V., Dultzin-Hacyan D., Krongold Y., Goudis C., 2006, ApJ, 639, 37
- Heckman & Best (2014) Heckman T., Best P., 2014, ARA&A, 52, 589
- Hickox et al. (2014) Hickox R., Mullaney J., Alexander D., Chen C.-T., Civano F., et al., 2014 ApJ, 782, 9
- Ho (2008) Ho L., 2008, ARA&A, 46, 475
- Hunt & Malkan (2004) Hunt L., Malkan M., 2004, ApJ, 616, 707
- Koss et al. (2010) Koss M., Mushotzky R., Veilleux S., Winter L., 2010 ApJL, 716, L125
- Koss et al. (2011) Koss M., Mushotzky R., Veilleux S., et al., 2011 ApJ, 739, 57
- Laurikainen et al. (2010) Laurikainen E., Salo H., Buta R., Knapen J., Comerón S., 2010, MNRAS, 405, 1089
- Li et al. (2006) Li C., Kauffmann G., Wang L., White S., Heckman T., Jing Y., 2006, MNRAS, 373, 457
- Marconi & Hunt (2003) Marconi A., Hunt L., 2003, ApJ, 589, L21
- Martini et al. (2013) Martini P., Miller E., Brodwin M., Stanford S., Gonzalez A., 2013, ApJ, 768, 1
- Moster et al. (2010) Moster B., Somerville R., Maulbetsch F., van den Bosch F., Macció A., Naab T., Oser L., 2010 ApJ, 710, 903
- Müller-Sánchez et al. (2013) Müller-Sánchez F., Prieto M.A., Mezcua M., Davies R., Malkan M., Elitzur M., 2013, ApJ, 763, L1
- Paturel et al. (2003) Paturel G., Petit C., Prugniel P., Theureau G., Rousseau J., Brouty M., Dubois P., Cambresy L., 2003, A&A, 412, 45
- Postman et al. (2005) Postman M., Franx M., Cross N., Holden B., Ford H., et al., 2005, ApJ, 623, 721
- Prieto et al. (2014) Prieto M.A., Mezcua M., Fernández-Ontiveros J., Schartmann M., 2014, MNRAS, 442, 2145
- Ricci et al. (2015) Ricci C., Ueda Y., Koss M., Trakhtenbrot B., Bauer F., Gandhi P., 2015 ApJ, 815, L13
- Sabater et al. (2013) Sabater J., Best P., Argudo-Fernández M., 2013, MNRAS, 430, 638
- Sabater et al. (2015) Sabater J., Best P., Heckman T., 2015, MNRAS, 447, 110
- Sarzi et al. (2006) Sarzi M., Falcón-Barroso J., Davies R., Bacon R., Bureau M., et al., 2006, MNRAS, 366, 1151
- Schade, Boyle, & Letwasky (2000) Schade D., Boyle B., Letawsky M., 2000 MNRAS, 315, 498
- Schnorr-Müller et al. (2016) Schnorr-Müller A., Davies R., Korista K., Burtscher L., Rosario D., et al., 2016, MNRAS, 462, 3570
- Serber et al. (2006) Serber W., Bahcall N., Ménard B., Richards G., 2006, ApJ, 643, 68
- Smith et al. (2005) Smith G., Treu T., Ellis R., Moran S., Dressler A., 2005, ApJ, 620, 78
- Stern & Laor (2012) Stern J., Laor A., 2012, MNRAS, 426, 2703
- Strand, Brunner, & Myers (2008) Strand N., Brunner R., Myers A., 2008, ApJ, 688, 180
- Tempel et al. (2016) Tempel E., Kipper R., Tamm A., Gramann M., Einsato M., Sepp T., Tuvikene T., 2016, A&A, 588, 14
- Tully (2015a) Tully R.B., 2015, AJ, 149, 171
- Tully (2015b) Tully R.B., 2015, In Scale-Free Processes in the Universe, invited talk given at IAU General Assembly XXIX, Focus Meeting 18; arXiv 1508.05934
- Villaroel & Korn (2014) Villarroel B., Korn A., 2014, Nature Physics, 10, 417
- Weinzirl et al. (2009) Weinzirl T., Jogee S., Khochfar S., Burkert A., Kormendy J., ApJ, 696, 411
- Westoby et al. (2012) Westoby P., Mundell C., Nagar N., Maciejewski W., Emsellem E., Roth M., Gerssen J., Baldry I., 2012, ApJS, 199, 1
- Wilman & Erwin (2012) Wilman D., Erwin P., 2012, ApJ, 746, 160
- Winter et al. (2012) Winter L., Veilleux S., McKernan B., Kallman T., 2012, ApJ, 745, 107
- Yang et al. (2005) Yang X., Mo H., Jing Y., van den Bosch F., et al., 2005, MNRAS, 358, 217
- Yang et al. (2007) Yang X., Mo H., van den Bosch F., et al., 2007, ApJ, 671, 153