Origin of Kinks in Energy Dispersion of Strongly Correlated Matter
Abstract
We investigate the origin of ubiquitous low energy kinks found in Angle Resolved Photoemission (ARPES) experiments in a variety of correlated matter. Such kinks are unexpected from weakly interacting electrons and hence identifying their origin should lead to fundamental insights in strongly correlated matter. We devise a protocol for extracting the kink momentum and energy from the experimental data which relies solely on the two asymptotic tangents of each dispersion curve, away from the feature itself. It is thereby insensitive to the different shapes of the kinks as seen in experiments. The body of available data is then analyzed using this method. We proceed to discuss two alternate theoretical explanations of the origin of the kinks. Some theoretical proposals invoke local Bosonic excitations (Einstein phonons or other modes with spin or charge character), located exactly at the energy of observed kinks, leading to a momentum independent self energy of the electrons. A recent alternate is the theory of extremely correlated Fermi liquids (ECFL). This theory predicts kinks in the dispersion arising from a momentum dependent self energy of correlated electrons. We present the essential results from both classes of theories, and identify experimental features that can help distinguish between the two mechanisms. The ECFL theory is found to be consistent with currently available data on kinks in the nodal direction of cuprate superconductors, but conclusive tests require higher resolution energy distribution curve data.
I Introduction
High precision measurements of electronic spectral dispersions has been possible in recent years, thanks to the impressive enhancement of the experimental resolution in the angle resolved photoemission spectroscopy (ARPES). This technique measures the single electron spectral function multiplied by the Fermi occupation function; it can be scanned at either fixed as a function of or at fixed as a function of . These scans produce respectively the energy distribution curves (EDCs) and momentum distribution curves (MDCs). The line shapes in both these scans are of fundamental interest, since they provide a direct picture of the quasiparticle and background components of interacting Fermi systems, and thus unravel the roles of various interactions that are at play in strongly correlated Fermi systems. The dispersion relation of the electrons can be studied through the location of the peaks of in constant or constant scans.
Recent experimental studies have displayed a surprising ubiquity of kinks in the dispersion of strongly correlated matter at low energies meV. The kinks are bending type anomalies (see Fig. (1)) of the simple , i.e. linear energy versus momentum dispersion that is expected near from band theory. The special significance of kinks lies in the fact that their existence must signal a departure from band theory. This departure could be either due to electron-electron interactions, or to interaction of the electrons with other Bosonic degrees of freedom. Either of them are therefore significant enough to leave a direct and observable fingerprint in the spectrum. The goal of this work is to elucidate the origin of the observed kinks, and therefore to throw light on the dominant interactions that might presumably lead to high Tc superconductivity.
The purpose of this paper is multifold, we (i) survey the occurrence of the kinks in a variety of correlated systems of current interest, (ii) provide a robust protocol for characterizing the kinks which is insensitive to the detailed shape of the kink, (iii) discuss how these kinks arise in two classes of theories, one based on coupling to a Bosonic mode and the other to strong correlations, and (iv) identify testable predictions that ARPES experiments can use to distinguish between these.
The fifteen systems reporting kinks are listed in Table (1); these include (1) most high cuprates in the (nodal) direction at various levels of doping from insulating to normal metallic states in the phase diagram [1, 2] (2) charge density wave systems, (3) cobaltates and (4) ferromagnetic iron surfaces. The kinks lose their sharpness as temperature is raised [3, 2, 4], and appear to evolve smoothly between the d-wave superconducting state and the normal state.
| Name of the compounds | Local Bosonic Mode | ||||||
| Above Tc | Below Tc | ||||||
| MDC | EDC | MDC | EDC | Charge | Spin | Not reported | |
| LSCO | ✓[3, 13] | ✓[3, 1, 14, 13] | ✓[15] | ✓[16, 17, 18] | ✓[19] | ||
| Bi2201 | ✓[3, 13, 5, 20, 21] | ✓[22] | ✓[5, 21] | ✓[23] | |||
| Bi2212 | ✓[24, 2, 3, 4, 5, 13, 25] | ✓[4] | ✓[24, 2, 3, 4, 5, 13, 25] | ✓[26] | ✓[27, 28] | ||
| Bi2223 | ✓[5, 29] | ✓[5, 29, 30] | ✓ | ||||
| YBCO | ✓[31] | ✓[32, 33] | ✓[34, 35, 36, 37] | ||||
| Hg1201 | ✓[38] | ✓[39] | ✓[40, 41, 42] | ||||
| F0234 | ✓[43] | ✓ | |||||
| CCOC | ✓[44] | ✓ | |||||
| LSMO | ✓[45] | ✓[45] | ✓ | ||||
| 2H-TaSe2 (CDW) | ✓[46] | ✓[47] | |||||
| Iron (110) surface | ✓[48] 85 K | ✓ | |||||
| BiBaCo1 | ✓[49] 5K | ✓[49] 5K | ✓ | ||||
| BiBaCo2 | ✓[49] 5K | ✓[49] 5K | ✓ | ||||
| BiBaCo | ✓[49] 200K | ✓[49] 200K | ✓ | ||||
| NaCoO | ✓[49] 5K | ✓[49] 5K | ✓ | ||||
The kinks above are smoothed out as one moves away from nodal direction [5]. Recent experiments [6] resolve this movement of the kinks more finely into two sub features. Most of the studies in Table (1) focus on MDC kinks, the EDC kinks data is available for only eight systems so far. Bosonic modes have been reported in six systems using different probes such as inelastic x-rays or magnetic scattering, with either charge (phonons, plasmons) or spin (magnetic) character, while the remaining nine systems do not report such modes. A few theoretical studies of the kinks have implicated the observed low energy modes via electron-Boson type calculations; we summarize this calculation in the Supplementary Information (SI) [7]. We find, in agreement with earlier studies, that the Boson coupling mechanism yields kinks in the MDC dispersion, provided the electron-Boson coupling is taken to be sufficiently large. In addition, we find in all cases studied, this mechanism also predicts a jump in the EDC dispersion. It also predicts an extra peak in the spectral function pinned to the kink energy after the wave vector crosses the kink. These two features are experimentally testable and differ from the predictions of the correlations mechanism discussed next.
Since kinks are also observed in cases where no obvious Bosonic mode is visible, it is important to explore alternate mechanisms that give rise to such features. In this context we note that a recent theoretical work using the extremely strongly correlated Fermi liquid (ECFL) theory [8, 9] calculates the dispersion using a low momentum and frequency expansions of the constituent self energies. This calculation [9] shows that both EDC and MDC energy dispersions display qualitatively similar kinks, in particular there is no jump in either dispersion. In essence this work implies that a purely electronic mechanism with a strong momentum dependence of the Dyson self energy results in kink type anomalies. In terms of parameter counting, the calculation is overdetermined, it can be represented in terms of four parameters which can be fixed from a subset of measurements. With this determination one can then predict many other measurables and testable relations between these- as we show below. We show below that the various predictions are reasonably satisfied in one case (of OPT Bi2212 below), while in other cases, there is insufficient experimental data to test the theories.
The ECFL theory incorporates strong Gutzwiller type correlation effects into the electron dynamics [7]. It produces line shapes that are in close correspondence to experimental results for the high systems [11, 12]. The presence of a low energy kink in the theoretical dispersion was already noted in Ref. (11), the present work substantially elaborates this observation. In order to understand the origin of a low energy scale in the ECFL theory, it is useful to recall the predicted cubic correction to Fermi liquid self energy from equations (SI-42, 8,9). Here is an emergent low energy scale, it is related to the correlation induced reduction of the quasiparticle weight . It reveals itself most clearly in the observed particle hole asymmetry of the spectral functions, and therefore can be estimated independently from spectral lineshape analysis. A related and similar low value of the effective Fermi temperature is found in recent studies of the resistivity [10]. Here and in our earlier studies it is coincidentally found that meV, i.e. it is also roughly the energy scale of the kinks when the bandwidth is a few eV.
II ARPES spectral dispersions, kinks and a protocol for data analysis
II.1 Summary of variables in the theory
A few common features of spectral dispersions found in experiments are summarized in Fig. (1). The schematic figure shows a region of low spectral velocity near the Fermi level followed by a region of steeper velocity, these are separated by a bend in the dispersion- namely the kink. While the kink itself has a somewhat variable shape in different experiments, the “far zone” is much better defined and is usually independent of the temperature, we denote the velocities in the far zones for the MDC dispersion and the EDC dispersion counterparts by . In terms of the normal component of the momentum measured from the Fermi surface
| (1) |
the kink momentum is uniquely defined by extrapolating the two asymptotic tangents, and the binding energy at this momentum defines the ideal kink energy (see equation (7)), which serves as a useful reference energy.
Our picture is that all lines of temperature varying MDC dispersion curves in near zone converges into one line in the far zone in Fig. (1). We find that both the low and high velocities are independent of the temperature while depending on the doping levels. Lastly, the new laser ARPES data reveals that we need low temperature dispersion data to determine because temperature effect strongly influences the spectrum near the Fermi level.
We first define the important ratio parameter () from the MDC dispersion velocities as
| (2) |
The EDC dispersion relation locates the maximum of the spectral function in at constant , while the MDC dispersion and locates the maximum at a fixed energy . These are found from the ECFL theory (see SI [7] and Ref. (9)) as:
| (3) | |||||
| (4) |
where we introduced an energy parameter related to and
| (5) |
and a momentum type variable . The variable is temperature like,
| (6) |
here is an elastic scattering parameter dependent upon the incident photon energy, it is very small for laser ARPES experiments and can be neglected to a first approximation. Here is a self energy decay constant explained further in the SI [7]. The ideal kink energy can be expressed in terms of scale as:
| (7) |
It is important to note that these dispersion relations equations (3,4) are different from the standard dispersion relations , which follow in the simplest Fermi Liquid Theory (FLT) near the Fermi energy . The FLT dispersions are identical in EDCs and MDCs, and are independent of the temperature-like variable , and do not show kinks. On the other hand equations (3,4) do have kinks- as we show below, and the temperature-like variable plays a significant role in the dispersion. At one has an ideal spectrum, where the kinks are sharpest. When , due to either finite temperature or finite damping , related to the energy of the incoming photon, the kinks are rounded.
A few consequences of equations (3,4) can be noted for the purpose of an experimental determination of the Fermi momentum. The chemical potential is usually fixed by referencing an external metallic contact and is unambiguous. Experimentally the Fermi momentum is usually found from the MDC, as the momentum where the spectral function is maximum with energy fixed at the chemical potential, i.e. . This corresponds to the generally wrong expectation, that implies . When , from equation (4) we see that the condition gives a positive number that equals zero only in the ideal case . Thus there is an apparent enlargement of the Fermi surface due to a finite that needs to be corrected. By the same token, at the true (Luttinger theorem related) Fermi momentum , the MDC energy , a negative number when . In recent laser ARPES Bi2201 data Ref. (21) (panel (a) in Fig. (4)), we see that vanishes at increasing as T is raised, as predicted in our calculation. Recent laser ARPES experiment on OPT Bi2212 compounds reports a similar temperature dependence of momentum of MDC dispersion at the Fermi level in Ref. (25), strongly supporting our picture of its origin.
Similarly, the EDC peak at the true Luttinger theorem related Fermi surface is non-zero. We find . Clearly is negative unless , i.e. it is generically red-shifted. If we are tempted to identify the Fermi momentum from the condition , a similar cautionary remark is needed. The condition gives again a positive number as in the MDC case, and thus a slightly different enlargement of the apparent Fermi surface.
The above comments illustrate the difficulty of finding the correct Fermi surface when is non-negligible, as in the case of synchrotron ARPES with substantial values meV. On the other hand the laser ARPES studies have a much smaller meV, where our analysis can be tested by varying the temperature and the consequent change of the spectrum. In the following, we analyse the data from the Bi2201 system where the laser data is available at various T, and allows us to test the above in detail. Our analysis below of two other synchrotron data, the OPT Bi2212 has meV, while the low T LSCO data is assumed to be in the limit of because of the lack of high temperature dispersion data.

The spectral function at low frequencies close to is also obtainable from these parameters, the relevant formula is noted below. In terms of
| (8) |
the spectral function is:
| (9) |
Here is the quasiparticle weight and (see SI [7]). We should keep in mind that these expressions follow from a low energy expansion, and is limited to small and ; in practical terms the dimensionless variable , so that (or ) is bounded by the kink energy (or momentum), as defined below.
III OPT Bi2212 ARPES dispersion data
In the well studied case of optimally doped Bi2212 (BSCCO) superconductors, the kink has been observed in both EDC and MDC.
We summarize the ECFL fit parameters in Table (2) obtained from literature [4]. We also display the predicted energy and high velocity of the EDC dispersion. The velocity ratio in this case, is quite large and measurable. In this case the EDC dispersion has fortunately already been measured, allowing us to test the prediction. From Table (2) we see that the energy of the EDC kink and its velocity are close to the predictions.
| MDCs | EDCs | |||||||
|---|---|---|---|---|---|---|---|---|
| OPT Bi2212 ARPES data | (meV) | (meV) | (eV ) | |||||
| (eV ) | (eV ) | () | Calculated | Measured | Calculated | Measured | Predicted | Measured |
| 1.47 0.07 | 3.3 0.3 | - 0.037 0.005 | 67 21 | 67 8 | 63 21 | 65 8 | 2.60 0.56 | 2.1 1.1 |
In Panel (a) in Fig. 2, we plot the predicted EDC dispersion using the parameters extracted from the MDC dispersion in Panel (b), and compare with the ARPES data measured[4]. It is interesting that the predicted slope of the EDC dispersion from is close to the measured one. Indeed the measured EDC dispersion is close to that expected from the ECFL theory. To probe further, in Panel (c) in Fig. (2) we compare the theoretical EDC line shape (solid blue line) given by the same parameters through equation (9), with the ARPES line shape measured at high temperature [4]. Panel (d) compares the theoretical MDC curve with the data. The theoretical curves are from the low energy expansion and hence are chopped at the high end, corresponding to roughly for MDC and for the EDC. With this cutoff, the momentum is less than the kink momentum and the energy is less than the kink energy. We used = 40 meV since it provides a rough fit for both EDC and MDC spectral functions.

This value is somewhat larger than the bound meV given in Table (2), a smaller value leads to narrower lines but with the same shape. In rigorous terms the same must fit the dispersion and also the spectral functions. Our fit, requiring a different , is not ideal in that sense. However the resolution of the available data is somewhat rough, and should improve with the newer experimental setups that have become available. We thus expect that higher resolution data with laser ARPES should provide an interesting challenge to this theory. We also stress that from equation (9), the MDC line shapes look more symmetric than the EDC line shapes at low energies. While many experimental results do show rather symmetric MDCs, there are well known exceptions. For instance MDCs asymmetry has indeed been reported for nearly optimally doped Hg1201 ( Tc = 95 K ) at binding energy very close to the Fermi level, - 5 meV and -18 meV in Fig. 5 in Ref. (38). Note that the MDC plot of the spectral function from equation (9), locates the peak momentum , i.e. slightly to the right of the physical Fermi momentum , and we consider this implies that the experimental Fermi momentum determination is subject to such a correction, whenever the spectral function equation (9) has a momentum dependent caparison factor (see caption in Fig. (2)).
IV LSCO low temperature data
Here we analyze the LSCO data at low temperature (20 K) and at various doping levels raging from the insulator (x = 0.03) to normal metal (x = 0.3) from Ref. (1). The parameters are listed in Table (3), where we observe that the velocity is roughly independent of , and has a somewhat larger magnitude to that in OPT Bi2212 in Table (2). The kink momentum decreases with decreasing x, roughly as , and the kink energies of EDC and MDC dispersions are essentially identical. In the region beyond the kink, the prediction for is interesting since it differs measurably from the MDC velocity . We find the ratio is quite spread out at different doping.
| MDCs | EDCs | ||||||||
|---|---|---|---|---|---|---|---|---|---|
| LSCO low temperature ARPES data | (meV) | (meV) | (eV ) | ||||||
| x ( doping level ) | (eV ) | (eV ) | () | Calculated | Measured | Calculated | Measured | Calculated | Measured |
| 0.3 | 2.4 0.2 | 3.0 0.3 | - 0.047 0.005 | 113 29 | 110 10 | 113 29 | 2.93 0.45 | ||
| 0.22 | 2.0 0.1 | 3.6 0.2 | - 0.042 0.005 | 84 18 | 85 10 | 84 18 | 3.14 0.35 | ||
| 0.18 | 1.7 0.3 | 4.5 0.6 | - 0.040 0.005 | 68 43 | 72 10 | 68 43 | 3.2 1.2 | ||
| 0.15 | 1.75 0.07 | 4.3 0.1 | - 0.037 0.005 | 65 11 | 64 10 | 65 11 | 3.23 0.20 | ||
| 0.12 | 2.0 0.3 | 3.7 0.5 | - 0.029 0.005 | 58 28 | 55 10 | 58 28 | 3.19 0.89 | ||
| 0.1 | 1.8 0.2 | 5.0 0.7 | - 0.035 0.005 | 63 44 | 64 10 | 63 44 | 3.5 1.4 | ||
| 0.075 | 1.9 0.2 | 5.6 0.8 | - 0.026 0.005 | 49 37 | 51 10 | 49 37 | 3.8 1.7 | ||
| 0.063 | 1.8 0.3 | 6.0 0.5 | - 0.022 0.005 | 40 21 | 43 10 | 40 21 | 3.7 1.1 | ||
| 0.05 | 1.7 0.2 | 5.7 0.6 | - 0.023 0.005 | 39 25 | 41 10 | 39 25 | 3.5 1.3 | ||
| 0.03 | 2.0 0.3 | 6.1 0.4 | - 0.016 0.005 | 32 15 | 32 10 | 32 15 | 4.02 0.85 | ||
Our analysis becomes unreliable as lower doping level in Panels (h) to (j) in Fig. 3, where the dispersion kink is no longer a simple bending kink, an extra curving tendency begins to appear. To put this in context, recall that the line shape of LSCO becomes extremely broad at small x [14], and so the peak position of the spectral function becomes more uncertain than at higher energy.
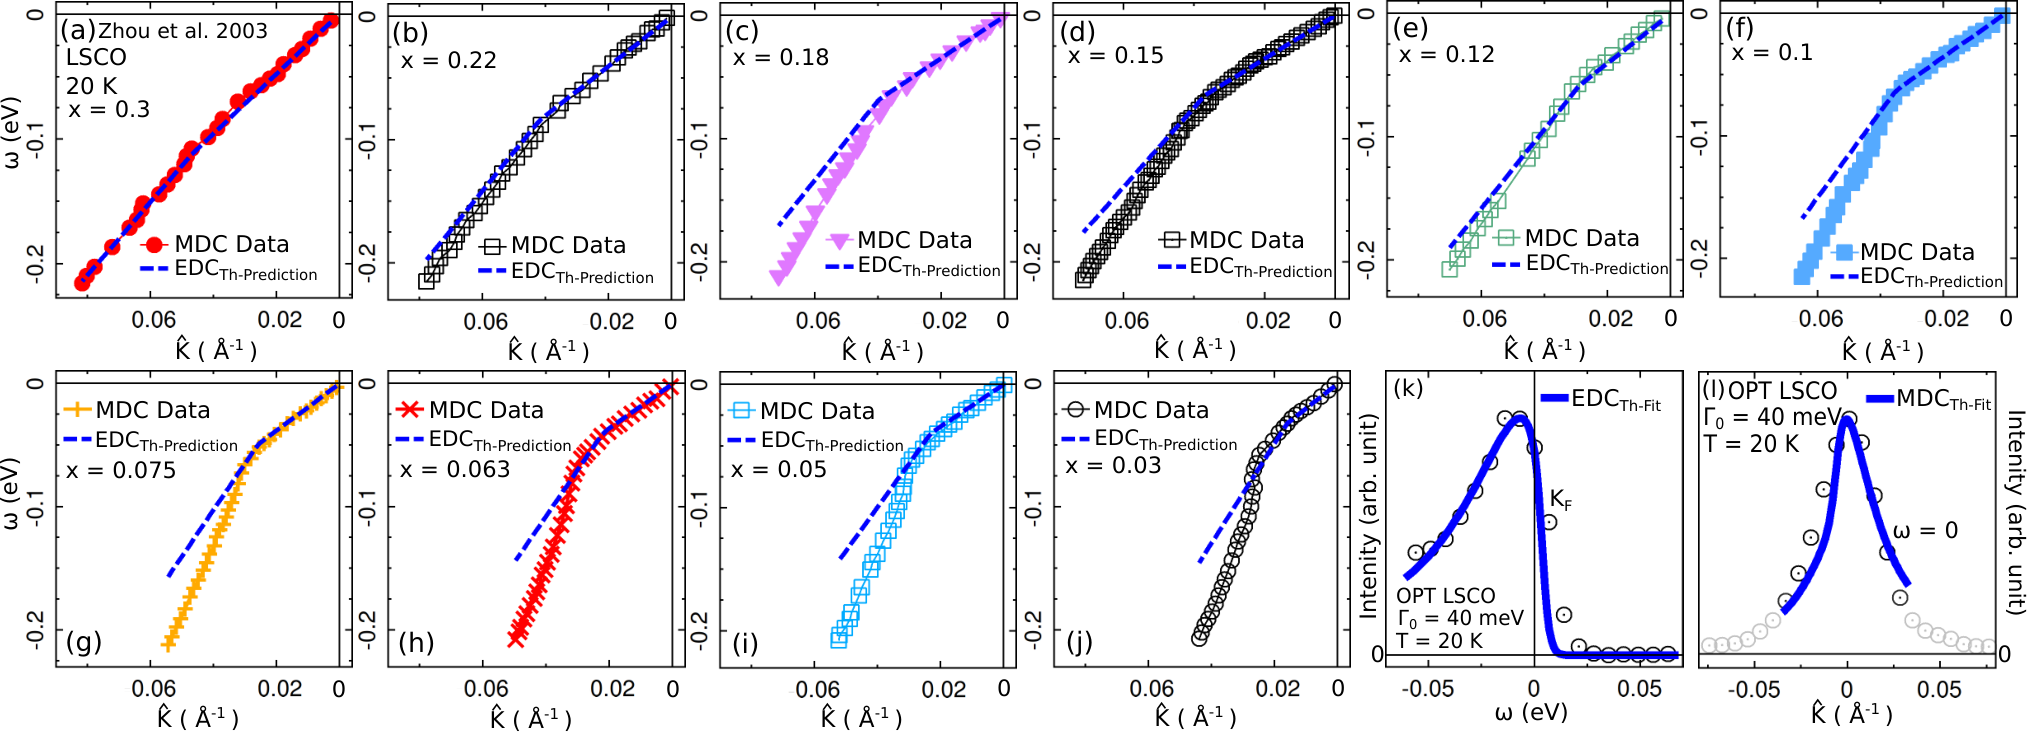
We should point out that in Fig. (3) Panel (k) the spectral function has been shifted to right by 4 meV for a better fit. This shifting is consistent with our argument that the Fermi momentum determination has a possible small error of in order 0.006 , arising from the dependent caparison factor, and hence the peak position has an uncertainty meV.
V Bi2201 Laser ARPES data
In this section, we present our analysis of the high resolution laser ARPES data of the single layered compounds Bi2201, at various different doping levels taken from a recent study in Ref. (21). In earlier studies of this compound using synchrotron emitted high energy photons, as also LSCO [3], the ARPES kinks were observed to have only a weak temperature dependence [5]. However, the new high resolution laser ARPES data enables us to observe clear and significant temperature dependence of the ARPES kinks; it is comparable to that of the double layered Bi2212 compounds. In fact we find that the new data of Bi2201 compounds in Ref. (21) seems to provide a textbook example of our ECFL kink analysis.
In Table(4) we list the kink parameters corresponding to different doping levels of Bi2201 and tabulate the kink parameters. The entries are in correspondence to the panels in Fig. (4). In Fig. (4) panels (a) to (f), we depict the measured MDC dispersion and the predicted EDC dispersions at different doping levels. The latter are found from equation (3) using the variables in Table (4). Panels (g) and (h) of OPT Bi2201 are especially interesting. Combining the low K dispersion data and the finite T value of , found from the depression of the kink energy , we can reconstruct the entire MDC dispersion at a finite T. This may be compared with the measured finite T MDC data, thus checking the validity of the formalism. This exercise is carried out at T=200K in Panel (g) and T=100 K in panel (h), where we find a remarkably good fit in all details. In panels (g,h) we show the actual momentum (rather than ) to facilitate a comparison with data. Panel (g) especially clearly shows that vanishes at a that is different from 0. The shift corresponds to . We have commented above that this apparent expansion of the Fermi surface with T is due to the non trivial physics underlying equation (4) lying beyond the simple minded FLT.
Panel (i) in Fig. (4) plots the temperature dependence of in panel (a) in Fig.(4) in Ref. (21). The measured curve is fitted with equation (6), and we estimate meV and meV.
| MDCs | EDCs | ||||||||
| Bi2201 laser ARPES data | (meV) | (meV) | (eV ) | ||||||
| x ( doping level ) | (eV ) | (eV ) | () | Calculated | Measured | Calculated | Measured | Calculated | Measured |
| 0.1 | 1.47 0.12 | 4.7 0.3 | - 0.022 0.002 | 32 3 | 37 0.5 | 32 6 | 3.0 0.3 | ||
| 0.11 | 1.34 0.06 | 2.78 0.06 | - 0.021 0.002 | 28 1 | 28 0.5 | 28 4 | 2.28 0.12 | ||
| 0.13 | 1.37 0.07 | 2.71 0.18 | - 0.025 0.002 | 38 3 | 39 0.5 | 37 5 | 2.27 0.17 | ||
| 0.16 | 1.5 0.1 | 3.5 0.2 | - 0.026 0.002 | 39 3 | 43 0.5 | 39 6 | 2.7 0.2 | ||
| 0.23 | 2.1 0.11 | 5.4 0.3 | - 0.036 0.002 | 98 6 | 97 0.5 | 89 10 | 3.9 0.3 | ||
| 0.26 | 2.17 0.16 | 4.8 0.4 | - 0.045 0.002 | 123 11 | 122 0.5 | 114 18 | 3.8 0.4 | ||
| 0.16 ( 200 K ) | 1.61 0.18 | 3.5 0.3 | 0.364 0.002 | 87 11 | 89 0.5 | 75 11 | 2.8 0.4 | ||
| 0.16 ( 100 K ) | 1.61 0.18 | 3.5 0.3 | 0.364 0.002 | 69 11 | 70 0.5 | 62 11 | 2.8 0.4 | ||

VI conclusion
The main goal of this work is to understand the physical origin of kinks in the dispersion seen in ARPES studies of a wide class of systems. For this purpose we have listed fifteen systems of topical interest where ARPES kink data is available. Our focus is on the nodal direction data, since the largest volume is available here. We have devised a useful protocol to extract kink parameters from data, where the asymptotic tangents of the kink are used. Using this protocol we have analyzed in detail three families of systems, two synchrotron and one laser ARPES data of cuprate superconductors. The main parameters of the kinks are the energy, momentum and the dispersion velocities in EDC and MDC scans, these provide a quantitative data set for testing various theoretical proposals for explaining kinks.
We have outlined two competing theories for the origin of kinks, and highlighted their distinctive predictions. One is the electron-Boson model, where an Einstein mode of either spin or charge origin couples to the electrons, resulting in a momentum independent self energy. This theory gives rise to kinks in the electron dispersion. The other theory is the strong or extreme correlation theory, where the interactions lead to a momentum dependent self energy in two dimensions. This theory also gives rise to kinks in the electron dispersion.
The predictions of the two theories differ significantly and in experimentally testable ways. The Boson-mode theory gives rise to kinks located at the energy of the localized mode. For the kinks, the Boson-mode theory predicts [7]: (1) a momentum independent peak in the spectral function at the kink energy when , (2) a jump in the EDC dispersion at the kink energy but not the MDC dispersion and (3) the EDC and MDC velocities are identical both before and after the kink is crossed.
The extremely strong correlation theory also gives rise to kinks in dispersion, these originate from the momentum dependence of the self energy [7]. A simple low energy and momentum expansion of the ECFL theory gives inter-relations between observed features of the kinks. It predicts (1) a kink at an emergent low energy scale originating from Gutzwiller correlations (2) no jump in the EDC dispersion and (3) the EDC velocity is determined by the MDC velocities through . It is remarkable that a knowledge of the MDC dispersion suffices to predict the EDC dispersion, and the parameters obtained from the MDC dispersion enable us to reconstruct the spectral function at low momentum and energy, in both MDC and EDC scans.
It is thus clear that EDC dispersions hold the key to distinguishing between the two competing theories. EDC dispersion data is sparse but exists, the work on OPT Bi2212 from Ref. (4) shown in Fig. (2), presents both EDC and MDC dispersions at 115 K. Its resolution is presumably not optimal, since it was an early experiment. Nevertheless we can use it to make a first pass at comparing the two theories. This data set plotted in Fig. (2) shows that the EDC dispersion is continuous, i.e. has no jump. Further the EDC higher velocity is close to that predicted by the ECFL analysis. The measured spectral function in EDC, overlooking the noise, seem not to have any immovable feature at . Thus all three characteristics noted above appear to be consistent with the ECFL predictions rather than the Bosonic mode theory predictions. It is roughly fit by the low energy parameterized curves as well, where the MDC is seen to be more symmetric than the EDC cuts.
As noted in Table (1) the above case OPT Bi2212 is particularly interesting. Low energy Bosonic modes have been observed in neutron scattering [27, 28], and in momentum resolved electron energy loss experiments [26]. In Ref. (26) an MDC dispersion is presented using parameters taken from the Bosonic data. This leads to a rather detailed model, and is shown to provide a reasonable fit to the MDC dispersion and the observed kink, but the important EDC dispersion is not displayed.
While we focussed attention on dispersion kinks in the nodal direction in the present work, the ECFL theory is also valid for other directions, it has a momentum dependence in the self energy both normal to the Fermi surface and also along the tangent. The ECFL theory applied to the d-wave superconducting state in the - model is expected to lead to further interesting results in the future. For now we note that the observed nodal direction spectra are essentially unchanged at , which makes the nodal direction particularly interesting.
In conclusion, we have presented a current summary of the physics of the kinks in dispersion of cuprate high Tc superconductors. We believe that there is urgent need for further high resolution EDC data, and also T dependent scans to explore the rounding of kinks. Using such data one should be able to check the predictions of the theory more thoroughly, and thereby obtain definitive understanding of the origin of low energy ARPES kinks of strongly correlated matter.
VII Acknowledgements
We thank Antoine Georges and Jason Hancock for stimulating discussions. The work at UCSC was supported by the U.S. Department of Energy (DOE), Office of Science, Basic Energy Sciences (BES) under Award # DE-FG02-06ER46319.
References
- [1] Zhou, X-J., et al. High-temperature superconductors: universal nodal Fermi velocity. Nature 423.6938 (2003): 398-398.
- [2] Johnson, P. D., et al. Doping and temperature dependence of the mass enhancement observed in the cuprate Bi2 Sr2 CaCu2 . Physical Review Letters 87.17 (2001): 177007.
- [3] Lanzara, A., et al. Evidence for ubiquitous strong electronÐphonon coupling in high-temperature superconductors. Nature 412.6846 (2001): 510-514.
- [4] Kaminski, A., et al. Renormalization of spectral line shape and dispersion below Tc in Bi2 Sr2 CaCu2 . Physical Review Letters 86.6 (2001): 1070.
- [5] Sato, T., et al. Observation of band renormalization effects in hole-doped high-T c superconductors. Physical Review Letters 91.15 (2003): 157003.
- [6] He, J. et. al., Coexistence of Two Sharp-Mode Couplings and their Unusual Momentum Dependence in the Superconducting State of Bi2 Sr2 CaCu2 Revealed by Laser-Based Angle-Resolved Photoemission, Physical Review Letters 111.10 (2013): 107005.
- [7] Supplementary Information
- [8] Shastry, B. Sriram. Extremely correlated Fermi liquids. Physical Review Letters 107.5 (2011): 056403.
- [9] Shastry, B. Sriram. Theory of extreme correlations using canonical Fermions and path integrals. Annals of Physics 343 (2014): 164-199.DOI:http://dx.doi.org/10.1016/j.aop.2014.02.005. (Erratum) Ann. Phys. 373, 717-718 (2016). DOI:http://dx.doi.org/10.1016/j.aop.2016.08.015.
- [10] Shastry, B. Sriram, and Edward Perepelitsky. Low-energy physics of the - model in using extremely correlated Fermi liquid theory: Cutoff second-order equations. Physical Review B 94.4 (2016): 045138.
- [11] Gweon, G-H., B. S. Shastry, and G. D. Gu. Extremely Correlated Fermi-Liquid Description of Normal-State ARPES in Cuprates. Physical Review Letters 107.5 (2011): 056404.
- [12] Matsuyama, K, and Gweon, G-H. Phenomenological Model for the Normal-State Angle-Resolved Photoemission Spectroscopy Line Shapes of High-Temperature Superconductors. Physical Review letters 111.24 (2013): 246401.
- [13] Garcia, D. R., and A. Lanzara. Through a Lattice Darkly: Shedding Light on Electron-Phonon Coupling in the High Tc Cuprates. Advances in Condensed Matter Physics 2010 (2010).
- [14] Yoshida, T., et al. Low-energy electronic structure of the high-Tc cuprates CuO4 studied by angle-resolved photoemission spectroscopy. Journal of Physics: Condensed Matter 19.12 (2007): 125209.
- [15] Mishchenko, A. S., et al. Polaronic metal in lightly doped high-Tc cuprates. EPL (Europhysics Letters) 95.5 (2011): 57007.
- [16] McQueeney, R. J., et al. Anomalous dispersion of LO phonons in La1.85 Sr0.15 CuO4 at low temperatures. Physical Review Letters 82.3 (1999): 628.
- [17] Pintschovius, L., and M. Braden. Anomalous dispersion of LO phonons in La1.85 Sr0.15 CuO4. Physical Review B 60.22 (1999): R15039.
- [18] Fukuda, T., et al.Doping dependence of softening in the bond-stretching phonon mode of Srx CuO4 .Physical Review B 71.6 (2005): 060501.
- [19] Vignolle, B., et al. Two energy scales in the spin excitations of the high-temperature superconductor SrxCuO4. Nature Physics 3.3 (2007): 163-167.
- [20] Yang, K., et al. Normal-state electronic structure in the heavily overdoped regime of Bi1.74 Pb0.38 Sr1.88 Cu single-layer cuprate superconductors: An angle-resolved photoemission study. Physical Review B 73.14 (2006): 144507.
- [21] Ying-Ying, Peng, et al. Doping Evolution of Nodal Band Renormalization in Bi2Sr2Cu Superconductor Revealed by Laser-Based Angle-Resolved Photoemission Spectroscopy. Chinese Physics Letters 30.6 (2013): 067402.
- [22] Meevasana, W., et al. Hierarchy of multiple many-body interaction scales in high-temperature superconductors. Physical Review B 75.17 (2007): 174506.
- [23] Graf, Jeff, et al. Bond stretching phonon softening and kinks in the angle-resolved photoemission spectra of optimally doped Bi2 Sr1.6 La0.4 Cu2 superconductors. Physical Review Letters 100.22 (2008): 227002.
- [24] Bogdanov, P. V., et al. Evidence for an energy scale for quasiparticle dispersion in Bi2 Sr2 CaCu2 O8. Physical Review Letters 85.12 (2000): 2581.
- [25] Zhang, Wentao, et al. Identification of a new form of electron coupling in the Bi2Sr2CaCu2O8 superconductor by laser-based angle-resolved photoemission spectroscopy. Physical Review Letters 100.10 (2008): 107002.
- [26] Vig, Sean, et al. Low-energy bosonic modes in a high-temperature superconductor with incipient charge order. arXiv preprint arXiv:1509.04230 (2015).
- [27] Fong, H. F., et al. Neutron scattering from magnetic excitations in Bi2Sr2CaCu2. Nature 398.6728 (1999): 588-591.
- [28] He, H., et al. Resonant spin excitation in an overdoped high temperature superconductor. Physical Review Letters 86.8 (2001): 1610.
- [29] Ideta, S., et al. Anisotropy of gap and kink energies in the trilayer high-Tc cuprate superconductor Bi2Sr2Ca2Cu3. Journal of Physics: Conference Series 108.1 (2008).
- [30] Ideta, S., et al. Effect of electron-phonon coupling in the ARPES spectra of the tri-layer cuprate Bi2Sr2Ca2Cu3. Journal of Physics: Conference Series 428.1 (2013).
- [31] Borisenko, S. V., et al. Kinks, nodal bilayer splitting, and interband scattering in YBa2 Cu3 . Physical Review Letters 96.11 (2006): 117004.
- [32] Reichardt, W., et al. Phonons in YBa2Cu3. Physica C: Superconductivity 162 (1989): 464-465.
- [33] Pintschovius, L., et al. Oxygen phonon branches in YBa2 Cu3 O7. Physical Review B 69.21 (2004): 214506.
- [34] Rossat-Mignod, J., et al. Neutron scattering study of the YBa2 Cu3 system. Physica C: Superconductivity 185 (1991): 86-92.
- [35] Mook, H. A., et al. Polarized neutron determination of the magnetic excitations in YBa2 Cu3 . Physical Review Letters 70.22 (1993): 3490.
- [36] Dai, P., et al. Magnetic Dynamics in Underdoped YBa2 Cu3 : Direct Observation of a Superconducting Gap. Physical Review Letters 77.27 (1996): 5425.
- [37] Dai, Pengcheng, et al. Evolution of the resonance and incommensurate spin fluctuations in superconducting YBa2 Cu3 . Physical Review B 63.5 (2001): 054525.
- [38] Vishik, I. M., et al. Angle-resolved photoemission spectroscopy study of Hg Ba2 Cu. Physical Review B 89.19 (2014): 195141.
- [39] dÕAstuto, Matteo, et al. Phonon dispersion in the one-layer cuprate HgBa2Cu. Journal of Physics: Condensed Matter 15.50 (2003): 8827.
- [40] Li, Yuan, et al. Hidden magnetic excitation in the pseudogap phase of a high-Tc superconductor. Nature 468.7321 (2010): 283-285.
- [41] Li, Yuan, et al. Two Ising-like magnetic excitations in a single-layer cuprate superconductor. Nature Physics 8.5 (2012): 404-410.
- [42] Chan, M. K., et al. Commensurate antiferromagnetic excitations as a signature of the pseudogap in the tetragonal high-Tc cuprate HgBa2Cu. Nature Communications 7 (2016).
- [43] Chen, Yulin, et al. Unusual layer-dependent charge distribution, collective mode coupling, and superconductivity in multilayer cuprate Ba2 Ca3 Cu4 O8 F2. Physical Review Letters 103.3 (2009): 036403.
- [44] Ronning, F., et al. Evolution of a metal to insulator transition in Cu O2 Cl2 as seen by angle-resolved photoemission. Physical Review B 67.16 (2003): 165101.
- [45] Mannella, Norman, et al. Nodal quasiparticle in pseudogapped colossal magnetoresistive manganites.Nature 438.7067 (2005): 474-478.
- [46] Valla, T., et al. Charge-density-wave-induced modifications to the quasiparticle self-energy in 2H-TaSe 2. Physical Review Letters 85.22 (2000): 4759.
- [47] Brusdeylins, G., et al. He-atom scattering study of the temperature-dependent charge-density-wave surface structure and lattice dynamics of 2H-TaSe2 (001). Physical Review B 41.9 (1990): 5707.
- [48] Schafer, J., et al. Electronic quasiparticle renormalization on the spin wave energy scale. Physical Review Letters 92.9 (2004): 097205.
- [49] Brouet, V., et al. Measuring Fermi velocities with ARPES in narrow band systems: The case of layered cobaltates. Journal of Electron Spectroscopy and Related Phenomena 185.5 (2012): 146-151.