Gemini Near Infrared Field Spectrograph Observations of the Seyfert 2 Galaxy Mrk 573: In Situ Acceleration of Ionized and Molecular Gas off Fueling Flows.
Abstract
We present near-infrared and optical emission-line and stellar kinematics of the Seyfert 2 galaxy Mrk 573 using the Near-Infrared Field Spectrograph (NIFS) at Gemini North and Dual Imaging Spectrograph (DIS) at Apache Point Observatory, respectively. By obtaining full kinematic maps of the infrared ionized and molecular gas and stellar kinematics in a pc2 circumnuclear region of Mrk 573, we find that kinematics within the Narrow-Line Region (NLR) are largely due to a combination of both rotation and in situ acceleration of material originating in the host disk. Combining these observations with large-scale, optical long-slit spectroscopy that traces ionized gas emission out to several kpcs, we find that rotation kinematics dominate the majority of the gas. We find that outflowing gas extends to distances less than 1 kpc, suggesting that outflows in Seyfert galaxies may not be powerful enough to evacuate their entire bulges.
Subject headings
galaxies: active, galaxies: Seyfert, galaxies: kinematics and dynamics, galaxies: individual(Mrk 573)I. Introduction
Supermassive black holes (SMBHs) reside within the centers of all massive galaxies possessing bulges, with a small percentage actively gaining mass from the surrounding accretion disk, which we define as Active Galactic Nuclei (AGN). The fueling of AGN and subsequent feedback is thought to play a critical role in the formation of large-scale structure in the early Universe [46], chemical enrichment of the intergalactic medium [29], and self-regulation of super-massive black hole (SMBH) and galactic bulge growth [26].
In optical and infrared spectroscopy, AGN feedback can be observed as high-velocity gas (200 - 1000 km s-1) inside the Narrow-Line Region (NLR), a region of relatively low density ionized gas extending from the torus to distances between 10 - 1000 pc from their central nuclei. In recent studies using resolved spectroscopy of nearby AGN with the Space Telescope Imaging Spectrograph (STIS) aboard the Hubble Space Telescope (HST) [9, 7] and ground-based Integral Field Units (IFUs; Storchi-Bergmann et al. 53, Müller-Sánchez et al. 37), these high-velocity clouds have been attributed to nuclear mass outflows, with mass outflow rates on the order of 1 - 10 M⊙ yr-1. Associated accretion rates would be 10-100 times greater than what is required for the AGN bolometric luminosities, which suggests that most of the fueling flow does not make it to the central AGN, but is instead blown out by radiation pressure and/or highly-ionized winds [15]. Our group has previously modeled these outflow kinematics in nearby AGN, where the observed velocity pattern often possessed a signature of radial acceleration followed by deceleration [10, 12, 8, 53, 23, 22, 21, 3], credited to either radiative driving or entrainment of clouds in a highly-ionized wind [30] followed by mass loading or interaction with an ambient medium [8]. However, the mechanisms and geometries of mass outflows and fueling flows remain poorly understood.
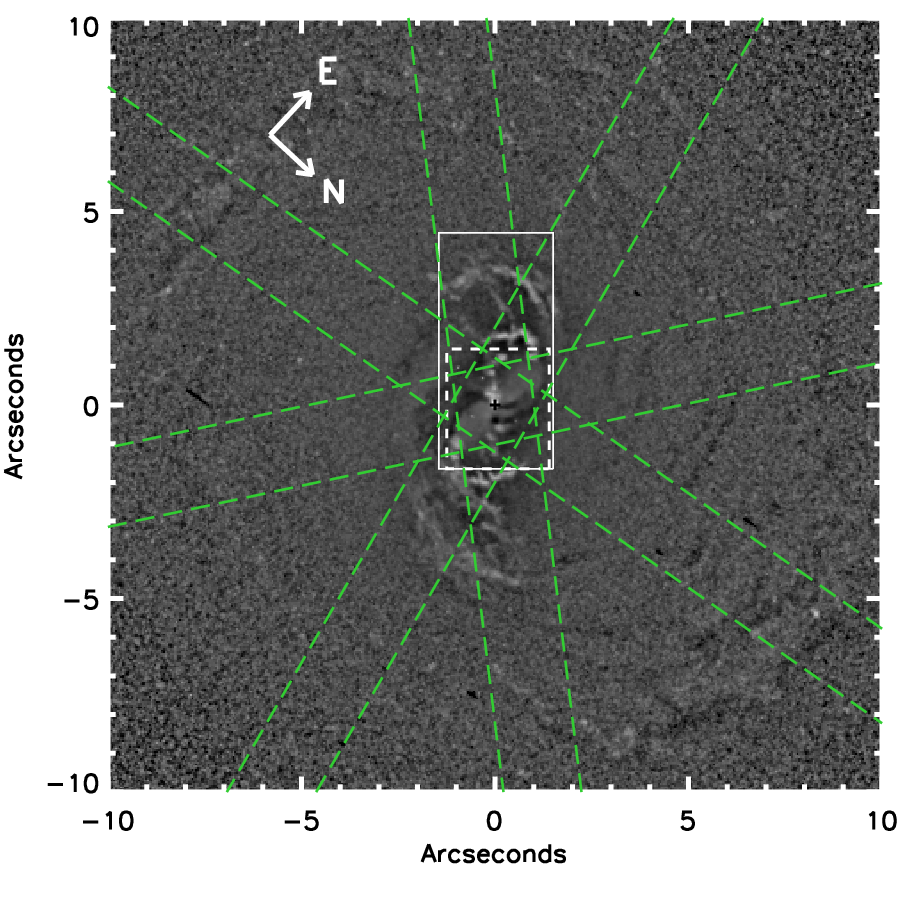
Seyfert 2 AGN Mrk 573 was chosen as an ideal candidate to investigate the connection between fueling flows, in the form of dust spirals [42, 50], and outflows of ionized gas in AGN, as the central engine is radiating near the Eddington limit (log() = 7.28, L, Bian & Gu 4, Kraemer et al. 31). As an (R)SAB0+(rs) spiral galaxy, Mrk 573 has an outer ring, inner ring and host disk generally aligned along a PA of 90, with weak arms forming a bar along a PA , visible in SDSS imaging as shown in Figure 1. A close up of the inner host disk, observed via HST imaging (also Figure 1), shows arcs of ionized gas that are a result of nuclear dust spirals crossing into the ionizing bicone from the central AGN. HST/STIS long-slit spectra along a position angle of 108.8∘ previously revealed that the ionized gas is in outflow [47, 23], with the observed radial velocity pattern at projected distances from the nucleus following the classic acceleration/deceleration found in our kinematic studies of other Seyfert galaxies.
Using kinematic and geometric models (Fischer et al. [23], hereafter Paper I) we had previously concluded that the ionized arcs in the extended NLR were due to an intersection between the inner disk, with an axis inclined 30∘ from our line of sight, and a wide bicone of ionizing radiation, with an axis inclined by 60∘ from our line of sight. However, our previous study found a lack of agreement between our kinematic model and radial velocities at projected distances (700pc) from the nucleus. Large velocities at this distance were hypothesized to be either A) rotation of a high velocity host disk or B) in situ acceleration of gas off spiral arms by the intersecting radiation field or an outflowing wind. The large velocities at this distance could be due to rotation, as suggested by Schlesinger et al. [47], but the unprojected rotation velocities from our previous model in Paper I extend up to 400 km s-1, which are rare in spiral galaxies but not unheard of in spiral galaxies [51]. In addition, the model geometry required the SW side of the inner disk to be closer to us, which, given the velocity curve, would require the disk to be rotating in the sense that the spiral arms are unwinding. Again, this is a very rare but not impossible occurrence [6]. Alternatively, the velocities at distances from the nucleus could be primarily due to in situ acceleration, where the radiation field or an outflowing wind is impinging on the spiral arms. This is an intriguing possibility, because it suggests that at least a portion of the previous fueling flow to the nucleus was ionized after the AGN turned on, and is now being driven out by the AGN.
To address these issues, we have obtained kinematic maps of Mrk 573 in the infrared and optical using Gemini NIFS and APO DIS observations, respectively. By analyzing the interaction between the inner host disk, AGN ionization bicone, and fueling flow, we have determined the source of the kinematics in both the ionized gas arcs and the molecular gas close to the nucleus and their relationship to dust spirals and fueling flows.



II. Observations and Data Reduction
II.1. Gemini NIFS
We observed Mrk 573 using Gemini/NIFS employing the Gemini North Altitude Conjugate Adaptive Optics for the Infrared (ALTAIR) adaptive optics system. We obtained observations in the Z-, J-, and Kl-bands, with spectral resolutions of 4990, 6040, and 5290 respectively, and covering spectral regions between 0.94 - 1.33 and 2.1 - 2.54m. Observation sequencing followed standard object-sky-object dithering [43, 44] with off-source sky positions common for extended targets. Six individual exposures of 600 s were obtained, for 3600 s in total. Data reduction was performed using tasks contained in the NIFS subpackage within the GEMINI IRAF package, in addition to standard IRAF tasks. The reduction process included image trimming, flat fielding, sky subtraction, and wavelength and s-distortion calibrations. Frames were corrected for telluric absorptions and then flux calibrated by interpolating a blackbody function to the spectrum of a telluric standard star. The resultant data cube was median combined into a single data cube via the gemcombine task of the GEMINI IRAF package.
In order to map the kinematics of the ionized spirals into the entire ENLR in length, we obtained NIFS observations of the nucleus and adjacent offset positions roughly SE and NW of the nucleus at a position angle of 133∘ east of north. Due to poor S/N in the offset positions, H2 and stellar kinematic measurements were not obtained outside the nuclear FOV, and [SIII] measurements were only obtained in the nuclear and adjacent SE FOVs. The final data cubes for Z- and Kl-bands contain approximately 8000 and 4500 spatial pixels respectively, with each pixel corresponding to an angular sampling of , allowing us to finely sample the inner regions of Mrk 573. At a redshift of [38], pixels cover an area of 17.1 pc 17.1 pc, across a field of view of the inner (1.026 kpc 1.026 kpc) of the AGN. We note that the observations oversample the point-spread function, which has a full-width at half-maximum (FWHM) of 2 pixels ( 0.1).
Continuum-subtracted [SIII] and H2 images, taken from Z- and Kl-band datacubes respectively, are shown in Figures 2 and 3. Structures in both bands correspond closely to what is seen in the HST imaging of Figure 1. A near-linear feature is seen near the nucleus in [SIII], and the inner southeast arc and a portion of the northwest arc are seen further from the nucleus. Arcs in H2 appear to extend from the nucleus to the north and south, extending out toward the ends of the [SIII] arcs.
II.2. APO DIS
To compare the nuclear kinematics to those observed in the extended host galaxy, we also obtained large-scale long-slit observations of Mrk 573 on four separate occasions using the Dual Imaging Spectrograph (DIS) on the 3.5 m Astrophysical Research Consortium telescope at the Apache Point Observatory in Sunspot, New Mexico. Each observation set was taken with a 2.0′′ slit rotated to various position angles, chosen strategically to cover as much of Mrk 573 as possible. The first observation set (total exposure time of 1800 seconds) was taken on 2013 December 3 and has a position angle of 103∘ - following the major axis of the inner host galaxy as determined through imaging. The second observation set (total exposure time of 1200 seconds) was taken on 2014 December 24 and has a position angle of 140∘. Finally, the third and fourth sets (total exposure time of 2700 seconds for each set) were taken on 2015 August 14 and have position angles of 8∘ and 55∘, respectively. Each observation set results in two spectral images: a blue image using the B1200 grating and a red image using the R1200 grating. Observations were reduced using standard IRAF tasks plus LA-Cosmic [56] to detect and clean cosmic ray hits. At the given redshift, the scale of the images is 342 pc/arcsecond and we are able to characterize radial velocities at a distance up to 6 kpc from the center of the galaxy.
| Inst. | Grating | Spatial Res. | Spectral Res. | Wave Range |
|---|---|---|---|---|
| (′′/pixel) | () | (m) | ||
| NIFS | Z | 0.05 | 4990 | 0.94 - 1.15 |
| NIFS | Klong | 0.05 | 5290 | 2.10 - 2.54 |
| DIS | B1200 | 0.40 | 4000 | 0.43 - 0.55 |
| DIS | R1200 | 0.42 | 5500 | 0.60 - 0.72 |


III. Gemini NIFS : Nuclear Ionized and Molecular Gas Kinematics
Gas fluxes and kinematics in our NIFS observations were determined by fitting emission lines with Gaussians in an automated routine, described in depth in Appendix A. Typical fits to the [S III] and H2 emission-line profiles are shown in Figures 2 and 3. A majority of the spectra with detected emission lines contained single-component lines for both [SIII] and H2, which were fit with a single Gaussian, however regions near the nucleus contained two- and three-component [S III] emission lines, either as individual peaked lines or a single peaked line with asymmetric wings, which were fit with multiple Gaussians.
Fit parameters for both emission lines were used to calculate their observed velocity, FWHM, and integrated flux, mapped in Figures 4 and 5. The Doppler shifted velocity for each emission-line component is given in the rest frame of the galaxy using rest wavelengths of 9533.2 Å and 21218.3Å for [S III] and H2 respectively.
We found Z-band [S III] emission lines to contain up to three components and sorted components between [S III] maps by FWHM. Of the measurable line-component parameters, binning by FWHM is the most successful way to trace kinematics in specific knots of gas across several spaxels. Emission-line components were fit into narrow-, mid-, and broad-width component maps, with the narrowest and second-narrowest components always being placed in the narrow- and medium-width component maps. No thresholds were placed on widths when assigning specific components to maps (i.e. an emission line fit with only one component, such as knot A in Figure 2, would have that component placed in the narrow-component map regardless of width). Component blending is likely observed in regions near borders between fits with different numbers of components. Particularly, redshifted components observed in the narrow-component of the [S III] measurements east of the nucleus are likely a combination of the two-component fits observed closer toward the nucleus, as a jump in line width is observed at the border between single and double component fits. As seen through the lower flux values for these measurements, lower signal-to-noise ratios of these single-component lines are the likely culprit in this discrepancy.


Overlaying the flux map of the [S III] emission from Figure 2 onto the [S III] kinematics, and comparing the morphology to what is seen in the larger structure map in Figure 1, the observed NLR kinematics can be largely credited to two types of structures. The first structure is a near-linear feature extending from the nucleus to the southeast and northwest to radii 500 pc (1.5), along an approximate position angle of 131∘ and reaching peak radial velocities of km s-1. This feature is not solid, but consists of several, aligned knots of emission. Kinematic measurements over the nucleus and bright knots adjacent to the nucleus reveal that the line emission in these regions is generally composed of a bright, narrow (200 km s-1), near-systemic component and a fainter, broad (800 km s-1), offset component, visible in profiles N and B-G in Figure 2. Three component fits to the [SIII] emission line are observed in a very small region 0.4 (140 pc) southeast of the nucleus (profile D in Figure 2), where a second, bright component exists at redshifted velocities km s-1 with some components requiring a FWHM 2000 km s-1. Along the linear set of knots, redshifted and blueshifted velocities peak at different distances from the nucleus, redshifted velocities in the southeast peak at approximately 0.7 (240 pc) and blueshifted velocities in the northwest peak at approximately 1.3 (450 pc), near emission-line knots C/D and G respectively. These amplitudes and directions of the radial velocities in this component agree with those from our HST/STIS long-slit measurements of [O III] in the inner +/- 1 of Mrk 573 (Paper I).
The remaining kinematics can be attributed to the arc features seen in Figure 1. Arcs to the northwest of the nucleus are largely outside of our field of view, with only the closest portion of the inner arc visible 1.6 (550 pc) west of the nucleus (profile H in Figure 2). Arcs to the southeast of the nucleus are largely contained within the combined FOV of the Z-band observations. The inner southeast arc, located at radii ranging between 1.6 and 2.2 (550 pc - 750 pc), contains both redshifted and blueshifted velocities. The central and southern portions of the inner arc have redshifted gas velocities of 100 km s-1 (profile A in Figure 2), similar to the velocities in the adjacent linear feature. Ionized gas in the northern portion of the arc has blueshifted velocities also of 100 km s-1 (profile I in Figure 2). Due to lower intensity, line emission detection in the outer arc (r 2.5 - 3.3, or 0.99 - 1.30 kpc) is less successful. Comparing the location of the arc in Figure 1 with successful measurements in the NIFS FOV, the brightest, northern portion of the outer arc shows blueshifted velocities similar to the adjacent blueshifted knot. Emission-line measurements for all arc features consisted largely of single Gaussian measurements. The amplitudes and directions of the radial velocities in the arcs are similar to those found in the HST long-slit spectra at distances 1 (Paper I).
Figure 4 also incorporates archive radio observations from VLA, from which we can compare its morphology with the morphologies of the ionized gas and determine what effect the radio jet may have on the kinematics of the NLR gas. Knots of radio emission are aligned with the ionized linear feature observed in [SIII], however, their association to one another is unclear. Radio knots do not overlap with centers of emission-line clouds seen in the IR, and exist both radially interior and exterior to the peak redshifted velocities and are co- located with peak blueshifted velocities. These findings are in agreement with similar studies of NGC 1068 and NGC 4151, where there was a lack of connection between radio jet and ionized gas flows [10, 12]. Therefore, as IR cloud positions and velocities are not correlated with the radio knots, we do not expect that the clouds in the linear feature are radially driven by the radio jet,
Kl-band H2 emission lines typically contain a single component, shown in Figure 5. Morphologically, the H2 gas is different than what is observed in [S III]. Initially, the molecular gas appears to be similar to a figure eight. Velocities on either side of the eight are roughly symmetric, but opposite, with the southwest half being redshifted and the northeast half being blueshifted generally to velocities 100 km s-1. Peak redshifted and blueshifted velocities 150 km s-1 reside near the peak velocity positions observed in [S III]. Additionally, the northern, blueshifted filament exhibits redshifted velocities near the continuum centroid of the system.
Comparing the morphologies and kinematics of the [S III] and H2 gas, we find that they are complimentary. Figure 6 plots contours of the [S III] and H2 integrated flux over one another, from which we can compare the locations of the brightest knots in both gases. This comparison shows that the gasses are not co-located, but that the ionized [S III] gas is located interior to the H2 gas with respect to the NLR axis. Evidence for this is highlighted in four regions labeled in Figure 6: I) The west molecular lane has a divot where [SIII] knot resides. II) The north H2 filament rakes out along the northwest [SIII] filament and ends where ionized-gas emission knots are present. III) the southeast linear section also has H2 clouds at further radial distances than the [S III] clouds. IV) The east molecular lane exists at a further radial distance than the adjacent [SIII] arc. Comparing kinematics between the ionized and molecular gasses, both near the arcs and the linear filament, velocities of both gasses are comparable where their projected positions overlap, such that velocities in the molecular gas begin to accelerate to higher velocities near the linear ionized gas feature.
Figure 7 compares the combined ionized and molecular gas morphology to what is observed in the inner region of Figure 1. Here, we see that the ionized gas is located in the same knots of gas that emit in the optical, while molecular gas is co- located with the inner dust lane morphology, with emission directly north / south of the AGN indicating a possible fueling flow to the AGN. Assuming a typical biconical NLR geometry, like the bicone projected onto the host disk in Paper I, these knots of [SIII] and H2 gas appear to be interwoven near the edges of the NLR. This is consistent with our findings in Paper I, as the inner surfaces of spiral arms, which house the illuminated molecular gas, are likely becoming ionized when they are inside the illumination cone, forming the arc structures observed in imaging. This also suggests that the high velocity linear components of ionized gas do not originate from the nucleus, but are instead an ionized portion of rotating spiral arms that is accelerated in situ away from the nucleus as it enters the NLR at small radii. Additional examples of in situ acceleration have already been identified in this AGN, as HST/STIS observations in Paper I had previously shown velocity gradients to exist across the flux peaks of each ionized-gas arc in the NLR where the gas on the interior side of the arm is being ablated off the main structure.
Combining the kinematics of both the ionized and molecular gas therefore creates a continuous story where the spatially resolved NLR is largely the biconical illumination of gas residing in the rotating host disk. As molecular-gas possessing spiral arms pass into the NLR, radiation flooding out from the central source illuminates and ionizes the radial interior of all structure within the volume of the bicone. In turn, this explanation suggests that a majority of the NLR gas originates in the pre-existing fueling flow and was ionized after the AGN turned on and is now being driven out by the AGN.
IV. APO DIS: Extended Ionized Gas Kinematics
While IFU observations allow for excellent analysis of the few, inner arcseconds of Mrk 573, we are also able to observe kinematics of ionized gas in Mrk 573 at larger radial distances using the long-slit observations obtained with APO DIS. For each of the four slit positions, we employed a similar line-fitting procedure to the routine discussed in Section 3 to fit Gaussians to [O III] 5007 and H, in the blue and red images respectively, to characterize the kinematics of the ionized gas out to distances 3.5 kpc. Resultant velocities from our measurements are shown in Figure 8, with flux and FWHM parameters along each slit plotted in Figure 9. Gaussian profiles were also fit to H, [O I] 6300, [N II] 6584, and [S II] 6716,6731 to distinguish the ionization mechanism of the gas throughout our observations. The extent of flux measurements for each emission-line is shown in Figure 9. Narrow-line ratio diagnostics, i.e. BPT diagrams [2, 57, 28], in Figure 10 compare [OIII]/H ratios to [NII]/H, [SII]/H, and [OI]/H ratios, which illustrate that Seyfert/AGN ionization dominates out to distances 2 kpc in most directions.
Ionized gas kinematics in these datasets appear to be largely rotational, with the kinematic major axis being sampled in observations along slit B (PA ) in Figure 8. Velocities within a radius of 1.5 do not follow the rotation pattern, which is to be expected as this gas experiences high velocity outflows as observed in the NIFS data. Bumps in H emission at 10 in Slit D (PA ) are due to star formation from spiral arms coming off of a large stellar bar, as observed by Pogge & De Robertis [41], Afanasiev et al. [1].
V. Comparison With Rotation
In order to determine where the observed ionized and molecular gas kinematics are affiliated with rotation, we can compare their velocities to stellar kinematics in the host disk. We measured stellar kinematics in the NIFS data using the penalized pixel-fitting (PPXF) method of Cappellari & Emsellem (2004). We fit 12COλ2.29, 12COλ2.32, and 13COm stellar absorption lines within the K-band FOV following the procedure described in Riffel et al. [45]. Stellar templates of 60 early-type stars [59] were used to obtain the stellar line-of-sight velocity distribution at each position. The observed stellar velocities are shown in the left panel of Figure 11. White regions in the velocity map correspond to positions where the signal-to-noise ratio in the CO bands was not high enough to allow good fits. Several spaxels near the nucleus of the galaxy contain spectra that could not be properly fit due to the dilution of the CO absorptions by non-stellar continuum emission. Kinematics depict a rotation pattern with blueshifts to the east and redshifts to the west of the nucleus, a maximum velocity of 200 km s-1, and a major axis along the east/west direction.


To characterize the rotation of the stellar kinematics within the host disk, we used DiskFit [52, 49, 32], a publicly available code that fits non-parametric models to a given velocity field. We applied the rotation model to the NIFS stellar kinematics using initial host major axis position angle and ellipticity parameters based on isophote measurements from previous I-band photometric analysis [48]. Within a radius of 5, which contains the entirety of our NIFS K-band FOV, the position angle and average ellipticity () of the system are approximately 97 and 0.1 respectively. The resultant model and residuals are shown in Figure 11. We note that despite significant localized residuals due to large uncertainties in the stellar absorption measurements, the rotation model provides a reasonable global fit to the stellar kinematics.
We are able to analyze the source of the gas kinematics in the NIFS nuclear FOV by comparing them to our stellar rotation model. The bottom panels of Figure 11 map the residual velocity difference between the [SIII] / H2 gas and stellar kinematics. Ionized gas arcs and molecular gas lanes east and west of the nucleus largely agree with rotation, as the residuals between gas and stars in these locations are 25 km s-1. Molecular gas is in rotation until it reaches close proximity to the ionization cones emitted from the central engine, where it exhibits kinematics similar to the ionized [SIII] gas in the linear filament. Here, both gasses have velocities largely offset from rotation, traveling outward from the nucleus. The northeast molecular hydrogen gas depicts this prominently, with gas being driven away in the redshifted direction before it approaches the nucleus and is driven away in the blueshifted direction after it passes the nucleus. Therefore, comparing our measurements of stellar and ionized/molecular gas kinematics of the inner, nuclear region, we find that the observed gas follows a rotation pattern until it enters the NLR.
We can also compare the stellar kinematics observed with NIFS to the large-scale ionized gas kinematics in the host galaxy through measurements obtained from our APO DIS observations. We again used DiskFit to characterize the rotation of the extended gas kinematics within the host disk, applying a rotation model to the DIS [O III] and H kinematics. As DIS observations extend to radii greater than 5, we employ host parameters determined via isophote fits of the greater host disk morphology as observed in the SDSS image in Figure 1. Using the ellipse IRAF task, the position angle and ellipticity for the outer disk were measured as 92 and 0.275, respectively, similar to those found from the inner disk in the NIFS data. From these large-scale, long-slit measurements we find that the kinematics at radii 5 again largely follow a rotation pattern, even in regions that are aligned along the NLR axis, which provides evidence that gas can be illuminated inside the NLR at large radii which does not exhibit outflow kinematics. We see that the large radius ionized gas kinematics largely agree with the stellar kinematics at smaller radii by comparing velocities obtained from our stellar and ionized gas kinematic models, as shown in Figure 12. In this figure, we plot the kinematics of DIS ionized gas outside 3 to avoid kinematic contamination from outflows, and the NIFS stellar kinematics inside 1.5 to avoid low S/N measurements near the edge of the FOV, along the position angle of Slit B. We find both datasets to be in general agreement and representative of a typical disk rotation curve, supporting the notion that rotation dominates any ionized gas kinematics at distances greater than 5 (1.75 kpc).

With the additional information gained from the NIFS and DIS spectra, it is clear that a majority of the observed kinematics do in fact agree with a rotation model. We find that the maximum observed velocity in the large- scale APO observations to be 130 km s-1. With the outer host disk having an inclination of , determined via our ellipse fitting, deprojecting the observed maximum velocity would result in a rotational velocity 190 km s-1. The remaining puzzle lies in explaining the deviations from the rotation curve, observed as the high velocity linear feature and, to a lesser extent, the velocity gradients observed across the emission-line arcs noted in Paper I. Assuming that these deviations are correlated, an immediate guess to the culprit would be radiative driving, as the interaction between AGN radiation and pre-existing host material has already been made evident.
VI. Comparison with Radiative Driving
Here, we compare the radiative acceleration to the gravitational deceleration experienced by the gas at a given radius to determine if radiative driving could produce the observed non-rotating kinematics inside the NLR at the observed radii.
VI.1. Gravitational Deceleration


Gravitational deceleration was measured by determining the enclosed mass as a function of radius. Using a method similar to the one used by Das et al. [11] for NGC 1068, HST WFPC2/PC F814W imaging of this galaxy was decomposed using GALFIT version 3.0.5 [39, 40] in order to measure enclosed mass of Mrk 573. We find that the best fitting model is composed of three Sérsic components with parameters described in Table 2. The original image, GALFIT model, and resulting residual map, are presented in Figure 13. Component 1, the innermost one, can be identified as a disk, which is coplanar with the outer disk and ring such that position angle and inclination properties agree with our previous measurements and has a morphology similar to that described by Martini et al. [35], Laine et al. [33]. Component 2 has a very small deviation from circular symmetry,which is consistent with a bulge, but given the Sérsic index n=0.58 it is better classified as a pseudobulge [25]. Component 3 is elongated similar to component 1, due to illuminated spiral arms north and south of the nucleus, and classified as a bar by Laine et al. [33].
The radial mass distribution of these three components (Figure 14) was calculated using the expressions from Terzić & Graham (2005). The Sérsic profile is given by the following expression [40]:
| Comp. | I (mag) | Re (pc) | n | b/a | PA (deg) | f |
|---|---|---|---|---|---|---|
| 1 | 14.29 | 365 | 1.79 | 0.64 | 94.7 | 0.21 |
| 2 | 14.26 | 670 | 0.58 | 0.97 | 88.0 | 0.20 |
| 3 | 13.13 | 2880 | 0.39 | 0.78 | 1.7 | 0.59 |
- •
Col. (1) indicates the Sérsic component; Col. (2) gives the integrated I band magnitude; Col. (3) Effective radius; Col. (4) gives the Sérsic index; Cols. (5) and (6) give the axial ratio and position angle of the component; Col. (7) gives the fraction of the integrated flux from each component.
| (1) |
where is the surface brightness, is the surface brightness at the effective radius, is a constant that depends on , the index of the profile, and is the effective radius.
The value is calculated using the equation:
| (2) |
where is the gamma function, is the axial ratio of the Sérsic component and represents deviations from a perfect ellipse [40]. This term has a value of the order of unity and will be disregarded in our calculations.
Following Equation 4 in Terzić & Graham [54] we have that the mass density of a Sérsic component is given by the following expressions:
| (3) |
| (4) |
| (5) |
where is the mass to light ratio, assumed to be 5. Notice that due to a difference in notation between Peng et al. [40] and Terzić & Graham [54], the expression for has an addition term. Also, the expression for corresponds to values in the range . Two of our components are slightly outside this range, but we do not expect a large deviation in the results by using this expression.
Finally, we have from Equation A2 in Terzić & Graham [54] that the mass profile is given by:
| (6) |
where is the incomplete gamma function and is given by . Using Equation 10 of Terzić & Graham [54], we can calculate the enclosed mass at a given radius and thus determine the gravitational deceleration at said radius. This is critical in determining where gas can be radiatively accelerated, as shown below.
VI.2. Radiative Acceleration


In order to determine whether the emission-line gas can be radiatively accelerated in situ, we used the radiation-gravity formalism detailed in Das et al. [11]. Assuming an azimuthally symmetric distribution, velocity as a function of radial distance, , in units of km s-1 and pc, can be written as:
| (7) |
where is the bolometric luminosity, in units of 1044 ergs s-1, is the Force Multiplier, or ratio of the total photo-absorption cross-section to the Thomson cross-section, is the enclosed mass at the distance , determined from the radial mass distribution described above, and is the launch radius of the gas.
In Kraemer et al. [31] we derived a value for ergs s-1. In order to determine , we generated photo-ionization models with Cloudy 13.03 [16] and the ionizing continuum derived in Kraemer et al. Models with log predict that S+2 is the peak ionization state for sulfur, and therefore can be used to constrain the physical conditions in the [S III] emission-line gas. At this ionization, Cloudy predicts 3300 at the ionized face of an illuminated slab and we use this value to solve for . Calculating required solving an incomplete Gamma function, hence we determined it at 10 pc intervals over a range of . We derived an expression for the enclosed mass as a function of , in each 10 pc interval from to , using a powerlaw of the form . We were then able to solve for analytically, by integrating within each interval.
In calculating , we address two points regarding mass outflow in Mrk 573. First, can the emission-line gas be radiatively accelerated in situ? In the top panel of Figure 15, we show for several different values of , which illustrates that in situ radiative acceleration is possible (out to 0.5 kpc) in this object. The bottom panel plots the effect of different Eddington ratios (, with Mrk 573 having a ratio of ) on a cloud launched from 200 pc. This illustrates that AGN as luminous as 0.5 cannot successfully launch outflows from a distance of 200 pc. Second, given the deprojected radial distances and velocities of individual emission-line knots, can we determine the radial distances at which they originated? Using the major axis position angle of the inner disk of 95 and a maximum ellipticity of the inner 5 from Schmitt & Kinney [48], , we calculate the portion of the host disk containing the NLR knots near PA to be inclined out of the plane of the sky. Observed velocities and distances, deprojected velocities and distances and resulting origin distances, model velocities, and distances traveled for emission line components in each knot are given in Table 3. Knot emission lines without a modeled velocity and travel distance originate at a distance too small to calculate using Equation 11, i.e. the clouds originate at a distance less than 10 pc from their current position.
Using our radiative acceleration model, we find that many of the observed emission-line clouds originate locally, i.e. within 17 parsecs, or 1 spatial pixel, of their observed position. Clouds which originate further from their observed position, Mid-width components in Knots B and C and Narrow- and Mid-width components in Knots F and G, have travel distances that can place their origin position at knot flux peaks radially interior to their position. Mid-width components in Knots B and C travel distances of 0.25 and 0.2, placing their origin points near flux peaks west and northwest of the current positions, respectively. Narrow- and Mid-width components in Knots F have travel distances of 0.18 and 0.15, placing their origin points near Knot E. Narrow- and Mid-width components in Knots G have travel distances of 0.78 and 0.31, placing their origin points near Knots E and F, respectively. Except for the mid-width component of Knot G, all kinematic components can be shown to originate in bright knots of ionized gas located near molecular gas lanes outside the NLR (see Figure 7), consistent with the explanation that the radiatively driven NLR gas kinematics are due to in situ acceleration of gas originating in the host disk outside of the AGN.
| Knot | Component | Projected V | True V | Projected D | True D | Origin D | Modeled V | Travel D |
|---|---|---|---|---|---|---|---|---|
| (km s-1) | (km s-1) | (pc) | (pc) | (pc) | (km s-1) | (pc) | ||
| A | Narrow | -16 | -56 | 602 | 628 | 615 | -56 | 13 |
| B | Narrow | 8 | 28 | 397 | 414 | 414 | — | — |
| Mid | 126 | 441 | 397 | 414 | 330 | 456 | 84 | |
| C | Narrow | 47 | 165 | 294 | 307 | 307 | — | — |
| Mid | 182 | 637 | 294 | 307 | 240 | 652 | 67 | |
| D | Narrow | 6 | 21 | 120 | 125 | 125 | — | — |
| Mid | 260 | 910 | 120 | 125 | 115 | 981 | 10 | |
| Wide | 285 | 997 | 120 | 125 | 115 | 981 | 10 | |
| E | Narrow | -138 | -483 | 229 | 239 | 225 | -466 | 14 |
| Mid | -25 | -88 | 229 | 239 | 239 | — | — | |
| F | Narrow | -168 | -588 | 311 | 324 | 260 | -567 | 64 |
| Mid | -152 | -532 | 311 | 324 | 270 | -512 | 54 | |
| G | Narrow | -359 | -1257 | 428 | 446 | 170 | -1231 | 276 |
| Mid | -137 | -480 | 428 | 446 | 335 | -482 | 111 |
VII. Discussion
From our analysis and modeling of the gas and stellar kinematics in Mrk 573, it is clear that the observed kinematic profiles in this system consist of both outflows and rotation. Gas outside the NLR ionizing bicone and at large distances from the AGN contain velocities that are consistent with rotation derived from stellar kinematics. Gas inside and immediately adjacent to the NLR at small radii have high-velocity kinematics which deviate from rotation and appear to travel radially from the central engine. From our work, it can now be shown that these two sets of kinematics may be attributed to one process: the interaction between ionizing radiation from the AGN and its host disk (Figure 16). Gas in the disk is originally in rotation as the AGN turns on and releases ionizing radiation from the central engine into the host disk material. This interaction between AGN radiation and host material ionizes gas in the arms, creating the spatially-resolved NLR morphology we observe. At small radii from the AGN, the ionized gas can experience enough radiative acceleration to be driven outward from the nucleus, producing kinematics we interpret as AGN outflows that are required for bulge evacuation scenarios. At increasingly large radii, gas ionized by the AGN experiences less radiative acceleration from the AGN photons and more gravitational attraction from the bulge mass enclosed at that radius, preventing further evacuation and preserving the original structure and kinematics of the preexisting gas lanes. Therefore, returning to our hypotheses from Paper I, the kinematics observed at in HST/STIS observations are predominantly due to rotation with localized in situ acceleration of spiral arm gas.

Spatially resolved observations of NLR kinematics in other recent works offer interpretations of AGN feedback and NLR / disk interactions similar to our own. Müller-Sánchez et al. [37] attributed AGN coronal line kinematics to a combination of rotation and outflows. Davies et al. [13] studied H2 and stellar kinematics in several nearby Seyferts and found the molecular gas was often in rotation, except when located adjacent to outflows located within the NLR. Lena et al. [34] found the kinematics of the extended NLR gas in NGC 1386 to be in rotation, suggesting that the morphology results from photoionization of material within the host disk. Recent studies on the extent of AGN feedback by Karouzos et al. [27] and Villar-Martín et al. [58] have also found the size of outflows versus the entire morphological extent of the NLR to be relatively small. Additionally, comparing accretion rates versus mass outflow rates for several AGN [53, 7, 14], outflow rates are often larger by orders of magnitude. If the outflowing material originated largely in the nucleus, the AGN duty cycle would be extremely short and the central engine would frequently experience accretion disk depletion. Having the gas reservoir exist outside the accretion disk alleviates this problem and is consistent with our conclusion.
With knowledge of the host disk inclination and position angle, we can deproject the maximum radius of the NLR outflows and derive the extent of the feedback process. Using the major axis position angle and ellipticity of the inner 5 from Schmitt & Kinney [48], the maximum deprojected radii of our measurements along the NLR axis of 128 increase by only 7, and the maximum radial extent of radiatively driven gas is 750 pc. As the resolved NLR is the largest structure that depicts the interaction between this AGN and its host galaxy, this is the maximum distance at which the AGN can impose negative feedback. With AGN feedback unable to fully evacuate a bulge housing an AGN radiating near Eddington, such as Mrk 573, it becomes unclear if bulge clearing negative feedback processes are successful in the local universe. Therefore, for negative feedback via AGN outflows to be successful, the size of the bulge in radio-quiet AGN at the time it is evacuated in quenching scenarios must be much smaller than typical kpc-scale bulge radii currently observed in nearby galaxies, while still maintaining an AGN radiating near Eddington.
From Figures 9, 11, and 12, Mrk 573 has a projected rotating velocity of 50 km s-1 near the maximum radial outflow distance of 750 pc along the major axis (Slit B). Deprojecting this to a true velocity of 115 km s-1, the time required to rotate the host disk once at this radius would be years. During each rotational lap, the gas in the host disk would experience radiative driving by the AGN at two separate epochs, once for each intersection with a cone of ionizing radiation emitted by the AGN. Therefore, gas in the host disk experiences radiative driving every years. If we assume that the NLR orientation is static and that its intersection with the host disk intersection currently impacts approximately half of the host disk volume at radii 750 pc, then each epoch of radiative driving experienced by material in the host disk lasts years. Assuming an AGN duty cycle of years (galaxy lifetime years, 1 of galaxies are currently active), then the host disk rotates twice during an active period. Cumulatively, the total time spent inside the ionizing bicone of the NLR for any parcel of gas at radii 750pc is then years.
By measuring the amount of hydrogen gas in the NIFS FOV, we can form an estimate for the total amount of gas within that a radius that would need to be evacuated via radiative driving. Per Mazzalay et al. [36], the cold molecular gas mass can be estimated as:
| (8) |
where is the luminosity of the H2 line. Using an integrated flux of erg s-1 cm-2 and a distance of D = 70.55 Mpc, we calculate an H2 luminosity of 2.74 erg s-1 and a cold molecular gas mass of MM☉. As that is the currently observed mass, we assume double the mass as an estimate for the original gas mass of 109 M☉. Therefore, with an initial mass estimate of 109 M☉ and a cumulative timescale of radiative driving of 4.8 years, the required mass outflow rate to evacuate gas within a radius of 750 pc would be 25 M☉ yr-1. This may not be an unreasonable mass outflow rate; we have previously estimated a peak outflow rate of 3 M☉ yr-1 for NGC 4151 [53, 7], which has a much lower luminosity and Eddington ratio. In a future paper (Revalski et al., in prep), we will give the resolved mass outflow rate in the NLR of Mrk 573 for comparison.
As the gas being radially driven from the nucleus is likely more important in understanding the impact of the AGN on its host, we suggest to define this gas as the true NLR of Mrk 573. Therefore, assuming a symmetric extent west of the nucleus, radiatively driven gas along the NLR axis extends to projected distances of 2 (700 pc). Ionized gas exterior to the NLR, with an orderly velocity field characteristic of normal galactic rotation, should reside in the Extended Narrow Line Region (ENLR), as originally defined by Unger et al. [55]. In Mrk 573, we detect the ENLR out to projected distances greater than 6 kpc. As such, future projects analyzing spatially-resolved kinematics of AGN-ionized emission-lines should clarify the extent of the NLR vs the ENLR, as the scale between the two regions in Mrk 573, RNLR/RENLR, is no greater than 0.12.
It is notable that, if all gas kinematics can be attributed to material approximately within the disk, a high-velocity, leading-arm host disk in Mrk 573 is no longer viable. Rotating gas is observed to be blueshifted to the east of the nucleus and redshifted to the west, yet radial outflows exhibit redshifts to the southeast and blueshifts to the northwest. The only orientation that can produce this combination of kinematic signatures places the north edge of the disk as the nearest edge (contrary to our claim in Paper I). Moving the north edge out of the plane of the sky results in the disk rotating in the clockwise direction, making the host disk a traditional trailing-arm system. Our previous model from Paper I created a biconical outflow model that required a host-disk inclined in the opposite direction, with the southeast side coming out of the plane of the sky, to satisfy both kinematic and morphological parameters. Thus, as illustrated by our studies of Mrk 573, radial velocity maps from IFU observations are likely to provide much better constraints on the outflow geometries than previous long-slit observations at similar angular resolutions.
VIII. Conclusions
We observed the Seyfert 2 AGN Mrk 573 with Gemini NIFS and APO DIS and obtained ionized gas, molecular gas, and stellar kinematic maps surrounding its nucleus and ionized gas in the extended host disk. Our main conclusions are as follows:
1) Flux distributions of [S III] and H2 in Gemini NIFS observations are vastly different yet complementary. [S III] emission mimics that observed in the optical NLR (e.g., in [O III]); arcs of emission and a linear nuclear feature which initially appear to be kinematically unrelated. However, H2 emission reveals arcs of gas that lie outside the NLR bicone, which connect the ionized gas features.
2) The velocity field of the ionized and molecular arcs in NIFS observations and large scale ionized gas kinematics in APO/DIS observations show signatures of rotation as observed in NIFS stellar kinematics. Therefore, the kinematics of these features are credited to rotation. Detecting such a continuous morphology in material inside/outside of the NLR, which shows signs of rotation throughout, suggests that the NLR kinematics and morphology in Mrk 573 can largely be attributed to material originating in the rotating host disk.
3) Given that the kinematics are largely rotation, deviations from the expected rotation curve exist along the axis of the projected NLR at radii pc. We can explain these deviations as radiative, in situ acceleration of material residing in the host disk with different kinematic profiles in the NLR (i.e. outflow versus rotation) existing as a function of radius.
4) Radiatively driven gas in the NLR only extends to distances of 750 pc from the nucleus and not the entire length of the combined NLR/ENLR, which suggests that AGN outflows in this Seyfert galaxy may have a much smaller range of impact than was previously expected.
From the evidence seen in Mrk 573, it is likely that the NLR is still biconical in geometry, however the majority of the NLR volume is filled with ionizing radiation from the central source that is illuminating material that already exists in the host galaxy environment, providing the spatially-resolved morphology we observe. Should the kinematic explanation of the NLR in Mrk 573 prove to be applicable to a majority of AGN, outflows may be more prevalent than previously thought [21, 24] but likely do not extend far enough to clear the host bulge. Incorporating molecular gas and stellar populations in the kinematic analysis of AGN feeding and feedback is vital to understanding the interaction between the central engine and host disk. As such, the Near InfraRed Spectrograph (NIRSpec) on the James Webb Space Telescope will likely be a boon to observing spatially resolved feeding and feedback processes in AGN, allowing for observations at a greater sensitivity out to higher redshifts than current, ground-based instruments.
References
- [1] Afanasiev, V. L., Burenkov, A. N., Shapovalova, A. I., & Vlasyuk, V. V. 1996, in Astronomical Society of the Pacific Conference Series, Vol. 91, IAU Colloq. 157: Barred Galaxies, ed. R. Buta, D. A. Crocker, & B. G. Elmegreen, 218
- [2] Baldwin, J. A., Phillips, M. M., & Terlevich, R. 1981, PASP, 93, 5
- [3] Barbosa, F. K. B., Storchi-Bergmann, T., McGregor, P., Vale, T. B., & Rogemar Riffel, A. 2014, MNRAS, 445, 2353
- [4] Bian, W., & Gu, Q. 2007, ApJ, 657, 159
- [5] Buchner, J. et al. 2014, A&A, 564, A125
- [6] Buta, R. J., Byrd, G. G., & Freeman, T. 2003, AJ, 125, 634
- [7] Crenshaw, D. M., Fischer, T. C., Kraemer, S. B., & Schmitt, H. R. 2015, ApJ, 799, 83
- [8] Crenshaw, D. M., Kraemer, S. B., Schmitt, H. R., Jaffé, Y. L., Deo, R. P., Collins, N. R., & Fischer, T. C. 2010, AJ, 139, 871
- [9] Crenshaw, D. M., Kraemer, S. B., Schmitt, H. R., Kaastra, J. S., Arav, N., Gabel, J. R., & Korista, K. T. 2009, ApJ, 698, 281
- [10] Das, V. et al. 2005, AJ, 130, 945
- [11] Das, V., Crenshaw, D. M., & Kraemer, S. B. 2007, ApJ, 656, 699
- [12] Das, V., Crenshaw, D. M., Kraemer, S. B., & Deo, R. P. 2006, AJ, 132, 620
- [13] Davies, R. I. et al. 2014, ApJ, 792, 101
- [14] Diniz, M. R., Riffel, R. A., Storchi-Bergmann, T., & Winge, C. 2015, MNRAS, 453, 1727
- [15] Everett, J. E., & Murray, N. 2007, ApJ, 656, 93
- [16] Ferland, G. J. et al. 2013, Rev. Mexicana Astron. Astrofis., 49, 137
- [17] Feroz, F., Balan, S. T., & Hobson, M. P. 2011, MNRAS, 415, 3462
- [18] Feroz, F., & Hobson, M. P. 2008, MNRAS, 384, 449
- [19] Feroz, F., Hobson, M. P., & Bridges, M. 2009, MNRAS, 398, 1601
- [20] Feroz, F., Hobson, M. P., Cameron, E., & Pettitt, A. N. 2013, ArXiv e-prints
- [21] Fischer, T. C., Crenshaw, D. M., Kraemer, S. B., & Schmitt, H. R. 2013, ApJS, 209, 1
- [22] Fischer, T. C., Crenshaw, D. M., Kraemer, S. B., Schmitt, H. R., Mushotsky, R. F., & Dunn, J. P. 2011, ApJ, 727, 71
- [23] Fischer, T. C., Crenshaw, D. M., Kraemer, S. B., Schmitt, H. R., & Trippe, M. L. 2010, AJ, 140, 577
- [24] Fischer, T. C., Crenshaw, D. M., Kraemer, S. B., Schmitt, H. R., & Turner, T. J. 2014, ApJ, 785, 25
- [25] Fisher, D. B., & Drory, N. 2008, AJ, 136, 773
- [26] Hopkins, P. F., Hernquist, L., Cox, T. J., Di Matteo, T., Martini, P., Robertson, B., & Springel, V. 2005, ApJ, 630, 705
- [27] Karouzos, M., Woo, J.-H., & Bae, H.-J. 2016, ApJ, 819, 148
- [28] Kewley, L. J., Groves, B., Kauffmann, G., & Heckman, T. 2006, MNRAS, 372, 961
- [29] Khalatyan, A., Cattaneo, A., Schramm, M., Gottlöber, S., Steinmetz, M., & Wisotzki, L. 2008, MNRAS, 387, 13
- [30] Kraemer, S. B., Bottorff, M. C., & Crenshaw, D. M. 2007, ApJ, 668, 730
- [31] Kraemer, S. B., Trippe, M. L., Crenshaw, D. M., Meléndez, M., Schmitt, H. R., & Fischer, T. C. 2009, ApJ, 698, 106
- [32] Kuzio de Naray, R., Arsenault, C. A., Spekkens, K., Sellwood, J. A., McDonald, M., Simon, J. D., & Teuben, P. 2012, MNRAS, 427, 2523
- [33] Laine, S., Shlosman, I., Knapen, J. H., & Peletier, R. F. 2002, ApJ, 567, 97
- [34] Lena, D. et al. 2015, ApJ, 806, 84
- [35] Martini, P., Pogge, R. W., Ravindranath, S., & An, J. H. 2001, ApJ, 562, 139
- [36] Mazzalay, X. et al. 2013, MNRAS, 428, 2389
- [37] Müller-Sánchez, F., Prieto, M. A., Hicks, E. K. S., Vives-Arias, H., Davies, R. I., Malkan, M., Tacconi, L. J., & Genzel, R. 2011, ApJ, 739, 69
- [38] Nelson, C. H., & Whittle, M. 1995, ApJS, 99, 67
- [39] Peng, C. Y., Ho, L. C., Impey, C. D., & Rix, H.-W. 2002, AJ, 124, 266
- [40] ——. 2010, AJ, 139, 2097
- [41] Pogge, R. W., & De Robertis, M. M. 1995, ApJ, 451, 585
- [42] Pogge, R. W., & Martini, P. 2002, ApJ, 569, 624
- [43] Riffel, R. A., & Storchi-Bergmann, T. 2011, MNRAS, 417, 2752
- [44] Riffel, R. A., Storchi-Bergmann, T., & Winge, C. 2013, MNRAS, 430, 2249
- [45] Riffel, R. A., Storchi-Bergmann, T., Winge, C., McGregor, P. J., Beck, T., & Schmitt, H. 2008, MNRAS, 385, 1129
- [46] Scannapieco, E., & Oh, S. P. 2004, ApJ, 608, 62
- [47] Schlesinger, K., Pogge, R. W., Martini, P., Shields, J. C., & Fields, D. 2009, ApJ, 699, 857
- [48] Schmitt, H. R., & Kinney, A. L. 2000, ApJS, 128, 479
- [49] Sellwood, J. A., & Sánchez, R. Z. 2010, MNRAS, 404, 1733
- [50] Simões Lopes, R. D., Storchi-Bergmann, T., de Fátima Saraiva, M., & Martini, P. 2007, ApJ, 655, 718
- [51] Sparke, L. S., & Gallagher, III, J. S. 2000, Galaxies in the universe : an introduction (Cambridge University Press)
- [52] Spekkens, K., & Sellwood, J. A. 2007, ApJ, 664, 204
- [53] Storchi-Bergmann, T., Lopes, R. D. S., McGregor, P. J., Riffel, R. A., Beck, T., & Martini, P. 2010, MNRAS, 402, 819
- [54] Terzić, B., & Graham, A. W. 2005, MNRAS, 362, 197
- [55] Unger, S. W., Pedlar, A., Axon, D. J., Whittle, M., Meurs, E. J. A., & Ward, M. J. 1987, MNRAS, 228, 671
- [56] van Dokkum, P. G. 2001, PASP, 113, 1420
- [57] Veilleux, S., & Osterbrock, D. E. 1987, ApJS, 63, 295
- [58] Villar-Martín, M., Arribas, S., Emonts, B., Humphrey, A., Tadhunter, C., Bessiere, P., Cabrera Lavers, A., & Ramos Almeida, C. 2016, MNRAS, 460, 130
- [59] Winge, C., Riffel, R. A., & Storchi-Bergmann, T. 2009, ApJS, 185, 186
Appendix A IFU Spectral Analysis
We have devised a new fitting technique for IFU observations that allows us to determine the number of meaningful kinematic components for each emission line based on the fits. This process employed Bayesian model selection, described below, as this technique is well suited to extracting individual velocities from blended lines.
Model-fitting estimates the most probable set of model parameters, of a model in comparison to the given data, . In our case, Gaussian parameters (centroid), (dispersion), and (peak height). To determine , one maximizes the posterior probability :
| (A1) |
where is the likelihood of the model parameters, is the prior probability of the parameters, and is the marginal likelihood, or Bayesian evidence, whose role is to normalize the posterior probability. For model , the evidence is constant. Therefore, to determine , it is sufficient to maximize the numerator of Equation 1, the likelihood (or ) under prior constraints. However, in order to compare individual line- component models, the ratio of the evidences is required. The ratio of the probabilities of two models and , given the data , can be expressed as:
| (A2) |
where is the a priori probability of model . Without a preference for a specific model, , the posterior odds ratio becomes a ratio between the two evidences where . The logarithm of the ratio of evidences provides a guide to what constitutes a significant difference between models:
| (A3) |
where a is used in our measurements as strong evidence that the more complex model is superior, per Feroz et al. [17]. For a given data set, the evidence for model is defined as the marginalized likelihood:
| (A4) |
Our model-fitting code employs the Importance Nested Sampling algorithm as implemented in the MultiNest library [18, 19, 20, 5] to compute the logarithm of the evidence, , for each model.
Our overall procedure, as illustrated in Figure 17, is therefore as follows. Models are run for zero components (; continuum) and one component (; continuum plus Gaussian). If is favored over , the data is analyzed with a two-component model (, continuum plus two Gaussians), with the process repeating until the more complex model is no longer favored. We utilize Bayesian model selection in our automated fitting as reduced- fitting is not suited to truly assess the relative probabilities of models because the decrease in observed when introducing a more complex model could be due to either the presence of another line component present in the profile or simply to over-fitting.


Priors in our models are selected based on physical considerations. The centroid position () for each Gaussian was limited to a 50Å range around each emission line that contained the entirety of the line profile throughout the datacube. Gaussian standard deviation () ranged from a minimum width determined by the spectral resolution in each band to an artificial limit of 15Å (Z-band FWHM 1100 km s-1; K-band FWHM 500 km s-1 ). Gaussian height () was restricted to a minimum value of 3 times the standard deviation of the continuum () and given a virtually unbound maximum height restriction of 3 108.