Stronger Reflection from Black Hole Accretion Disks
in Soft X-ray States
Abstract
We analyze 15,000 spectra of 29 stellar-mass black hole candidates collected over the 16-year mission lifetime of RXTE using a simple phenomenological model. As these black holes vary widely in luminosity and progress through a sequence of spectral states, which we broadly refer to as hard and soft, we focus on two spectral components: The Compton power law and the reflection spectrum it generates by illuminating the accretion disk. Our proxy for the strength of reflection is the equivalent width of the Fe-K line as measured with respect to the power law. A key distinction of our work is that for all states we estimate the continuum under the line by excluding the thermal disk component and using only the component that is responsible for fluorescing the Fe-K line, namely the Compton power law. We find that reflection is several times more pronounced () in soft compared to hard spectral states. This is most readily caused by the dilution of the Fe line amplitude from Compton scattering in the corona, which has a higher optical depth in hard states. Alternatively, this could be explained by a more compact corona in soft (compared to hard) states, which would result in a higher reflection fraction.
Subject headings
accretion, accretion disks — black hole physics — X-rays: binariesI. Introduction
During the course of its 16-year mission, the Rossi X-ray Timing Explorer (RXTE) detected far more photons (30 billion in PCU-2 alone) from accreting black holes than any other X-ray observatory. The sample of black holes (BHs) targeted by RXTE is chiefly comprised of nearby stellar-mass systems. While the total Galactic population of stellar BHs is believed to be many millions, only a tiny subset of approximately 50 are known to us, namely those located in X-ray binaries.
A wondrous property of BHs, their utter simplicity, is the essence of the famous no-hair theorem: Each BH in nature is fully described by just its mass and spin. Roughly half of the known stellar BHs have a dynamically-determined mass. The measured masses range from [28, 32, 22, 47]. Meanwhile, estimates of spin have been obtained for many of them during the past decade, principally by modeling either the thermal continuum emission of the accretion disk [52, 23, e.g.;], or the relativistically-broadened reflection spectrum [7, 34, e.g.;].
Our focus is primarily on transient BH systems that cycle between a minuscule fraction of the Eddington limit upward to the limit itself. During an outburst, a transient BH progresses through a sequence of spectral-timing states, which are broadly termed “hard” or “soft,” based on a measure of X-ray hardness [9]. As a source evolves over the course of months and its hardness varies, sweeping changes occur in many properties of the system including the composition of its spectrum, the intensity of Fourier flicker noise, and the presence or absence of quasi-periodic oscillations and jets [18, 33, 16, e.g.;].
Stellar BHs emit a complex multicomponent X-ray spectrum. A thermal blackbody-like component is produced in the very inner accretion disk. The disk is truncated at a radius before reaching the event horizon. A hard power-law component results from Compton scattering of the thermal disk photons in hot coronal gas that veils the disk. The third principal component is a reflection spectrum generated by illumination of the cold disk ( keV) by the power-law component. The reflection component is a rich mix of radiative recombination continua, absorption edges and fluorescent lines [37, 12]. An analysis of these three interacting spectral components provides constraints on the source properties including geometry (e.g., on and the scale of the corona). The relationships between these components across the full range of behavior displayed by accreting stellar BHs is the focus of this paper.
Our results are based on an analysis for 29 stellar BHs (10 dynamically-confirmed BHs and 19 BH candidates) of all the data collected using RXTE’s prime detector unit (PCU-2), some 15,000 spectra in all, with a total net exposure time of 30 Ms. Importantly, we recalibrate the data using our tool pcacorr, which greatly reduces the level of systematic error [13]. Given the scope of our study, relativistic reflection models are too complex and computationally slow for our purposes [38, 11, e.g.; reflionx, xillver, relxill;]. We therefore employ a simplistic, phenomenological model and estimate the strength of the reflection spectrum by determining the equivalent width with respect to the Compton continuum of its most prominent reflection feature, namely the keV Fe-K line.
The paper is organized as follows: In Section II we describe the data sample and our approach to modeling the data. Our results are presented in Section III, followed by a discussion in Section IV and our conclusions in Section V.
II. Data
The RXTE archive provides the premier database for the synoptic study of stellar BHs. We exclusively use the data collected by PCU-2, one of the five proportional counter detectors that comprise RXTE’s principal instrument, the Proportional Counter Array (PCA). Throughout the mission, PCU-2 was the unit that was most often active, and it had the most reliable and stable calibration [20, 40]. Its area and energy resolution were 1300 cm2 and % at 6 keV. Table 1 summarizes our data sample.
During an outburst, a BH was typically observed daily over a period of months as it systematically brightened and subsequently dimmed by orders of magnitude. We homogenized the data by segmenting it into continuous 300–5000 s intervals, each of which was used to produce an energy spectrum and a power-density spectrum (PDS). Energy spectra were analyzed ignoring the lowest 4 channels, an effective lower bound keV, and an upper bound of 45 keV was adopted. The effects of detector dead time were corrected as described in McClintock et al. [25]. We obtained an absolute calibration of the flux using the the standard Toor & Seward [46] spectrum of the Crab Nebula; our slope and normalization corrections are and [42]. We computed the rms power, a measure of the flicker noise, by integrating the PDS over the band 0.1–10 Hz.
An unprecedented sensitivity to faint spectral features is achieved by employing the calibration tool pcacorr [13], which improves the quality of the PCA’s spectral calibration by roughly an order of magnitude and results in a data precision of . We include this small systematic uncertainty as a fractional error on each channel when conducting our analysis using XSPEC [1]. The considerable increase in sensitivity pcacorr delivers is crucial for estimating the strength of line features.
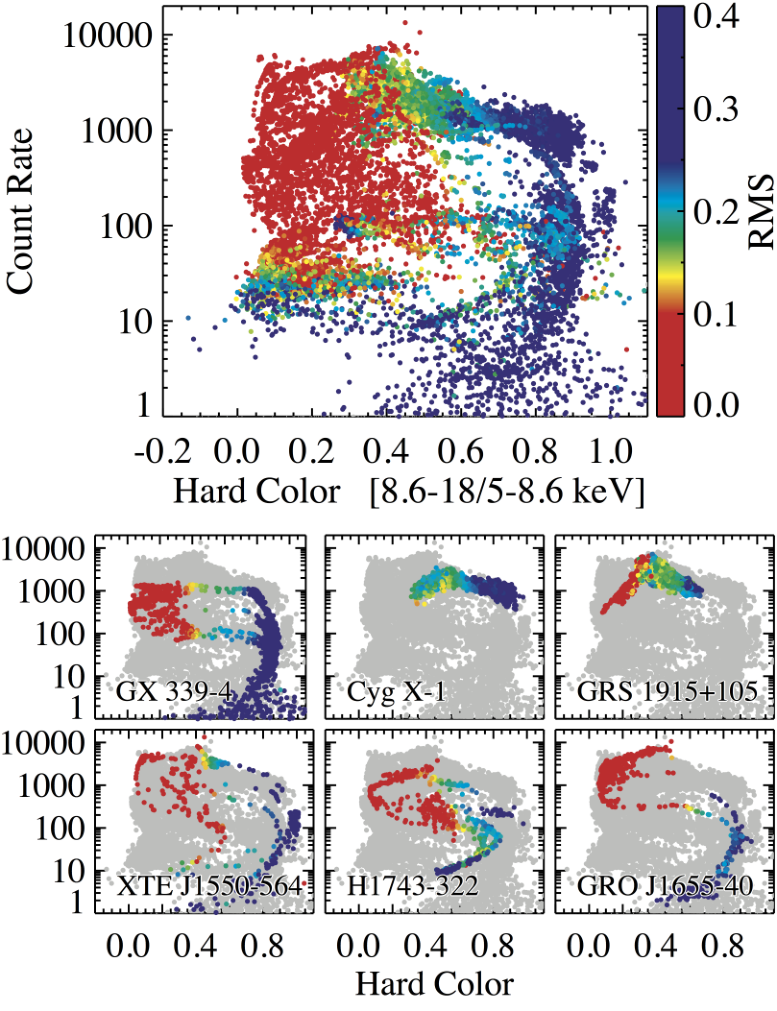
All PCU-2 data for 29 black holes are plotted in a hardness-intensity diagram (HID) [9, 33] in the top panel of Figure 1. The normalized hard color (or hardness ratio ) is the ratio of count rates in the energy bands indicated in the upper panel, and is described in Peris et al. [29]. The data are color-coded to show the level of rms flicker noise. As is well-known and is evident here from the vertical striation, rms noise correlates with spectral state [16, 33, e.g.;], with hard states showing several-times stronger rms than soft states. The six small panels are HIDs for selected sources. Note that transient sources characteristically trace a loop in the hardness-intensity diagram (HID), but that the persistent source Cyg X–1 is confined to a relatively narrow region. The other selected source showing stunted HID evolution is GRS 1915+105, which is an unusual transient system that has been in a protracted state of outburst since 1992.
II.1. Spectral Modeling
We adopt a single simplistic spectral model that is applicable to both soft and hard spectra: phabs*[smedge(simpldiskbb)+gauss]. The disk and Compton components are modeled by diskbb [26], and simpl [43], respectively. The reflection component is described by a Gaussian line with fixed energy of 6.5 keV and an intrinsic width of 50 eV. We note that owing to the broad detector resolution at the Fe line keV, the value adopted for the line width in our simplistic model is of minor consequence (as demonstrated in Section IV). Despite its coarse resolution, RXTE is very sensitive to the line flux, as measured by the normalization of the Gaussian feature. Accordingly, we adopt the line flux as our proxy for the intensity of the reflection component. We approximate the relativistically-broadened Fe-K absorption edge using smedge [6]; we fit for the peak depth with the width fixed at 7 keV and the shape index set to -2.67 [41]. Our adopted values of the column density are summarized in Table 1.


III. Results
We have fitted all spectra with our model. In Figure 2, results are shown for approximately one-quarter of these spectra, those that meet three criteria: ; Fe-line normalization significant at the level; and power-law normalization significant at the level. Plotted in the top panel is Gaussian line flux versus the Compton power law flux near the Fe edge computed by integrating the power-law component from 7–8 keV. Since the fluorescent Fe K line is produced preferentially by photons at energies above and near the Fe K edge [35], i.e., at energies keV [21], it is not surprising that the line and continuum fluxes are strongly correlated. Though notably, this strong correlation is a direct validation of the reflection paradigm (wherein power-law emission fluoresces strong line emission). What is surprising is that the soft states (red) appear to be much more efficient at producing reflection than hard states (blue), as evidenced by the vertical offset between the clouds of soft and hard data.
This result runs counter to the conventional view that reflection is weak in soft states (e.g., Ross & Fabian 39, Yuan & Narayan 49, but see the correlation between spectral index and reflection strength in Zdziarski et al. 51, and related work), a view based on the weakness of reflection relative to the thermal disk component. Here instead, we appropriately relate the strength of the reflection signal to the power-law component that produces it, as isolated from the evolving thermal disk.
In the lower panel of Figure 2, we plot (versus the hardness ratio ) our proxy for the strength of reflection: i.e., we plot the equivalent width () of the line with respect to the coronal flux. That reflection is more pronounced for soft states is readily apparent. In soft states, decreases regularly by an order of magnitude as the spectrum hardens; then, for intermediate and hard states it plateaus at . Given the inhomogeneity of our data sample, which includes both transient and persistent sources, the ordered quality of these data is striking.
| System | RA | Dec | (ks) | PCU-2 Counts () | Reference | ||
|---|---|---|---|---|---|---|---|
| LMC X-3 | 05 38 56.3 | -64 05 03 | 704 | 1203.95 | 33.5 | 0.04 | [1] |
| LMC X-1 | 05 39 38.8 | -69 44 36 | 1598 | 3120.72 | 106.4 | 0.7 | [2] |
| XTE J1118+480 | 11 18 10.8 | +48 02 13 | 124 | 220.93 | 15.7 | 0.01 | [3] |
| GS 1354-64 | 13 58 09.9 | -64 44 05 | 23 | 54.46 | 6.2 | 2 | [4] |
| 4U 1543-47 | 15 47 08.6 | -47 40 10 | 130 | 243.26 | 278.2 | 0.4 | [3] |
| XTE J1550-564 | 15 50 58.8 | -56 28 35 | 517 | 970.78 | 1875.6 | 0.8 | [5] |
| 4U 1630-47aaFor 76 observations the source was offset in the 1-deg FWHM collimator by degrees, which significantly reduced the count rate. No other source has more than several pointings offset by degrees. | 16 34 01.6 | -47 23 35 | 1194 | 2108.10 | 1034.0 | 11 | [6] |
| XTE J1650-500 | 16 50 01.0 | -49 57 44 | 195 | 337.28 | 119.5 | 0.5 | [3] |
| XTE J1652-453 | 16 52 20.3 | -45 20 40 | 61 | 99.84 | 9.2 | 6.7 | [7] |
| GRO J1655-40 | 16 54 00.1 | -39 50 45 | 987 | 2483.87 | 5174.2 | 0.7 | [3] |
| MAXI J1659-152 | 16 59 01.7 | -15 15 29 | 71 | 146.64 | 66.7 | 0.25 | [8] |
| GX 339-4 | 17 02 49.4 | -48 47 23 | 1672 | 2868.46 | 894.2 | 0.3 | [9] |
| IGR J17091-3624 | 17 09 08 | -36 24.4 | 256 | 479.60 | 46.8 | 1.2 | [10] |
| XTE J1720-318 | 17 19 59.0 | -31 45 01 | 122 | 283.36 | 80.7 | 1.3 | [4] |
| GRS 1739-278 | 17 42 40.0 | -27 44 53 | 12 | 26.45 | 15.2 | 3.7 | [4] |
| H1743-322 | 17 46 15.6 | -32 14 01 | 649 | 1403.18 | 958.5 | 2.2 | [11] |
| XTE J1748-288 | 17 48 05.1 | -28 28 26 | 39 | 98.58 | 46.6 | 7.5 | [4] |
| SLX 1746-331 | 17 49 48.3 | -33 12 26 | 78 | 186.19 | 36.2 | 0.4 | [3] |
| XTE J1752-223 | 17 52 15.1 | -22 20 33 | 234 | 435.52 | 147.0 | 0.6 | [12] |
| Swift J1753.5-0127 | 17 53 28.3 | -01 27 06 | 376 | 853.95 | 123.4 | 0.15 | [3] |
| XTE J1817-330 | 18 17 43.5 | -33 01 08 | 191 | 430.11 | 270.7 | 0.15 | [4] |
| XTE J1818-245 | 18 18 24.4 | -24 32 18 | 56 | 141.74 | 19.7 | 0.5 | [13] |
| V4641 Sgr | 18 19 21.6 | -25 24 26 | 94 | 179.57 | 3.0 | 0.25 | [3] |
| MAXI J1836-194 | 18 35 43.4 | -19 19 12 | 76 | 124.83 | 9.4 | 0.15 | [3] |
| XTE J1859+226 | 18 58 41.6 | +22 39 29 | 170 | 336.24 | 270.3 | 0.2 | [14] |
| GRS 1915+105 | 19 15 11.6 | +10 56 45 | 2566 | 5255.58 | 12520.1 | 6 | [15] |
| Cyg X-1 | 19 58 21.7 | +35 12 06 | 2446 | 5413.02 | 6361.3 | 0.7 | [3] |
| 4U 1957+115 | 19 59 24.2 | +11 42 32 | 243 | 646.42 | 41.0 | 0.15 | [3] |
| XTE J2012+381 | 20 12 37.7 | +38 11 01 | 30 | 53.98 | 13.5 | 1.3 | [4] |
| Total | 14914 | 30207. | 30577. |
Note. — References: [1] Steiner et al. 42; [2] Gou et al. 15; [3] Dickey & Lockman 4; [4] Dunn et al. 5; [5] Steiner et al. 44; [6] Tomsick et al. 45; [7] Hiemstra et al. 17; [8] Yamaoka et al. 48; [9] Hynes et al. 19;z [10] Rodriguez et al. 36; [11] McClintock et al. 24; [12] Nakahira et al. 27; [13] Cadolle Bel et al. 2; [14] Farinelli et al. 8; [15] Feroci et al. 10
III.1. A Case Study in Reflection: XTE J1550–564
To more precisely study the behavior of reflection in soft spectral states, we examine one system in detail. We select an exceptionally bright transient with abundant data: XTE J1550–564 (hereafter, J1550; see the bottom-left subpanel of Fig. 1). J1550 was discovered on 1998 September 6, and two weeks later it reached a peak intensity of 6.8 Crab (2–10 keV). Four additional fainter outbursts were observed during the following decade.
We define as the cut between soft and hard-state data, and we again (as in Figure 2) examine the relationship between our proxy for reflection (namely the flux in the Fe K line) and the flux in the adjacent Compton continuum. The data are plotted in Figure 3. We begin with a simplistic assumption that the coronal flux and Fe line flux will scale together, i.e., , and we proceed to fit for and . This scaling relation is termed SR-PL to emphasize that the line flux scales with the power law. We likewise pursue the SR-PL fit for hard spectra (i.e., ), with the constants of soft and hard data determined independently.
For the soft data, we additionally investigate the possibility that disk self-irradiation may also contribute to the reflection emission. This is a motivated notion given that bright soft-states can produce appreciable thermal emission even above 5 keV, and further, some fraction of the thermal photons (the “returning radiation”) is bent back and strikes the disk rather than escaping to infinity. We consider returning radiation by allowing for an added scaling with the disk’s emission in the same 7–8 keV band proximate to the Fe-K edge, i.e., (this is the SR-PL&D scaling relation), and we likewise fit for its parameters.
In the top panel of Figure 3, we show the Compton component’s contribution to the Fe-line flux for both the SR-PL (red) and SR-PL&D (green) fits. The contribution to the line flux from returning radiation is vanishingly small, particularly at the highest luminosities. In the same figure, for reference we also show the SR-PL fit to the hard data in blue. Note that the error bounds for both soft-data fits lie well above the hard correlation bounds.
The best-fitting scale indexes and 1 errors are , , and , . The SR-PL&D fit slightly outperformed the SR-PL fit ( for 2 added degrees of freedom).
Having established that the effects of returning radiation are minor, we focus on comparing reflection for soft and hard data using solely the SR-PL curves. We produce Markov-Chain Monte Carlo realizations for both the hard and soft SR-PL correlations (top panel, Figure 3), and we compare their respective Fe-line fluxes. The results are shown in the bottom panel of Figure 3. On average, the Fe line is times stronger for soft data, while the 95% confidence region ranges from times stronger.

IV. Discussion
As illustrated in Figure 3, our estimate of the ratio of the Fe-line flux in soft and hard states is only modestly sensitive to the values we adopted for the line energy (6.5 keV) and width (50 eV). Varying these values does not affect our conclusions. We have also explored other model formulations (e.g., including a power-law cutoff and replacing the Gaussian by a relativistic line profile) and have similarly found that our conclusions are unaffected. Varying the line shape systematically rescales the line flux, but it has a minor affect on the ratio of the fluxes in soft and hard states, which is our focus.
Consideration of two shortcomings of our simplistic model serve to strengthen our conclusion that soft states are more efficient in producing reflection emission. First, soft-state disks are hotter and more strongly ionized, and hence they generally produce more reflection continuum emission, which gets lumped together with the Compton power law. In the case of our simple model, this effect serves to boost the power-law continuum, thereby reducing for the soft state. Secondly, Fe-line absorption features in disk winds are preferentially and often observed in soft states [31], and these absorption features act to weaken the emission line. Our finding of enhanced in soft states is thus contrary to these biases.
Earlier work by Petrucci et al. [30] which examined the effect of Comptonizing reflection spectra showed that at a fixed value of , the fitted Fe-K equivalent width is very sensitive to the coronal temperature , principally because as decreases, optical depth necessarily increases (a straightforward consequence of the equations governing thermal Comptonization). Accordingly, at high optical depth, the line is highly scattered in the corona. The scattered portion blends with the continuum, which results in a decrease in the Gaussian’s equivalent width. We have examined the evolution of equivalent width versus spectral hardness (changing ) and other spectral parameters. There is a strong anti-correlation between and in precisely the sense predicted by Petrucci et al. [30], and is the most apparent explanation for the observed trend. This is shown in Figure 4.

Alternatively, or in addition to the dilution of the line by Compton scattering in the corona, changes in the disk-coronal geometry can impact the reflection’s strength. In particular, a corona at very small scale-height () coupled with a close-in disk yields a higher reflection fraction than when either (1) the disk is truncated or (2) the corona is very large compared to the event horizon [3]. Gradual evolution of accretion flow with more compact disk-coronal geometry (i.e., lower ) in soft states would similarly contribute to the observed correlation.
We caution that the role of ionization is complex and varies nonlinearly as other coronal attributes change, including most notably, . These differences are principally related to changes in the atmosphere’s temperature structure. For the range of ionization parameters observed around active stellar-mass BHs, i.e., log , we simulated PCU-2 data using the xillver reflection model [12], and applied our analysis method. We found that varies by a factor of over the span of () and ; this is insufficient to account for the full trend in Figure 2. Moreover, for log , higher tends to produce lower whereas at log , the trend reverses.
As summarized by Zdziarski et al. [50], and also Gilfanov & Merloni [14], there is abundant evidence for a strong positive correlation between spectral index and reflection strength (the “” correlation). This has been seen in both BH X-ray binaries and in AGN. However, such work has been largely confined to examination of hard states. To our knowledge, our work is the first compelling evidence that the correlation between spectral softness (increasing ) and reflection fraction continues and is strongly amplified in soft, thermal states (i.e., ). Further, from considering the RXTE archive of active BHs, as is readily apparent in Figure 2, this change is gradual and orderly amongst the full cast of stellar BHs.
V. Conclusions
We have examined the strength of reflection in a global study of stellar BHs using a simplistic, phenomenological spectral model. We directly validate the reflection paradigm, wherein power-law flux induces reflection emission. In separating possible contribution from disk self-irradiation, we demonstrate that the power law’s contribution is dominant.
Most importantly, we show that the corona produces reflection features up to an order of magnitude more pronounced in soft rather than hard states. The data suggest an ordered transition in which the line-to-continuum strength declines gradually with spectral hardness. This is the first time the “” correlation has been shown to extend through (and increase in) BH soft states. One possible explanation is that a more compact disk-coronal geometry in soft states would produce the observed trend. However, the most natural explanation for this trend is suggested by Petrucci et al. [30], who describe the dilution of line features emitted by the disk due to Compton-scattering in the corona. In our case, because hard states have corona with higher optical depth than soft states, their line features are correspondingly weakened resulting in the observed anti-correlation between and reflection strength.
Facility: RXTE
References
- [1] Arnaud, K. A. 1996, in Astronomical Society of the Pacific Conference Series, Vol. 101, Astronomical Data Analysis Software and Systems V, ed. G. H. Jacoby & J. Barnes, 17
- [2] Cadolle Bel, M., et al. 2009, A&A, 501, 1
- [3] Dauser, T., García, J., Parker, M. L., Fabian, A. C., & Wilms, J. 2014, MNRAS, 444, L100
- [4] Dickey, J. M., & Lockman, F. J. 1990, ARA&A, 28, 215
- [5] Dunn, R. J. H., Fender, R. P., Körding, E. G., Belloni, T., & Cabanac, C. 2010, MNRAS, 403, 61
- [6] Ebisawa, K., et al. 1994, PASJ, 46, 375
- [7] Fabian, A. C., Rees, M. J., Stella, L., & White, N. E. 1989, MNRAS, 238, 729
- [8] Farinelli, R., et al. 2013, MNRAS, 428, 3295
- [9] Fender, R. P., Belloni, T. M., & Gallo, E. 2004, MNRAS, 355, 1105
- [10] Feroci, M., Matt, G., Pooley, G., Costa, E., Tavani, M., & Belloni, T. 1999, A&A, 351, 985
- [11] García, J., et al. 2014a, ApJ, 782, 76
- [12] García, J., & Kallman, T. R. 2010, ApJ, 718, 695
- [13] García, J. A., McClintock, J. E., Steiner, J. F., Remillard, R. A., & Grinberg, V. 2014b, ApJ, 794, 73
- [14] Gilfanov, M., & Merloni, A. 2014, Space Sci. Rev., 183, 121
- [15] Gou, L. J., et al. 2009, ApJ, 701, 1076
- [16] Heil, L. M., Uttley, P., & Klein-Wolt, M. 2015, MNRAS, 448, 3339
- [17] Hiemstra, B., Méndez, M., Done, C., Díaz Trigo, M., Altamirano, D., & Casella, P. 2011, MNRAS, 411, 137
- [18] Homan, J., & Belloni, T. 2005, Ap&SS, 300, 107
- [19] Hynes, R. I., Steeghs, D., Casares, J., Charles, P. A., & O’Brien, K. 2004, ApJ, 609, 317
- [20] Jahoda, K., Markwardt, C. B., Radeva, Y., Rots, A. H., Stark, M. J., Swank, J. H., Strohmayer, T. E., & Zhang, W. 2006, ApJS, 163, 401
- [21] Kallman, T. R., Palmeri, P., Bautista, M. A., Mendoza, C., & Krolik, J. H. 2004, ApJS, 155, 675
- [22] Laycock, S. G. T., Cappallo, R. C., & Moro, M. J. 2015, MNRAS, 446, 1399
- [23] McClintock, J. E., Narayan, R., & Steiner, J. F. 2014, Space Sci. Rev., 183, 295
- [24] McClintock, J. E., Remillard, R. A., Rupen, M. P., Torres, M. A. P., Steeghs, D., Levine, A. M., & Orosz, J. A. 2009, ApJ, 698, 1398
- [25] McClintock, J. E., Shafee, R., Narayan, R., Remillard, R. A., Davis, S. W., & Li, L.-X. 2006, ApJ, 652, 518
- [26] Mitsuda, K., et al. 1984, PASJ, 36, 741
- [27] Nakahira, S., et al. 2012, PASJ, 64
- [28] Özel, F., Psaltis, D., Narayan, R., & McClintock, J. E. 2010, ApJ, 725, 1918
- [29] Peris, C. S., Remillard, R. A., Steiner, J. F., Vrtilek, S. D., Varnière, P., Rodriguez, J., & Pooley, G. 2016, ApJ, 822, 60
- [30] Petrucci, P. O., Merloni, A., Fabian, A., Haardt, F., & Gallo, E. 2001, MNRAS, 328, 501
- [31] Ponti, G., Fender, R. P., Begelman, M. C., Dunn, R. J. H., Neilsen, J., & Coriat, M. 2012, MNRAS, 422, 11
- [32] Reid, M. J., McClintock, J. E., Steiner, J. F., Steeghs, D., Remillard, R. A., Dhawan, V., & Narayan, R. 2014, ApJ, 796, 2
- [33] Remillard, R. A., & McClintock, J. E. 2006, ARA&A, 44, 49
- [34] Reynolds, C. S. 2014, Space Sci. Rev., 183, 277
- [35] Reynolds, C. S., Fabian, A. C., Brenneman, L. W., Miniutti, G., Uttley, P., & Gallo, L. C. 2009, MNRAS, 397, L21
- [36] Rodriguez, J., Corbel, S., Caballero, I., Tomsick, J. A., Tzioumis, T., Paizis, A., Cadolle Bel, M., & Kuulkers, E. 2011, A&A, 533, L4
- [37] Ross, R. R., & Fabian, A. C. 1993, MNRAS, 261, 74
- [38] —. 2005, MNRAS, 358, 211
- [39] —. 2007, MNRAS, 381, 1697
- [40] Shaposhnikov, N., Jahoda, K., Markwardt, C., Swank, J., & Strohmayer, T. 2012, ApJ, 757, 159
- [41] Sobczak, G. J., McClintock, J. E., Remillard, R. A., Cui, W., Levine, A. M., Morgan, E. H., Orosz, J. A., & Bailyn, C. D. 2000, ApJ, 544, 993
- [42] Steiner, J. F., McClintock, J. E., Remillard, R. A., Gou, L., Yamada, S., & Narayan, R. 2010, ApJ, 718, L117
- [43] Steiner, J. F., Narayan, R., McClintock, J. E., & Ebisawa, K. 2009, PASP, 121, 1279
- [44] Steiner, J. F., et al. 2011, MNRAS, 416, 941
- [45] Tomsick, J. A., Corbel, S., Goldwurm, A., & Kaaret, P. 2005, ApJ, 630, 413
- [46] Toor, A., & Seward, F. D. 1974, AJ, 79, 995
- [47] Wu, J., Orosz, J. A., McClintock, J. E., Hasan, I., Bailyn, C. D., Gou, L., & Chen, Z. 2016, ApJ, 825, 46
- [48] Yamaoka, K., et al. 2012, PASJ, 64
- [49] Yuan, F., & Narayan, R. 2014, ARA&A, 52, 529
- [50] Zdziarski, A. A., Lubiński, P., Gilfanov, M., & Revnivtsev, M. 2003, MNRAS, 342, 355
- [51] Zdziarski, A. A., Lubiński, P., & Smith, D. A. 1999, MNRAS, 303, L11
- [52] Zhang, S. N., Cui, W., & Chen, W. 1997, ApJ, 482, L155+