Probing -state configurations in URu2Si2 with U -edge resonant x-ray emission spectroscopy
Abstract
Resonant x-ray emission spectroscopy (RXES) was employed at the U absorption edge and the emission line to explore the occupancy, , and the degree of orbital delocalization in the hidden order compound URu2Si2. By comparing to suitable reference materials such as UF4, UCd11, and -U, we conclude that the orbital in URu2Si2 is at least partially delocalized with , and does not change with temperature down to 10 K within the estimated error. These results place further constraints on theoretical explanations of the hidden order, especially those requiring a localized ground state.
pacs
71.27.+a, 78.70.Dm, 78.70.En, 75.20.HrI Introduction
It has often been said that the most interesting physics occurs when competing interactions are of nearly the same magnitude. Such a situation is surely occurring at URu2Si2’s so-called “hidden-order transition” (HO), which is a second-order phase transition at 17.5 K with a large (, where is the universal gas constant) change in entropy that has nevertheless so far defied attempts to identify its order parameter. [1, 2, 3] Despite this conundrum being identified in the late 1980s and the fact that the HO transition presages a 1.5 K superconducting transition, the identification of the HO order parameter remains elusive, although progress has been steady since that time and URu2Si2 remains an important research subject today.[4] Much of the recent work has been spurred by new innovative theories and concomitant improvements to experiments made possible both by better capabilities and single crystals. An important dividing line between the different theories of HO focuses on the nature of the orbital, specifically, the -orbital occupancy, , and the degree of itinerancy.[5] Various spectroscopic measurements of these quantities have been performed, without a clear consensus. In an effort to clarify the role of and localization, the work described below provides measures of both and the degree of -orbital localization using resonant x-ray emission spectroscopy (RXES) at the U absorption edge and U emission line.
The history of theoretical work describing HO in URu2Si2 is vast.[6, 5] For this short introduction, we only focus on some specific aspects. Some of the earliest theories relied on the existence of a localized , configuration to generate certain crystalline electric field (CEF) symmetries. Although CEF signatures have never been definitively observed, some recent innovative work once more depends on their existence,[7, 8, 9, 10, 11, 12] while other work focuses on an itinerant model of the electrons starting from a partially occupied orbital.[13, 14] The DFT+DMFT calculations may form an interesting intermediate starting point, assigning the CEF states to the shell and itinerant states to the shell.[12, 15, 16]
Experimental investigations are similarly divided in their interpretations. For instance, neutron scattering results show that a spin excitation gap can explain the change in the specific heat at 17.5 K, but is not consistent with localized physics.[17] Likewise, recent NMR experiments looking at Knight shift anomalies are modeled such that the HO emerges directly from a Kondo liquid state, and is thus not associated with localized moments.[18] In addition, neutron scattering has not definitively observed any CEF states.[19] On the other hand, thermal conductivity measurements indicate a transition from itinerant to localized behavior in the HO state.[20] Other indications of at least a partially localized configuration exist, together with indications of dynamical CEF excitations.[21] In addition, recent experiments highlight the possible importance of symmetry changes. For instance, cyclotron resonance measurements show an anomalous splitting of the sharpest resonance line under in-plane magnetic field rotation, likely caused by the fourfold rotation symmetry of the tetragonal lattice being broken by domain formation, and consistent with the suggestion that there is a nematic Fermi liquid state (where itinerant electrons have unidirectional correlations).[22] This result is supported by high-resolution synchrotron x-ray diffraction results.[23] Other measurements indicating possible tetragonal symmetry breaking in the HO state include a recent measurement of a long-lived low energy excited-state chirality density wave with symmetry from Raman spectroscopy,[15] consistent with inelastic neutron scattering anisotropy results.[24] However, this conclusion remains controversial; for instance, recent inelastic neutron results show no indications of reduced spatial symmetry,[19] raising the possibility that such symmetry breaking only happens in the smaller samples less suitable for neutron experiments. Moreover, comparisons of the DC magnetic susceptibility of a system thought to possess a tetravalent singlet crystal field ground state similar to that proposed for URu2Si2 show little resemblance.[25]
Ultimately, determining specific and quantitative details about and itinerancy require spectroscopic measurements. Photoemission (both angle-integrated and angle-resolved) results generally favor delocalized states and paint a very interesting picture of the details of the Fermi surface.[26] In particular, the larger features in the band structure and Fermi surface of URu2Si2 measured by soft x-ray photoemission in the paramagnetic (PM) state above the HO transition are well explained by treating all of the U electrons as itinerant with .[27] Furthermore, these photoemission experiments indicate a large electron-like sheet around the point, with smaller hole-like structures forming around the point.[27] It is important to note, however, that not all features in photoemission are well described by LDA calculations. For instance, some indications of an contribution have also been observed in core-level and valence-band photoemission that are otherwise indicating a close to ground state.[28] In addition, changes in the HO phase include a Fermi surface restructuring[29] involving folding along and gapping along the directions.[30]
Although the photoemission experiments have provided valuable insight into the electronic structure of URu2Si2, they are limited by surface-sensitivity concerns and by having to compare to calculations in order to determine a value for .[26] One technique that is less sensitive to the exact electronic details is electron energy-loss spectroscopy (EELS). EELS experiments suggest that URu2Si2 has states which are more localized than -U (even at room temperature), but still not completely localized, with a electron count suggesting a mixed valence ground state and/or some -electron itinerancy.[31] However, other interpretations question the usefulness of EELS in this respect in uranium compounds,[32] implying that further support is needed. In addition, the degree of surface sensitivity in this electron spectroscopy technique remains a concern.
Photon-in/photon-out techniques are inherently less surface sensitive, although a soft x-ray experiment of this type is much more surface sensitive than a hard x-ray experiment. A recent edge x-ray absorption spectroscopy (XAS) measurement, combined with resonant inelastic scattering (RIXS) and including polarization dependence,[21] concludes that only features derived from an () ground state are clearly observed; however, it is noted that features could be obscured by itinerancy, which has not yet been considered with experimental model compounds. The measurements observed only short-lived ( eV) CEF modes, and found that these could account for most or all of the CEF excitation intensity expected in an multiplet picture. Taken together, although features associated with the atomic multiplet ground state () are clearly observed, the total occupancy is not determined by these data. Likewise, the large inverse lifetime of CEF excitations (0.1 eV ) implies that electronic itinerancy cannot be dismissed as a perturbative factor.
An independent, truly bulk-sensitive method for determining is clearly highly desirable. U RXES should be able to provide such an independent measure of , while potentially also drawing a distinction between a Kondo-like, mixed valence mechanism and a -band interpretation, but there are challenges. The technique involves measuring the U x-ray emission as a function of energy using a high resolution spectrometer while sweeping the incident x-ray energy just above and below the U absorption edge. The average depth of an emitting photon above the photoelectron threshold energy is about 1.9 m,[33] and is deeper below the threshold where much of the data and analysis occur. The resulting spectral broadening is dominated by the final-state 3 core hole lifetime, and hence provides a higher resolution measure of the unoccupied 6 states near the Fermi energy, , than a conventional -edge x-ray absorption near-edge structure (XANES) experiment, which is dominated by the shorter-lived core hole. Either RXES or XANES experiments can potentially differentiate between a localized mixed valence state and a simple partially-filled band if the Coulomb interaction between the core hole and the -electrons is strong enough to break the mixed valence state into its configurations with different numbers of -electrons.[34] In a typical Yb intermetallic, for instance, the Coulomb interaction splits the state into and configurations, which screen the outgoing photoelectron differently, resulting in two distinct features in the 2-5 absorption spectrum that are about 10 eV apart.[35, 36] Such splitting in uranium should be approximately the same as observed between valence states, which is on the order of eV based on studies of various oxide materials.[37, 38] On the other hand, if the -electrons are more delocalized, an overall shift of the main absorption feature may occur instead of split features, since the Coulomb interaction may then be of insufficient strength. These complications need to be considered when analyzing either XANES or RXES U spectra.
A further complication can occur in the presence of strong ligand fields, where splitting can occur between and states in the manifold. If this splitting approaches the eV expected between valence states in U, then deconvolving ligand-field splitting and intermediate valence effects may not be possible. However, one expects that such ligand-field splitting should be relatively small in an intermetallic compound like URu2Si2 compared to a more bonded system like UO2.
In consideration of these effects, the rest of this paper is organized as follows: After a description of the Experimental Details, RXES results from UO2 and UF4 will be compared to those from UCd11 as examples of standard materials exhibiting various degrees of localized behavior, ligand-field splitting in the manifold, and both and spectroscopic features. Subsequently, results from URu2Si2 will be presented and considered in light of potential localized/delocalized behavior and ligand-field splitting.
II Experimental details and methods
A single crystal of URu2Si2 was grown by the Czochralski technique and subsequently electro-refined. Two samples were cleaved from this crystal. Such cleaves routinely yielded high-purity crystals with residual resistivity ratios RRR = (300 K)/(0 K) between 200-400, where (0) was obtained from a power law fit to the electrical resistivity of the form at low temperatures. The RRRs for these specific cleaved samples for the RXES experiments were not measured. While each sample was chosen for the spectroscopic measurements to have an optically flat portion for easy sample alignment, after preliminary measurements, a single sample was chosen for the measurements presented here.
RXES data were collected during two experimental runs about one year apart at the Stanford Synchrotron Radiation Lightsource (SSRL) wiggler beamline 6-2 using a LN2-cooled Si (311) double monochromator calibrated so that the inflection point of the Zr -edge absorption from a Zr reference foil was at 17998.0 eV. The emission was measured using a seven-crystal Ge(777) Johann-type x-ray emission spectrometer,[39] at an emission energy, , of approximately 13.6 keV, corresponding to the U emission. The emission spectrometer energy was calibrated using the direct scatter from a polycarbonate film with the incident energy, , set to the first inflection point of the absorption at the Au edge from a Au reference foil (13734 eV). The total emission energy resolution (including the incident beam) was measured to be 1.4 eV.
At these energies, the information depth of the x-rays is greater than 1.9 m,[33] so these measurements are truly bulk sensitive. The sample was visibly shiny for both experimental runs, and no particular care was taken to avoid surface oxidation.
The sample of URu2Si2 was placed with its surface normal at a 45∘ angle with respect to the incoming beam. Data were collected at 10, 15, 20, 22, 50, 90, and 300 K using a LHe-flow cryostat. Owing to the relative thickness of the sample, a self-absorption correction was applied,[40] as well as a dead-time correction.
The RXES emission intensity data, , are fitted with previously published methods[40], using the Kramers-Heisenberg equation of the form:
| (1) |
Here, is the energy transferred to the sample in the final state, is an energy scale corresponding to the energy difference between the ground and intermediate state, is another energy scale corresponding to the energy difference between the intermediate and the final state, is the lineshape broadening due to the finite lifetime of the intermediate state core hole (here, the core hole), and is similarly due to the finite lifetime of the final state core hole (here, the core hole). For a more complete discussion of Eq. 1, please see Refs. 41, 40. In the fits described below, we have chosen to fix and to their nominal values[42] of 8.104 eV and 3.874 eV, respectively, although allowing these parameters to float generally gives results close to these values and does not significantly change the results described below. In these experiments, the ground state includes electrons, the intermediate state has electrons, and the final state has electrons, where the bar indicate a hole. Eq. 1 is simplified assuming the transition matrix elements and in have no off-diagonal terms.
The most important aspect of the fitting is the choice of the local unoccupied density of states . As described in Ref. 40, we allow for three different possible configurations within the ground state:
| (2) |
where give the probability of finding the system in any one configuration . The presence of the core hole in both the intermediate and the final state will interact differently with each configuration, and if this Coulomb interaction is large enough, these states will split.[34] This splitting is reflected in the empty 6 states. As before,[40, 32, 43] we parametrize with a combination of a so-called “peak” Gaussian (each constrained to the same width ) to represent the excitations into the comparatively discrete empty states and a broadened step function (same and the height of the peak Gaussian defined relative to the step height defined to be the ratio) to represent the continuum of unoccupied states. Each potential configuration is then represented by this combination of a Gaussian and the step function. More details with regard to the specific fits are provided below.
III Results
III.1 Calculations and measurements on UF4 and UO2
In order to consider the -orbital occupancy and localization features of URu2Si2, comparisons to standard materials are essential. In this case, the standard materials would ideally be ones with strongly localized -orbitals in the (tetravalent uranium) and (trivalent uranium) configurations. From our previous work,[44, 43] we identified UCd11 as possessing strongly localized electrons and , which is sufficiently close to to act as a good standard.[43] Unfortunately, although there are only a few intermetallics thought to possess a localized configuration, we have not succeeded in obtaining data on sufficiently localized intermetallic samples of this type. Instead, we can rely on data from UF4 as an unquestionably localized material.[32]
High-resolution partial fluorescence yield (PFY) data are shown in Fig. 1 for all measured samples. As indicated, the self-absorption correction was not applied to the data in this figure as a convenient way to accentuate the clear shoulder peak at about 17167 eV in the UF4 spectrum. As is clearly seen, the so-called “white line” (WL) peak in UCd11 is shifted by 7-8 eV relative to that of UF4. The UO2 and URu2Si2 spectra are clearly broader, and the WL peak energy of URu2Si2 is between that of UCd11 and UF4.
There are two features of the standards spectra that can be elucidated with cluster calculations, namely the broadening of the UO2 spectrum and the shoulder feature in the UF4 spectrum. Starting with the UO2 spectrum, we note that in previous work, we have used UO2 as a localized standard, but have recently found it to be a problematic example. UO2 is considered to be a correlated-electron material and a Mott-Hubbard insulator,[45, 46] and as such, it may have a occupancy that deviates from two and even have some direct -band involvement at the Fermi energy. More importantly, the ordered cubic symmetry and octahedral coordination of the U-O nearest neighbors generates a substantial crystal field splitting of the unoccupied states, a situation that is reduced in the more complex monoclinic structure of UF4.


This situation is illustrated by the results in Fig. 2 of a 9 atom cluster calculation of the local density of states using FEFF 9.6.4.[47] In this simplified calculation, we use default FEFF behavior, which includes not allowing for charge transfer out of the orbitals. Three curves are shown. In each calculation, only the first shell of 8 oxygen or fluorine atoms are included along with the absorbing uranium atom. The small cluster size was chosen to emphasize the short-range, ligand-field nature of the and features. The UO2 calculation uses the nominal fluorite structure[48] and the UF4 calculation uses the nominal monoclinic structure.[49] To demonstrate the role of the fluorine atom as opposed to the difference in crystal structure, we also show a calculation on “UF2”, which is really the same calculation on the same structure as the UO2 calculation, except all the oxygen atoms are replaced by fluorine.
A number of features are important to discuss with regard to how UO2 and/or UF4 make a suitable localized U absorption standard. In all three calculations, there is an state, moving from about -7 eV in UO2 (with respect to the vacuum energy) to about -5 eV in UF4. The state is at a somewhat higher energy, all centered at about -2 eV, with the UF4 calculation showing a 1.5 eV split. These calculations therefore demonstrate that the / ligand field splitting is reduced from UO2 as one moves to the more ionic/less covalent “UF2” compound and then further to the less symmetric UF4 compound.
These differences can be seen in the resulting absorption calculations shown in Fig. 3, where we now show the calculations on the “real” UO2 and UF4 structures for comparison to actual data (which now includes the self-absorption correction). These calculations include all atoms within a 6.58 Å radius of the central absorption uranium, and take into account the two uranium sites in the UF4 structure, as noted. The spectra are calculated as -edge absorption spectra but narrowed by 4.2 eV (FWHM) to account for the limiting factor of the core hole instead of the core hole. In addition, charge transfer out of the orbital is allowed (the UNFREEZEF card is employed). In order to obviate the 0.05 % threshold energy errors in FEFF calculations, the calculations are shifted by the amounts indicated in the figure caption so that the WL energies agree with the data.
While one can clearly see the effect of the larger ligand field splitting in the UO2 calculation and the data compared to those of UF4, it is clear that FEFF overestimates the size of this splitting in each case. This overestimate is particularly clear in the UF4 calculation, which shows more weight than the experimental data near 17170 eV, in a region of the spectrum between the shoulder feature at 17167 eV and the main edge.
A fascinating feature of the calculation on UF4 is the difference in between the U(1) and U(2) sites. While bearing in mind that potential errors exist in the determination of , the FEFF calculations show a distinct energy shift in the density of states between the U(1) site and the U(2) site (there are double the number of U(2) sites in the UF4 lattice structure). This shift places the Fermi level within the U(1) density of states, a situation that also occurs, although to a lesser degree, in the UO2 calculation. The significance of this shift is that, according to these calculations, unoccupied spectral weight occurs in the band at or just above , which is accessible to the photoelectron excited from the 2 shell either from a dipole excitation through hybridization with the orbitals or directly through a quadrupole transition, as previously considered for UO2.[50] The position and size of this feature are in very good agreement with the FEFF calculation as shown, which does not include any quadrupole term in the excitation. Including such a term vastly over estimates the size of the feature, possibly due to the weight at the Fermi energy. We therefore tentatively conclude that this feature is primarily due to hybridization, consistent with several photoemission studies.[26]
An interesting issue in these calculations is that the calculated is about 3 eV lower in UO2 than the other calculations. This difference exists in both the small cluster and the 6.58 Å radius calculations. Fermi energy shifts are a common problem in FEFF, but this particular shift may be a reflection of the correlated electron nature of UO2, a quality that FEFF cannot capture. directly affects the photoelectron threshold energy, yet no shift is observed in the experimental data in the white-line position between UO2 and UF4 (Fig. 1). It should therefore be noted that the absorption calculation in Fig. 1(a) is with respect to , rather than with respect to vacuum, in order to make a direct comparison between the calculations and between the calculations and experiment.
The implication of these data and calculations for the purposes of this study is that the ligand field splitting is a complicating factor in the UO2 spectra when using such spectra to model behavior in metals where such splitting will be reduced. In contrast, UF4 appears to be a much better, and less covalent, model for such comparisons. In fact, the ligand field splitting is even less clear in larger cluster calculations of UF4, creating an even sharper absorption white line. Therefore, the combination of more ionic bonding (through the replacement of oxygen with fluorine) and reduced symmetry (which further reduces the ligand field splitting) allows UF4 to be used as a close-to-ideal localized absorption standard material.
III.2 Comparisons between standard materials and URu2Si2
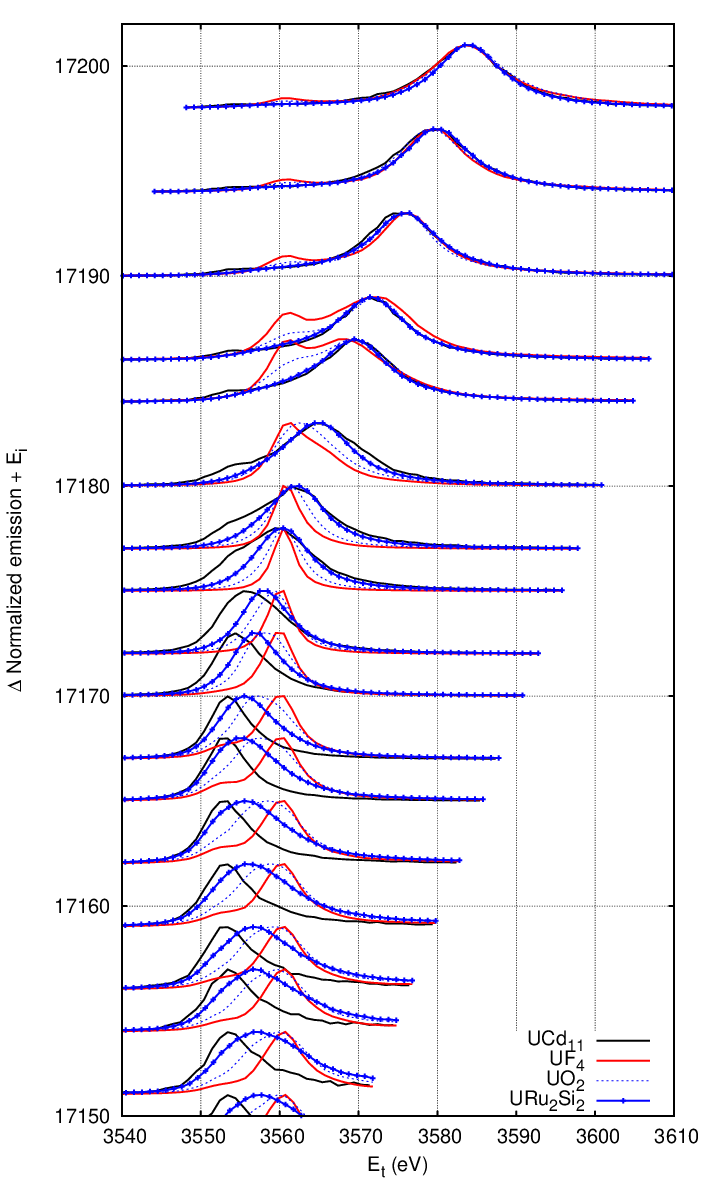

RXES data at 300 K for the standard materials and URu2Si2 are shown in Fig. 4. We begin with a discussion of the features in the various data sets before describing the fit results below. First, comparing the different standard materials, differences are most easily observed and interpreted well below the threshold energy. In this method of presenting the data, the data below threshold are toward the bottom of the plot and the features in such data are at a relatively fixed . It is clear from these data that the UF4 and UCd11 spectra are each relatively sharp in character, while separated by about 7 eV, consistent with, but even larger than, the eV shift expected for a 1 e- difference in their shells (Sec. I). The effect of the ligand field splitting in UO2 is pronounced in these data, with a significantly broader spectrum below threshold. In addition to this broadening, there is a small positional shift of the XES peak (more easily observed at low , which is also rationalized by the ligand field splitting.
The URu2Si2 data fall between the limits defined by the UCd11 and the UF4 data, with a significant amount of spectral weight at both extremes. The lower-energy weight is even more clearly observed as it becomes resonantly enhanced near 17166 eV. It is interesting to compare these URu2Si2 results to those from UO2, since the energy shift toward UCd11 is substantially larger and the spectra are significantly broader compared to those from UO2. Since no large ligand field splitting is expected in the manifold in URu2Si2, it seems very unlikely that it could be larger in URu2Si2 than in UO2.
Given the magnitude of the negative energy shift of the URu2Si2 spectra relative to UF4 (and UO2) is too large to be explained by ligand field splitting, the sign of this shift is significant: Since the XES peak position of UF4 is determined by a localized configuration, the negative comparative shift of the URu2Si2 spectra indicates a more fully screened core hole, which indicates more occupied weight (not less), that is, an component to the wavefunction. These simple comparisons therefore yield one of the main conclusions of the present study: a significant, if not dominant, component to the URu2Si2 wavefunction exists.
In addition, the enhanced width of the URu2Si2 resonance may suggest an intermediate occupancy of the orbital, either due to a partially-filled metallic band, a Kondo-driven intermediate valence effect, or a mixture of both. Unfortunately, unlike data from -Pu[44], or even -U,[43] there are no spectra collected at any of the considered here that show visible indications of multiple contributions to the main XES peaks indicative of mixed valence. For a more quantitative consideration, we turn to the results from the detailed fits.
| Compound | (eV) | (eV) | (eV) | (%) | (%) | (%) | (e-)11 1 As with other parameters, reported errors assume normally distributed errors and these fits are for data at only one temperature. Systematic errors on are thought to approach 0.08. See Fig. 6. | |
|---|---|---|---|---|---|---|---|---|
| UCd11 | 17175.0(1) | 3560.0(1) | 1.9(1) | 3.3(1) | 13.5(7) | 86(1) | 0.1(5) | 2.86(1) |
| UF4 | 17174.3(1) | 3560.3(1) | 1.2(4) | 9 | 100(3) | 0(2) | 0(1) | 2.00(3) |
| UO2 | 17173.9(1) | 3559.8(1) | 1.9(4) | 5.6(2) | 95(2) | 5(1) | 0(1) | 2.05(2) |
| -U | 17176.9(1) | 3562.5(1) | 2.9(4) | 1.5(1) | 46(2) | 54(3) | 0(2) | 2.54(2) |
| URu2Si2 Model #1 | 17178.6(1) | 3564.6(1) | 3.4(1) | 1.7(1) | 0 | 100 | 0 | 3 |
| URu2Si2 Model #2 | 17178.1(2) | 3564.0(2) | 3.1(4) | 2.0(1) | 11(2) | 89(2) | 0.0(5) | 2.89(2) |
Two fit models were considered: Model #1 allows only a single configuration, while Model #2 allows for up to three configurations to exist. The fit results are summarized in Table 1, together with previous results on the standard materials and -U. [43] The fits are both of high quality and the results from each model are not easily discernible. The somewhat higher-quality fit uses Model #2, which is displayed in Fig. 5. While this model is significantly better than Model #1 in a statistical sense, the fits are not visibly very different, and systematic errors (especially due to the line shape) remain the main contribution to the quality-of-fit parameter (proportional to a statistical-). We therefore do not make a judgment here as to which fit model is more appropriate; in Sec. IV we discuss some reasons for favoring Model #2, although the results aren’t very different. Fit methods are described in Ref. 40. In particular, the fits utilize a parametrized where the contribution to each resonance includes a Gaussian peak and an arctan-like function (an integrated pseudo-Voigt). The energy scale is defined here as the excitation energy from the 2 shell into the unoccupied states associated with the configuration. The energy scale is defined similarly. The Model #2 fits assume an intermediate valence model where the Coulomb interaction is sufficient to split the potential , , and configurations, using a fixed energy separation of 7.2 eV as determined previously.[43] Peak assignments (including in Model #1) are assigned relative to the main peak in UF4. See Table 1 for further details.
It is crucial to note that the results in Table 1 are for fits to data collected only at one temperature. Data collected at other temperatures between 10 K and 300 K look very similar, with no clear trend in using the Model #2 constraints (Fig. 6). Note that there is no significant difference between the data collected in the two experimental runs, which were about one year apart, indicating that if any oxidation on the surface is affecting the measurement (that is, artificially giving too much weight), it is stable over this time scale. Taken together, we estimate , including possible % systematic error in the configuration fractions.

IV Discussion
Before discussing the data and their implications for the nature of the states in URu2Si2, we need to draw the distinction between “delocalization” and “itinerancy” as they relate to the RXES technique presented here. This technique is not sensitive to whether given spectroscopic features are associated with a band that cuts across the Fermi energy and typically are described as itinerant. Rather, the technique is sensitive to, as described in Sec.I, how well these electrons screen the core hole as a consequence of the strength of their Coulomb interaction. This interaction is substantial for an orbital strongly localized to the vicinity of the core hole, such as the orbital. A more extended, delocalized orbital, like a orbital or a light-actinide orbital, has a weaker interaction, and may not split the configurations in Eq. 2. The observation of a split peak is therefore a hallmark of a localized orbital (which may still contribute weakly to the conduction band through hybridization and the Kondo effect), but the lack of a split peak only indicates a more extended, delocalized orbital, which may or may not contribute to the Fermi surface. We have therefore endeavored to use the word “itinerant” here only when we are discussing or comparing data to experiments indicating a Fermi surface or a model with one.
Bearing this distinction in mind, there are several useful conclusions to draw by comparing the best fit parameters from the various materials with those of URu2Si2 (Table 1). , as stated above, is arbitrarily set to coincide with the peak position. Unlike in lanthanide systems (or in the limited number of plutonium systems that have been measured), can shift to higher energies if an orbital becomes more delocalized, and thus fails to screen the core hole as effectively. This change in screening is the reason that appropriate standard materials are so important, since the origin of a given feature could be otherwise misinterpreted. Here, we see that the three relatively localized standard materials have very similar s and the sharpest s, with the increased width of UO2 likely due to crystal field splitting of the states.[32] Changes in are linear with , consistent with no significant off-diagonal elements in the transition matrix in this energy range.
It is interesting to compare these data to those from recent results on -U,[43] which should correspond to an itinerant material. The XES spectra of -U shown in Fig. 7 are clearly even a little broader than the URu2Si2 spectra, displaying more indications to the eye of shoulders and other features indicative of multiple configurations. The -U data are, in fact, consistent with a local density of states modeled on two dominant configurations, and , corresponding to an . As expected for an itinerant material, and are significantly higher than for the standard materials (about 3 eV), consistent with a more delocalized orbital.[43]
The most informative fit parameters are those relating to the individual peak width and the relative configuration fractions. The largest peak widths here are for -U and URu2Si2, and as such may be indicative of orbital delocalization due to the distribution of possible Coulomb interactions. A similar situation is observed for Pu intermetallics, where the compounds with the lowest linear coefficient to the electronic specific heat[44] have the largest peak widths[40] (excluding PuO2.06 which likely has an enhanced width due to crystal field splitting of the states).
The comparisons of the data and fit results between URu2Si2, -U, and the standard materials thus strongly favor a large, delocalized component to the ground state of URu2Si2. In particular, the fit using Model #2 over several temperatures (Fig. 6) indicate an of 2.870.08. Unfortunately, as noted in Sec. III, we do not judge the difference between fits with Model #1 (single configuration) and Model #2 (a mixture of , , and configurations) to be enough to support the presence of some component due to potential systematic errors, especially in the lineshape model. However, a comparison to the -U results supports this possibility, since the value of for the Model #2 fit is nearly identical to that of the fit to -U data where more clearly visible evidence exists for multiple configurations. The fact that multiple excitation peaks, shoulders, or other visible evidence is not observed in the data in Fig. 7 is because URu2Si2 is more dominated by a single configuration than -U. We do not categorically rule out that URu2Si2 has no component, however.

Taking these results together, we conclude that URu2Si2 is dominated by a delocalized configuration and is possibly weakly intermediate valent. Although it has a similar to strongly localized UCd11, the shift in and the enhanced peak width both indicate a delocalized orbital.
Although electron involvement in the conduction band is strongly supported by these data, either through a band or a Kondo-like mechanism, it is important to note that the lack of temperature dependence in is typical of other uranium intermetallics, even in those with Kondo temperatures between 100 K and 200 K, where one would expect shifts in at temperatures above 20 K.[51] The lack of temperature dependence here is consistent with angle-integrated photoemission results.[52] Like the angle-integrated photoemission experiments, the RXES results presented here are sensitive to the average of all potential configurations. We point out that if only a small portion of the Fermi surface, eg. the -point hole pocket, displayed any temperature dependence, RXES would not be very sensitive to it.
Although no temperature dependence is observed in these data from room temperature to 10 K and the measurements are consistent with a partially filled band, it is instructive to consider the implications in light of the Anderson model.[53] As such, this part of the discussion is intended to be only qualitative or semi-quantitative in order to illustrate the implications of the measurements reported above. With a qualitative goal in mind, we can consider these results using the non-crossing approximation (NCA).[54] Within a simplification of this model for a single electron (which can be taken as a single unpaired electron), one can consider:[55]
| (3) |
where the Kondo physics affects , with
| (4) |
where is the magnetic degeneracy, is the hybridization strength, is the density of electronic states at the Fermi energy, is the hybridization matrix element between and the conduction electrons, and is the Kondo temperature as defined in the NCA formalism. changes very slowly with where , and so we can consider the low- value to be constant:
| (5) |
where is the absolute energy of the level with respect to . We note that
and therefore the high-temperature limit of is .
Within this formalism, we expect to observe a total change in of from K to about . Here, it is important to distinguish between the coherence temperature K and the estimate of the Kondo temperature K.[56] For this rough discussion, taking K and including no more than limits the ratio of to about 0.3. We have confirmed this limit with a more detailed NCA calculation.[57] For smaller , this limit would be even more restrictive. Therefore, the main conclusion of this qualitative discussion is simply that charge fluctuations dominate the interpretation of the RXES data. We stress that this estimate is in the single-impurity regime above the coherence temperature, and definitely above the HO transition, below which Hall effect measurements indicate a very small carrier concentration of only 0.05 holes per formula unit within the usual 1-band approximation. Such a low carrier concentration would not provide enough conduction holes to quench any unpaired electron spins in any Kondo effect,[58] a situation particularly important when one moves away from a single-impurity model and toward a lattice model.[59]
The picture that emerges from these data is therefore one that is dominated by conventional charge fluctuations such as one would expect from itinerant electrons, with very little if any temperature dependence indicating strong hybridization between the orbital and the conduction band. On the other hand, a contribution from an configuration is consistent with the RXES data. It remains possible that the delocalized -like contributions originate from the majority portion of the Fermi surface, while a minority portion, such as the -point hole pocket, are the source of more localized -like behavior. If this is the case, any temperature dependence in the U -edge absorption of this minority portion would be obscured by the majority -like portion. In other words, these data are easily rectified with the itinerant band theories, but could still allow for a localized theory if that theory only applied to a small portion of the Fermi surface or some other minority portion of the electronic structure. This dichotomy is therefore suggestive of a 2-fluid like interpretation, and, in fact, 2-fluid theories appear in many explanations of various actinide phenomena,[60, 61, 62, 63, 64, 65] including of URu2Si2.[66, 18]
V Conclusion
RXES measurements at the U edge and the U emission indicate that URu2Si2 has a delocalized orbital with a mean occupancy . The conclusion of a delocalized orbital is derived from the line shape of the RXES signal, by the shift in the threshold energy, and the lack of temperature dependence. These results are consistent with EELS and photoemission experiments (see Sec. I). These results are not consistent with theoretical models that require a localized state to generate crystal field splitting in the manifold, unless this state could be in the minority compared to a majority band.
Acknowledgments
CHB acknowledges several useful conversations with Jason Jeffries, Nicholas Butch, Andrew Wray, Jonathon Denlinger, and Jon Lawrence. JGT gratefully acknowledges support during FY 2014 from the Lawrence Livermore National Laboratory (LLNL) PRT program for his sabbatical at Lawrence Berkeley National Laboratory (LBNL). Work at LBNL was supported by the Director, Office of Science, Office of Basic Energy Sciences (OBES), of the U.S. Department of Energy (DOE) under contract DE-AC02-05CH11231. LLNL is operated by Lawrence Livermore National Security, LLC, for the U.S. Department of Energy, National Nuclear Security Administration, under Contract DE-AC52-07NA27344. RXES data were collected at the Stanford Synchrotron Radiation Lightsource, a national user facility operated by Stanford University on behalf of the DOE, OBES. Work at Los Alamos National Laboratory was performed under the auspices of the U.S. DOE, OBES, Division of Materials Sciences and Engineering.
References
- [1] T. T. M. Palstra, A. A. Menovsky, J. van den Berg, A. J. Dirkmaat, P. H. Kes, G. J. Nieuwenhuys, and J. A. Mydosh, Phys. Rev. Lett. 55, 2727 (1985).
- [2] M. B. Maple, J. W. Chen, Y. Dalichaouch, T. Kohara, C. Rossel, M. S. Torikachvili, M. W. McElfresh, and J. D. Thompson, Phys. Rev. Lett. 56, 185 (1986).
- [3] C. Broholm, J. K. Kjems, W. J. L. Buyers, P. Matthews, T. T. M. Palstra, A. A. Menovsky, and J. A. Mydosh, Phys. Rev. Lett. 58, 1467 (1987).
- [4] See, for example, articles in Special Issue: Hidden order in URu2Si2, Phil. Mag. 94, Issue 32-33, (2014).
- [5] J. A. Mydosh and P. M. Oppeneer, Phil. Mag. 94, 3642 (2014).
- [6] J. A. Mydosh and P. M. Oppeneer, Rev. Mod. Phys. 83, 1301 (2011).
- [7] P. Chandra, P. Coleman, and R. Flint, Phys. Rev. B 91, 205103 (2015).
- [8] P. Chandra, P. Coleman, and R. Flint, Nature 493, 621 (2013).
- [9] A. I. Tóth and G. Kotliar, Phys. Rev. Lett. 107, 266405 (2011).
- [10] J.-J. Su, Y. Dubi, P. Wölfle, and A. V. Balatsky, J. Phys.: Condens. Matter 23, 094214 (2011).
- [11] H. Harima, K. Miyake, and J. Flouquet, J. Phys. Soc. Jpn. 79, 033705 (2010).
- [12] K. Haule and G. Kotliar, Nat. Phys. 5, 796 (2009).
- [13] P. M. Oppeneer, J. Rusz, S. Elgazzar, M.-T. Suzuki, T. Durakiewicz, and J. A. Mydosh, Phys. Rev. B 82, 205103 (2010).
- [14] P. M. Oppeneer, S. Elgazzar, J. Rusz, Q. Feng, T. Durakiewicz, and J. A. Mydosh, Phys. Rev. B 84, 241102(R) (2011).
- [15] H.-H. Kung, R. E. Baumbach, E. D. Bauer, V. K. Thorsmølle, W.-L. Zhang, K. Haule, J. A. Mydosh, and G. Blumberg, Science 347, 1339 (2015).
- [16] See Supplementary Materials for Ref. 15.
- [17] C. R. Wiebe, J. A. Janik, G. J. MacDougall, G. M. Luke, J. D. Garret, H. D. Zhou, Y.-J. Jo, L. Balicas, Y. Qiu, J. R. D. Copley, et al., Nat. Phys. 3, 96 (2007).
- [18] K. R. Shirer, A. C. Shockley, A. P. Dioguardi, J. Crocker, C. H. Line, N. apRoberts Warrren, D. M. Nisson, P. Klavins, J. C. Cooley, Y.-F. Yang, et al., PNAS 109, E3067 (2012).
- [19] N. P. Butch, M. E. Manley, J. R. Jeffries, M. Janoschek, K. Huang, M. B. Maple, A. H. Said, B. M. Leu, and J. W. Lynn, Phys. Rev. B 91, 035128 (2015).
- [20] K. Behnia, R. Bel, Y. Kasahara, Y. Nakajima, H. Jin, H. Aubin, K. Izawa, Y. Matsuda, J. Floquet, Y. Haga, et al., Phys. Rev. Lett. 94, 156405 (2005).
- [21] L. A. Wray, J. Denlinger, S.-W. Huang, H. He, N. P. Butch, M. B. Maple, Z. Hussain, and Y.-D. Chuang, Phys. Rev. Lett. 114, 236401 (2015).
- [22] S. Tonegawa, K. Hashimoto, K. Ikada, Y.-H. Lin, H. Shishido, Y. Haga, T. D. Matsuda, E. Yamamoto, Y. Onuki, H. OIkeda, et al., Phys. Rev. Lett. 109, 036401 (2012).
- [23] S. Tonegawa, S. Kasahara, T. Fukuda, K. Sugimoto, N. Yasuda, Y. Tsuruhara, D. Watanabe, Y. Mizukami, Y. Haga, T. D. Matsuda, et al., Nat. Comm. 5, 4188 (2014).
- [24] F. Bourdarot, B. Fåk, K. Habicht, and K. Prokeš, Phys. Rev. Lett. 90, 067203 (2003).
- [25] A. Grauel, A. Böhm, H. Fischer, C. Geibel, R. Köhler, R. Modler, C. Schank, F. Steglich, G. Weber, T. Komatsubara, et al., Phys. Rev. B 46, 5818 (1992).
- [26] T. Durakiewicz, Phil. Mag. 94, 3723 (2014).
- [27] I. Kawasaki, S.-I. Fujimori, Y. Takeda, T. Okane, A. Yasui, Y. Saitoh, H. Yamagami, Y. Haga, E. Yamamoto, and Y. Onuki, Phys. Rev. B 83, 235121 (2011).
- [28] S. Fujimori, T. Ohkochi, I. Kawasaki, A. Yasui, Y. Takeda, T. Okane, Y. Saitoh, A. Fujimori, H. Yamagami, Y. Haga, et al., J. Phys. Soc. Jpn 81, 014703 (2012).
- [29] A. F. Santander-Syro, M. Klein, F. L. Boariu, A. Nuber, P. Lejay, and F. Reinert, Nature Phys. 5, 637 (2009).
- [30] J.-Q. Meng, P. M. Oppeneer, J. A. Mydosh, P. S. Riseborough, K. Gofryk, J. J. Joyce, E. D. Bauer, Y. Li, and T. Durakiewicz, Phys. Rev. Lett. 111, 127002 (2013).
- [31] J. R. Jeffries, K. T. Moore, N. P. Butch, and M. B. Maple, Phys. Rev. B 82, 033103 (2010).
- [32] J. G. Tobin, S.-W. Yu, C. H. Booth, T. Tyliszczak, D. K. Shuh, G. van der Laan, D. Sokaras, D. Nordlund, T.-C. Weng, and P. S. Bagus, Phys. Rev. B 92, 035111 (2015).
- [33] L. Tröger, D. Arvanitis, K. Baberschke, H. Michaelis, U. Grimm, and E. Zschech, Phys. Rev. B 46, 3283 (1992).
- [34] W. Kohn and T. K. Lee, Phil. Mag. A 45, 313 (1982).
- [35] J. L. Sarrao, C. D. Immer, C. L. Benton, Z. Fisk, J. M. Lawrence, D. Mandrus, and J. D. Thompson, Phys. Rev. B 54, 12207 (1996).
- [36] C. H. Booth, D. Kazhdan, E. Werkema, M. D. Walter, W. W. Lukens, E. D. Bauer, Y.-J. Hu, L. Maron, O. Eisenstein, M. Head-Gordon, et al., J. Am. Chem. Soc. 132, 17537 (2010).
- [37] P. G. Allen, J. J. Bucher, D. K. Shuh, N. M. Edelstein, and T. Reich, Inorg. Chem. 36, 4676 (1997).
- [38] S. D. Conradson, K. D. Abney, B. D. Begg, E. D. Brady, D. L. Clark, C. den Auwer, M. Ding, P. K. Dourhout, F. J. E. Faller, P. L. Gordon, et al., Inorg. Chem. 43, 116 (2004).
- [39] D. Sokaras, T. C. Weng, D. Nordlund, R. Alonso-Mori, P. Velikov, D. Wenger, A. Garachtchenko, M. George, V. Borzenets, B. Johnson, et al., Rev. Sci. Instrum 84, 053102 (2013).
- [40] C. H. Booth, S. A. Medling, Y. Jiang, E. D. Bauer, P. H. Tobash, J. N. Mitchel, D. K. Veieers, M. A. Wall, P. G. Allen, J. J. Kas, et al., J. Elec. Spec. Rel. Phen. 194, 57 (2014).
- [41] J.-P. Rueff and A. Shukla, Rev. Mod. Phys. 82, 847 (2010).
- [42] O. Keski-Rahkonen and M. O. Krause, Atomic Data and Nuclear Data Tables 14, 139 (1974).
- [43] P. Soderlind, A. Landa, J. G. Tobin, P. Allen, S. Medling, C. H. Booth, E. Bauer, J. C. Cooley, D. Sokaras, T.-C. Weng, et al., J. Electr. Spec. Rel. Phen. 207, 14 (2016).
- [44] C. H. Booth, Y. Jiang, D. L. Wang, J. N. Mitchell, P. H. Tobash, E. D. Bauer, M. A. Wall, P. G. Allen, D. Sokaras, D. Nordlund, et al., Proc. Natl. Acad. Sci. U. S. A. 109, 10205 (2012).
- [45] S. L. Dudarev, D. Nguyen Manh, and A. P. Sutton, Phil. Mag. B 75, 613 (1997).
- [46] S.-W. Yu, J. G. Tobin, J. C. Crowhurst, S. Sharma, J. K. Dewhurst, P. Olalde-Velasco, W. L. Yang, and W. J. Siekhaus, Phys. Rev. B 83, 165102 (2011).
- [47] J. J. Rehr, J. J. Kas, F. D. Vila, M. P. Prange, and K. Jorissen, Phys. Chem. Chem. Phys. 12, 5503 (2010).
- [48] R. W. G. Wyckoff, Crystal Structures (Interscience Publishers, New York, 1964), 2nd ed.
- [49] A. C. Larson, R. B. Roof, and D. T. Cromer, Acta Cryst. 17, 555 (1964).
- [50] T. Vitova, K. O. Kvashnina, G. Nocton, G. Sukharina, M. A. Denecke, S. M. Butorin, M. Mazzanti, R. Caciuffo, A. Soldatov, T. Behrends, et al., Phys. Rev. B 82, 235118 (2010).
- [51] Although not explicitly mentioned in Ref. 44, all data reported therein were collected at temperatures of 20 or 30 K and at room temperature.
- [52] S. H. Yang, H. Kumigashira, T. Yokoya, A. Chainani, N. Sato, T. Komatsubara, S. J. Oh, and T. Takahashi, J. Electron Spectrosc. Relat. Phenom. 78, 143 (1996).
- [53] A. C. Hewson, The Kondo Problem to Heavy Fermions (Cambridge University Press, Cambridge, 1993).
- [54] N. E. Bickers, D. L. Cox, and J. W. Wilkins, Phys. Rev. B 36, 2036 (1987).
- [55] D. L. Cox, Ph.D. thesis, Cornell University (1985).
- [56] J. Schoenes, C. Schönenberger, J. J. M. Franse, and A. A. Menovsky, Phys. Rev. B. 35, 5375 (1987).
- [57] J. M. Lawrence, P. S. Riseborough, C. H. Booth, J. L. Sarrao, J. D. Thompson, and R. Osborn, Phys. Rev B 63, 054427 (2001).
- [58] S. Burdin, A. Georges, and D. R. Grempel, Phys. Rev. Lett. 85, 1048 (2000).
- [59] E. D. Bauer, C. H. Booth, J. M. Lawrence, M. F. Hundley, J. L. Sarrao, J. D. Thompson, P. S. Riseborough, and T. Ebihara, Phys. Rev. B 69, 125102 (2004).
- [60] J. Schoenes, O. Vogt, J. Löhle, F. Hulliger, and K. Mattenberger, Phys. Rev. B 53, 14987 (1996).
- [61] G. Zwicknagl and P. Fulde, J. Phys.:Condes. Matter 15, S1911 (2003).
- [62] F. Steglich, P. Gegenwart, R. Helfrich, C. Langhammer, P. Hellmann, L. Donnevert, C. Geibel, M. Lang, G. Sparn, W. A. anbd G. R. Stewart, et al., Z. Phys. B 103, 235 (1997).
- [63] D. L. Cox and M. Jarrell, J. Phys.: Condens. Matter 8, 9825 (1996).
- [64] S. Nakatsuji, D. Pines, and Z. Fisk, Phys. Rev. Lett. 92, 016401 (2004).
- [65] Y.-f. Yang and D. Pines, PNAS 109, E3060 (2012).
- [66] Y. Okuno and K. Miyake, J. Phys. Soc. Jpn. 67, 2469 (1998).