Simplified QCD fit method
for BSM analysis of HERA data
\zeusauthorOleksii Turkot,
Katarzyna Wichmanna and
Aleksander Filip Żarneckib
aDESY and
bFaculty of Physics, University of Warsaw
Abstract
The high-precision HERA data can be used as an input to a QCD analysis within the DGLAP formalism to obtain the detailed description of the proton structure in terms of the parton distribution functions (PDFs). However, when searching for Beyond Standard Model (BSM) contributions in the data one should take into account the possibility that the PDF set may already have been biased by partially or totally absorbing previously unrecognised new physics contributions. The ZEUS Collaboration has proposed a new approach to the BSM analysis of the inclusive data based on the simultaneous QCD fits of parton distribution functions together with contributions of new physics processes. Unfortunately, limit setting procedure in the frequentist approach is very time consuming in this method, as full QCD analysis has to be repeated for numerous data replicas. We describe a simplified approach, based on the Taylor expansion of the cross section predictions in terms of PDF parameters, which allowed us to reduce the calculation time for the BSM limits by almost two orders of magnitude.
June 21, 2016
1 Introduction
The H1 and ZEUS collaborations measured inclusive scattering cross sections at HERA from 1994 to 2000 (HERA I) and from 2002 to 2007 (HERA II), collecting together a total integrated luminosity of about 1 fb-1. All inclusive data were recently combined [1] to create one consistent set of neutral current (NC) and charged current (CC) cross-section measurements for scattering with unpolarised beams. The inclusive cross sections were used as input to a QCD analysis within the DGLAP formalism, resulting in a PDF set denoted as HERAPDF2.0.
The ZEUS collaboration has recently used the HERA combined data to set limits on possible deviations from the Standard Model due to a finite radius of the quarks [2]. To take into account the possibility that the new physics contributions can affect PDF determination, resulting in the bias of the QCD fit results, the limit-setting procedure was based on a simultaneous QCD fit of PDF parameters and the quark radius. The C.L. limits on the effective quark-radius squared, , were
Taking into account the possible influence of quark radii on the PDF parameters turned out to be important - for fixed PDFs the obtained limits would be too strong by about 10%.
These limits on the effective quark-radius squared were derived in a frequentist approach [3] using the technique of replicas. The replicas are sets of cross-section values that are generated by varying all cross sections randomly according to their known statistical and systematic uncertainties. For each value of the true quark-radius squared, , considered in the limit setting procedure, about 5000 replicas were generated and used as an input to a QCD fit with the PDF parameters and the quark radius squared treated as free parameters. With a single QCD fit to the full HERA data set taking on average about 1.5 hour of CPU time, 200 000 fits performed for setting the final limits in the quark radius analysis required over 30 years of CPU time. Even when using a high performance computing cluster, processing time is a limiting factor for possible extensions of the analysis to other models.
2 Standard QCD+BSM fit
As described in the paper [2], the PDFs of the proton are described at a starting scale of GeV2 in terms of parameters. These parameters, denoted in the following (or for the set of parameters), together with the possible contribution of BSM phenomena (quark form factor or CI coupling ) are fit to the data using a method, with the formula given by:
| (1) |
Here and are the measured cross-section value and the pQCD+BSM cross-section prediction at the point . The quantities , and are the relative correlated systematic, relative statistical and relative uncorrelated systematic uncertainties of the input data, respectively. The components of the vector represent the correlated systematic shifts of the cross sections (given in units of ), which are fit to the data together with PDF parameter set and the CI coupling . The summations extend over all data points and all correlated systematic uncertainties .
The dependence of the pQCD+BSM cross-section prediction at the point on the PDF parameters and the CI coupling can be written as:
| (2) |
where and are the kinematic variables corresponding to the point .
3 Replica generation
Equation (2) relating model parameters and cross-section predictions is also used for the replica generation. For each replica, the generated value of the cross section at the point , , is calculated as
| (3) |
where variables and represent random numbers from a normal distribution generated for each data point and for each source of correlated systematic uncertainty , respectively. A set of cross-section values is calculated using the nominal PDF predictions (based on the set of the PDF parameters fit to the actual data [1] without taking CI contribution into account) and the assumed CI coupling value . It can be written as
| (4) |
The set of nominal Standard Model predictions can be defined as
| (5) |
In the simplified approach described below, these predictions will be used as the reference cross section values.
4 Simplified QCD fit approach
The proposed approach is based on the assumption that PDF parameters resulting from the QCD fit fluctuate only within relatively small uncertainties from replica to replica. Therefor, we assume that the dependence of the cross-section predictions on the PDF parameters can be approximated by a first order (linear) Taylor expansion, valid for small parameter variations. For each data point , we define a vector of derivatives:
| (6) |
where . These derivatives can be calculated numerically in the linear approximation as:
| (7) |
Here is the uncertainty of the fitted PDF parameter (-th parameter of the vector ) and the two parameter vectors and describe parameter sets resulting from changing parameter by :
| (8) | |||||
| (9) |
The simplified formula for the model predictions has a form
| (10) |
where is the shift of the PDF parameter with respect to the nominal fit result, . By substituting exact formula (2) by the approximate formula (10) we can significantly speed-up calculation of the model predictions in the PDF fitting procedure.
The proposed procedure was tested by comparing results of the full QCD fit and the simplified fit on a large sample of Standard Model replicas (generated without BSM contribution, i.e. with set to 0). Possible CI contribution was also not considered in the fit ( parameter fixed to 0). Parameter values resulting from the full QCD fit and from the simplified fit on the large set of the Standard Model replicas are compared in Fig. 1. Parameters , , and describing high- behaviour of valence , valence , see and see quarks respectively, are considered. Distributions of the fitted parameter values agree in general, but there are also visible differences between the two methods and a systematic bias for and parameters. However, when comparing the reduced cross-section values calculated from the fitted PDFs, as illustrated in Fig. 2, the two approaches agree very well. The simplified fit reproduces results of the full fit with percent level accuracy and no systematic bias. The agreement of the replica data with the predictions of DGLAP evolution equations, as indicated by the value of the fit, is well reproduced while the processing time is reduced by a factor of almost 50, as shown in Fig. 3.


5 Simplified QCD+BSM fit
The procedure described above can be easily extended to different CI scenarios. Exact description of the pQCD+BSM cross-section predictions as a function of the coupling parameter can still be preserved. This is because the dependence of the model predictions on the coupling is restricted to linear and quadratic terms only. For each data point , two additional cross-section values (in addition to the reference value defined by formula 5) can be defined:
| (11) | |||||
| (12) |
where is a fixed (but otherwise arbitrary) step value (eg. 1 TeV-2). These values can be then used to calculate the cross section terms linear and quadratic in CI coupling:
| (13) | |||||
| (14) |
The cross section prediction can be then written as
| (15) |
For each data point , in addition to the three reference cross-section values (, ,) and the vector of derivatives (see equation 6), one needs to calculate two vectors of derivatives, corresponding to and values ():
| (16) | |||||
| (17) |
These derivatives can also be calculated numerically, based on the linear approximation, see formula (7) above.
To summarize, reference values have to be stored for each data point (three cross section values and three derivative values for each PDF parameter). These values are calculated using the full cross section formula (2) and the PDF parameters fit to the nominal data. We can then introduce a simplified description of the CI model predictions:
| (18) | |||||
where and , are combinations of calculated derivatives, corresponding to cross-section terms linear and quadratic in the coupling:
| (19) | |||||
| (20) |
The simplified cross-section function defined by the formula (18) can then replace the full cross-section calculation (including QCD evolution of PDFs) given by of formula (2) in the QCD+CI fit procedure for replicas generated for any , assuming the deviations from nominal Standard Model predictions are small.
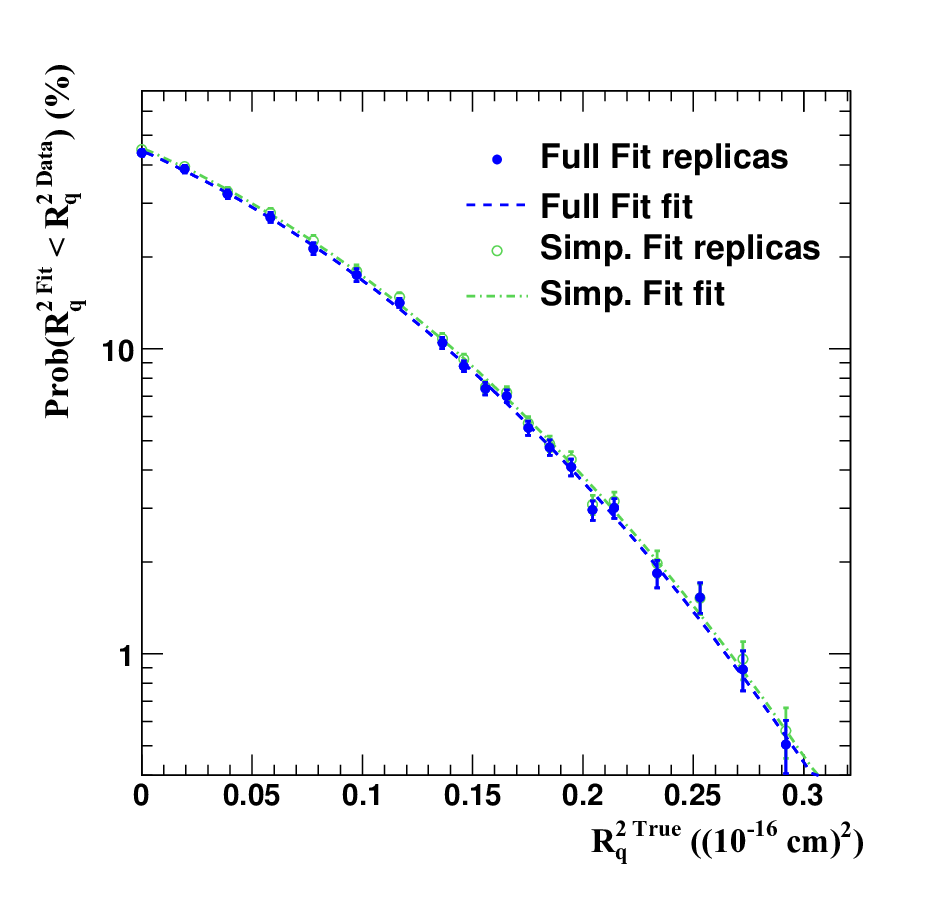
The presented approach was tested for the quark form-factor model. Shown in Fig. 4 is the correlation between the value obtained from the full QCD+ fit and those obtained, for the same replicas, using the simplified approach. The replica sets were generated for the Standard Model () and for the quark form-factor model with the quark radius corresponding to the ZEUS limit of cm [2].


As for the cross-section predictions, values fitted with the simplified method agree almost perfectly with the full QCD+ fit results. Only for a small fraction of replicas some differences are visible, which are much smaller than the width of the distribution. The quality of the fit, as described by the resulting value, is also very similar for both fit methods, as illustrated in Fig. 5. When the simplified method is used for the limit setting procedure, the probability distribution and the resulting limit on the quark radius squared also agrees very well with the results of [2], see Fig. 6.
6 Conclusions
The simplified procedure for fitting PDF parameters and BSM couplings to the HERA inclusive data has been developed. The procedure reproduces the results of the full QCD fit very well and allows to shorten the computation time by a factor of 50. This opens the possibility to extend the quark form-factor analysis [2] of the HERA inclusive data [1] to other CI-like scenarios.
References
- [1] H1 and ZEUS Coll., H. Abramowicz et al., Eur. Phys. J. C 75 (2015) 580.
- [2] ZEUS Coll., H. Abramowicz et al., Phys.Lett. B757 (2016)468.
- [3] R.D. Cousins, Am. J. Phys. 63 (1995) 398.