Galaxy candidates at in archival data from the
Brightest of Reionizing Galaxies (BoRG[z8]) survey
Abstract
The Wide Field Camera 3 (WFC3) on the Hubble Space Telescope (HST) enabled the search for the first galaxies observed at ( Myr after the Big Bang). To continue quantifying the number density of the most luminous galaxies () at the earliest epoch observable with HST, we search for galaxies (F125W-dropouts) in archival data from the Brightest of Reionizing Galaxies (BoRG[z8]) survey, originally designed for detection of galaxies (F098M-dropouts). By focusing on the deepest 293 arcmin2 of the data along 62 independent lines of sight, we identify six candidates satisfying the color selection criteria, detected at S/N in F160W with to if at . Three of the six sources, including the two brightest, are in a single WFC3 pointing ( arcmin2), suggestive of significant clustering, which is expected from bright galaxies at . However, the two brightest galaxies are too extended to be likely at , and one additional source is unresolved and possibly a brown dwarf. The remaining three candidates have , and given the area and completeness of our search, our best estimate is a number density of sources that is marginally higher but consistent at with searches in legacy fields. Our study highlights that searches can yield a small number of candidates, making tailored follow-ups of HST pure-parallel observations viable and effective.
Subject headings
cosmology: observations — galaxies: evolution — galaxies: formation — galaxies: high-redshiftI. Introduction
The epoch of reionization signified the appearance of the first stars and galaxies within the first billion years after the Big Bang, and the transformation of the intergalactic medium (IGM) from opaque to transparent. Despite recent progress, however, it is not yet fully understood. It is now well established that reionization is completed by thanks to observations of the Ly forest (e.g. Willott et al. 85), and that the Universe was substantially ionized around redshift when its age was less than 600 Myr, based on the electron scattering optical depth measured by Planck [60]. However, there is still substantial uncertainty regarding the sources of reionization. Can galaxies form with sufficient efficiency at such early times to provide enough reionizing photons (e.g. Alvarez, Finlator & Trenti 1), or is the process possibly driven by other classes of objects such as AGN [28, 42]?
Observationally, recent progress in near-IR detector technology has dramatically advanced our ability to search for galaxies during this epoch. Following the installation of the Wide Field Camera 3 (WFC3) on the Hubble Space Telescope (HST), a continuously growing sample of galaxy candidates at is accumulating thanks to a variety of surveys. These range from small-area ultradeep observations such as the Hubble Ultra-deep Field (HUDF, Illingworth et al. 33), to shallower, larger-area searches for galaxies either in legacy fields such as the Cosmic Assembly Near-infrared Deep Extragalactic Legacy Survey (CANDELS; Grogin et al. 30, Koekemoer et al. 38), or taking advantage of random-pointing opportunities like in the Brightest of Reionizing Galaxies (BoRG) survey (GO 11700, 12572, 13767; PI Trenti). Overall, a sample approaching 1000 galaxy candidates at is known today [15], and we are beginning to identify the first galaxy candidates from the first 500 million years (; Bouwens et al. 12, Bouwens et al. 14, Bouwens et al. 15, Bouwens et al. 16, Zheng et al. 88, Coe et al. 21, Ellis et al. 23, McLure et al. 47, Oesch et al. 55, Zheng et al. 89, Zitrin et al. 90, McLeod et al. 46, Ishigaki et al. 35, Infante et al. 34).
These observations provide solid constraints on the galaxy luminosity function (LF) out to , which appears to be overall well described by a Schechter [63] form, , as at lower redshift [11, 66, 15, 27]. However, other studies suggest that bright galaxy formation might not be suppressed as strongly at , and either a single power law [13, 27] or a double power law [17] fit to the bright end of the LF has been explored. This change in the shape of the bright end is in turn connected theoretically to the physics of star formation in the most overdense and early forming environments where the brightest and rarest galaxies are expected to live [48, 78]. A departure from a Schechter form could indicate a lower efficiency of feedback processes at early times, which in turn would imply an increase in the production of ionizing photons by galaxies. Additionally, at , the observed number density of bright galaxies is affected by magnification bias [86, 4, 44, 25], and this bias can cause the LF to take on a power-law shape at the bright end. Currently, the samples at are still too small to draw any conclusion on which scenario is realized, since only a handful of candidates are known.
In addition to constraining the shape of the LF, the brightest high- candidates identified by HST observations are also ideal targets for follow-up observations to infer stellar population properties such as ages and stellar masses [68, 39, 40, 29], ionization state of the IGM [49], and spectroscopic redshift. For the latter, confirmation of photometric candidates relies typically on detection of a Lyman break in the galaxy continuum, (e.g., Malhotra et al. 43) and/or of emission lines, primarily Lyman- (e.g. Stark et al. 69, Pentericci et al. 58, Pentericci et al. 59, Caruana et al. 19, Schenker et al. 64, Treu et al. 80, Treu et al. 81, Finkelstein et al. 26, Tilvi et al. 74, Vanzella et al. 84) or other UV lines such as CIII] or CIV [70, 71]. Spectroscopic follow-up for sources at is extremely challenging, with only limits on line emission resulting from most observations. Yet, the brightest targets show significant promise of detection based on the latest series of follow-ups which led to spectroscopic confirmation out to [91], with several other Ly detections at [56, 62].
With the goal of complementing the discovery of the rarest and most luminous sources in the epoch of reionization from legacy fields such as CANDELS, the Brightest of Reionizing Galaxies Survey (BoRG, see Trenti et al. 77) has been carrying out pure-parallel, random pointing observations with WFC3 since 2010. BoRG identified a large sample () of -band dropouts with (Trenti et al. 77, Trenti et al. 78, Bradley et al. 8, Schmidt et al. 66; see also McLure et al. 47, Bouwens et al. 15). This represents a catalog of galaxies that is not affected by large scale structure bias (sample or “cosmic” variance; see Trenti & Stiavelli 75), which is especially severe for rare sources sitting in massive dark matter halos (), as inferred from clustering measurements at [3]. Follow-up spectroscopy of the BoRG dropouts with Keck and VLT has provided evidence for an increase of the IGM neutrality at compared to [80, 81, 5]. Currently, a new campaign of observations is ongoing, with a revised filter-set optimized for the new frontier of redshift detection at (BoRG[z9-10]; GO 13767, PI Trenti). Initial results from of the dataset ( arcmin2) led to the identification of two candidates at [18] with , which are similar in luminosity to the spectroscopically confirmed source reported by Zitrin et al. [91], but significantly brighter than the six -dropouts with identified in the GOODS/CANDELS fields from a comparable area [55].
These recent developments indicate that it might be possible for a small number of ultra-bright sources () to be present as early as 500 Myr after the Big Bang. Thus, they prompted us to systematically analyze the BoRG archival data from observations in the previous cycles, which cover arcmin2, to search for bright candidates and constrain their number density. This paper presents the results of this search, and is organized as follows: Section II briefly introduces the BoRG dataset. Section III discusses our selection criteria for sources (-band dropouts), with results presented in Section IV. In Section V, we determine the galaxy UV luminosity function at , and compare with previous determinations. Section VI summarizes and concludes. Throughout the paper we use the Planck Collaboration et al. [60] cosmology: , and . All magnitudes are quoted in the AB system [57].
II. The BoRG survey
We use data acquired as part of the Brightest of Reionizing Galaxies (BoRG[z8]) survey, which consists of core BoRG pointings (GO 11700, 12572, 12905), augmented by other pure parallel archival data (GO 11702, PI Yan, Yan et al. 87) and COS GTO coordinated parallel observations. For an in-depth description of the survey, we refer the reader to Trenti et al. [77], Bradley et al. [8], Schmidt et al. [66]. Here, we use the 2014 (DR3) public release of the data11 1 https://archive.stsci.edu/prepds/borg/, which consists of 71 independent pointings covering a total area of 350 arcmin2. All fields were imaged using the WFC3/IR filters F098M, F125W and F160W, and in the optical band, using either the WFC3 F606W or F600LP filter. We refer to the WFC3 F098M, F125W and F160W images as the , and images, and to the F606W and F600LP images as and , respectively.
Exposure times in each filter vary on a field-by-field basis, and 5 limiting magnitudes for point sources and aperture are between , with a typical value of [77, 8, 66]. We note that since the dataset originates from parallel observations when the primary instrument is a spectrograph (COS or STIS), there is no dithering of the exposures. To compensate for the lack of dithering, the BoRG data reduction pipeline has been augmented with a customized Laplacian edge filtering algorithm developed by van Dokkum [83]. Overall, the lack of dithering has a minimal impact () on the image and photometric quality, as it has been established through comparison between primary (dithered) versus pure-parallel observations of the same field [18].
Since the BoRG[z8] survey was designed to have as primary detection band, some fields have only a single short exposure in the -band. To ensure a consistently high image quality, here we include in the analysis only those fields with total exposure time in . This resulted in the exclusion of 9 fields out of 71, so that the area included in our study is arcmin2. The distribution of the exposure time in for the fields in BoRG[z8] is shown in Figure 1.

The BoRG[z8] public data release consists of reduced and aligned science images produced with MultiDrizzle [37] with a pixel scale of , as well as associated weight maps (see Bradley et al. 8, Schmidt et al. 66). Following our standard analysis pipeline to search for dropouts in the data [77], we create RMS maps from the weight maps, and normalize them to account for correlated noise induced by MultiDrizzle (see Casertano et al. 20). In short, this is done for each field and filter by measuring the noise in the image at random positions not associated with detected sources (i.e. the “sky” noise), and comparing the measurement with the value inferred from the RMS map, which can then be corrected by a multiplicative factor to match the measurement. Our rescaling factors are on average for the IR filters and for (see also Trenti et al. 77, Bradley et al. 8, Schmidt et al. 66). In addition, photometric zero-points are corrected to account for galactic reddening along each line of sight, according to Schlafly & Finkbeiner [65].
Using SExtractor [7] in dual-image mode, we construct catalogues of sources in each field, using the -band image for detection. Colors and signal to noise ratios are defined based on isophotal fluxes/magnitudes (FLUX_ISO), while we adopt MAG_AUTO for the total magnitude of each source.
III. Selection of -dropouts
To select galaxy candidates, we use the dropout technique [72]. At high , neutral hydrogen in the IGM almost completely absorbs UV photons, leading to a break at the galaxy rest wavelength of Ly (1216 Å). For galaxies between , this implies a drop in the -filter, and non-detection in the and bands.
Our focus on -dropouts implies that our sample of candidates are essentially detected only in . Therefore, to minimize the risk of introducing spurious sources, we require a clear detection in , with S/N. We also impose a strong break, trading sample completeness for higher purity, and require a color cut: , which is more conservative than the typical applied to legacy fields (e.g. Bouwens et al. 15) since we do not have the availability of multi-observatory data to constrain the continuum of candidates at longer wavelengths and help control contamination.
Overall, we impose the following criteria for selection as -dropouts:
When computing the color, if the -band flux has S/N we use the limit instead.
Finally, to reduce the risk of contamination from detector defects surviving the data reduction pipeline, we further impose a stellarity cut through the SExtractor CLASS_STAR parameter. We require CLASS_STAR , where 1 corresponds to a point source, and 0 to a diffuse light profile. We then visually inspected the dropouts that meet these criteria to reject any remaining detector artifacts and diffraction spikes. All the sources that meet all criteria and pass the visual inspection are listed in Table 1, and discussed below.
IV. Results
| ID | RA (deg) | Decl. (deg) | S/NH | S/NJ | S/NY | S/NV | Stellarity | aaAssuming . | |||
|---|---|---|---|---|---|---|---|---|---|---|---|
| borg_0240-1857_25 | 40.1195 | -18.9726 | 26.24 0.18 | 8.1 | -0.1 | 1.0bb | 0.71 | ||||
| borg_0240-1857_129 | 40.1289 | -18.9678 | 24.74 0.07 | 14.5 | 2.5 | 0.6 | 0.9bb | 0.02 | |||
| borg_0240-1857_369 | 40.1274 | -18.9612 | 25.22 0.11 | 9.6 | 2.2 | -1.7 | 0.2bb | 0.00 | |||
| borg_0456-2203_1091 | 73.9774 | -22.0372 | 26.09 0.13 | 8.1 | -1.3 | -0.4 | 0.1cc | 0.51 | |||
| borg_1153+0056_514 | 178.1972 | 0.9270 | 26.31 0.24 | 8.0 | 0.02 | -0.1 | -0.6cc | 0.01 | |||
| borg_1459+7146_785 | 224.7239 | 71.7814 | 25.82 0.14 | 1.57 | 12.8 | 3.7 | -1.1 | 1.3cc | 0.91 |


We performed a search for -dropouts over arcmin2 of archival BoRG data. We find six sources that satisfy the -dropout selection with S/N. The candidates are detected over a range of magnitudes, with four candidates between , and two brighter candidates at and . At , this corresponds to to . Three candidates are detected only in , while the remaining three are detected in both and . The photometry of the candidates is reported in Table 1, and postage stamps of , , , and are shown in Figure 2.
We derive photometric redshifts for these six candidates using the photo- code BPZ [6], assuming a flat prior on redshift, motivated by the uncertainty in the density of sources at intermediate redshifts with colors similar to those of galaxies. For the single band () detections, the photometric redshift distribution is flat over the range . For the two-band ( and ) detections, the photometric redshifts are sharply peaked around . The photometric probability distributions are included in Figure 2 alongside the images of the candidates.
A comparison of the apparent magnitude against the photometric redshift of our candidates against candidates from other HST/WFC3 surveys is shown in Figure 3. While two of our candidates are particularly bright in , they are consistent with previously-discovered candidates at by Calvi et al. [18].
We also determine the size of the candidates, starting from the observed half-light (effective) radius as determined by SExtractor, which is translated into an intrinsic source size taking into account the effects of the point-spread function (PSF) broadening and surface brightness limits following Calvi et al. [18]. The empirical relation has been constructed by inserting and recovering artificial sources with known input size and magnitude into BoRG images. Source size is very helpful to help discriminate between high- and low- sources, since direct measurements by Holwerda et al. [31] on CANDELS galaxies show that sources are more compact than contaminants with similar colors. This empirical separation might be related to an approximate scaling of galaxy sizes as with [24, 9, 10, 52], although a recent study by Curtis-Lake et al. [22] highlights that the intrinsic sizes likely evolve less strongly with redshift () compared to observed sizes. We discuss the contamination of our sample further in Section V.1.
IV.1. borg_0240-1857_129
This candidate is the brightest in the sample, with magnitude . It is robustly detected in at , and marginally detected in at , even though it is close to the edge of the chip. The source has a very red color, with . It also shows extended structure, and has . Its photometric redshift solution is sharply peaked at , with a broad higher-redshift wing.
IV.2. borg_0240-1857_369
This candidate, in the same field as the previous one is detected with magnitude , making it the second-brightest source in the sample. It is detected with S/N in , and again marginally detected with S/N in . It is the most extended source in the sample, with . Its photometric redshift, like borg_0240-1857_129, is peaked at , with a broad higher-redshift wing.
IV.3. borg_0240-1857_25
Field borg_0240-1857 includes a third bright candidate with , detected at S/N . This source is not detected in the other bands (, or 600). Unlike the two brighter candidates, this object is more compact, with a measured half-light radius . This is smaller than the PSF of the image (), indicating that it could be a point-source-like contaminant such as a cool dwarf star, although the stellarity of this source is , which is lower than the value expected for a point source (e.g. Schmidt et al. 66 uses CLASS_STAR and Bouwens et al. 15 CLASS_STAR to exclude stars).
This candidate is close to a foreground galaxy with , with a centre-to-centre projected separation of . While this foreground galaxy has an uncertain photometric redshift solution, it is likely to be at , based on its compact size. Using the framework developed by Barone-Nugent et al. [4] and Mason et al. [44], we estimate the gravitational lensing of this source. Magnification PDFs are obtained by estimating velocity dispersions from magnitudes, using the empirical redshift-dependent Faber-Jackson relations given in Mason et al. [44] and Barone-Nugent et al. [4]. Velocity dispersion is the best tracer of the strength of a strong gravitational lens [82, 67, 79]. The Einstein radii of the foreground objects are modelled as singular isothermal spheres (e.g. Treu 79) which depend on the velocity dispersion and the angular diameter distance to the source, and between the lens and source (where we use the best photo- values). Assuming that the foreground source is at (which maximizes lensing magnification), we infer a magnification .
IV.4. borg_0456-2203_1091
This object has a magnitude (), and is detected in the only, with an extended but compact structure (effective radius ).
The source is located relatively close ( separation) to a hot pixel, which appears in the and images. The -band image is unaffected since it was acquired in a later orbit than the images in bluer bands. We carefully examined the individual FLT files and conclude that since the separation between the source center and the hot pixel is larger than twice , and there is no sign of a hot pixel in the -band, the identification of the candidate as a -dropout is robust.
IV.5. borg_1153+0056_514
This candidate is detected with a magnitude , and has S/N . It is not detected in , or . It has an effective radius of . This candidate is close to a foreground object ( centre-to-centre projected separation). The foreground object has an apparent magnitude , and is at an indeterminate photometric redshift. We use the same modelling framework as for borg_0240-1857_25 to estimate the lensing magnification of this source. Assuming that the source is at , we find a maximum .
Analysis of the FLT images of this field highlighted the presence of a bad pixel, correctly identified and masked by the data reduction pipeline, at the outer edge of the segmentation map of the dropout candidate in one of the two frames. To determine the impact on the final photometry, we measured the source flux in the FLT frames separately, finding that the candidate is detected with S/N in the unaffected image and also S/N in the image affected by the bad pixel. Hence, we are confident that the source is real and that the photometry from the final drizzled image is robust.
IV.6. borg_1459+7146_785
The sixth and final candidate is confidently detected at S/N in (), and also in the with S/N = 3.7. Its photometric redshift is sharply peaked at , with a secondary solution at . This candidate is also very compact, with measured half-light radius , and the highest stellarity of the sample (CLASS_STAR = 0.91). Combining compactness with high stellarity from a high S/N source, a stellar nature (cool dwarf) for this source is relatively likely, as we discuss in Section V.1.

V. Number density and luminosity function of galaxies
To translate the results on the search of possible candidates at from the archival BoRG[z8] data into a number density/luminosity function determination, we need to assess both the impact of contamination in our sample, and the effective volume probed by the data.
V.1. Contamination
There are multiple classes of lower- sources that may have similar colors to Lyman-break galaxies (LBGs), such as Galactic stars, intermediate-redshift passive galaxies, and strong line emitters.
Cool, red stars in the Milky Way may be possible contaminants of our sample, although typical colors lack a strong drop. At low signal-to-noise ratio, the separation of point-like Galactic stars from resolved galaxies using the SExtractor CLASS_STAR parameter is not fully reliable. We use CLASS_STAR in our selection of -dropouts in Section III to reject artifacts remaining from the reduction process, but this is not a strict enough criterion to reject all stars from our sample. In this case, five of our candidates identified as -dropouts have CLASS_STAR , with only borg_1459+7146_785 having CLASS_STAR (a value considered by Bouwens et al. 15 as indicative of a stellar nature). Therefore we conclude that this source is most likely a stellar contaminant with unusual colors.
Emission-line galaxies are another source of contamination for galaxy samples. For example, galaxies at with strong [OII] emission may appear bright in -band while the galaxy continuum is too faint to be detected in the other bands [2, 32]. Bouwens et al. [16] find that, at , the average density of extreme line emitters that enter the photometric selection is per arcmin-2, by creating mock catalogs of extreme emission line galaxies with varying magnitude and spectral slope . Extrapolating this result to , we expect to find potential contaminants of this type over our survey area. This value is in line with previous spectroscopic observations of BoRG candidates by Treu et al. [80], Treu et al. [81] using the MOSFIRE spectrograph on the Keck telescope, and by Barone-Nugent et al. [5] using XSHOOTER on the Very Large Telescope. These studies found no emission lines in the spectroscopy of candidates, and are able to rule out emission lines from a low- extreme emission line contaminant to , assuming that all of the flux is due to a strong emission line. Barone-Nugent et al. [5] also find that, with a 3hr exposure, only a small part of the spectrum () is so affected by atmospheric transmission and absorption by OH lines that a strong emission line would not be detected to .
The last, and probably most severe class of contaminants, is that of passive and dusty galaxies that thus show a strong Balmer break and a very faint UV continuum. Under these conditions, sources may mimic properties of LBGs and thus enter into our selection. Observations with Spitzer/IRAC at and m can efficiently distinguish between high- and low-redshift sources. In fact, dusty galaxies will appear 1-2 magnitudes brighter in [3.6] and [4.5] than in , while LBGs will have a relatively flat spectrum. Without Spitzer data, we rely on the size of the sources as proxy for the color, considering sources with as likely contaminants. Holwerda et al. [31] find that, while the mean size of candidates in the sample from Oesch et al. [55] is , low-redshift, IRAC-red interlopers have a mean size of , but can be as small as , and there are no high- candidates with sizes greater than (Figure 4, Holwerda et al. 31). Hence, we take as a threshold. The two brightest sources in our sample are so extended to fall into such classification. The sources considered in Holwerda et al. [31] are fainter than the candidates in our sample, and so it is conceivable that the larger sizes of borg_0240-1857_129 and borg_0240-1857_369 are due to their higher luminosities. Using the size-luminosity relation derived in Holwerda et al. [31], we infer that the size of a galaxy at (the brightest in our sample) would be , below our threshold of . This size cannot be used to completely reject extreme emission-line galaxies, which are likely to be more compact. For example, Huang et al. [32] find that their sample of 52 extreme emission line galaxies in CLASH have FWHM , similar to our criterion for candidates.
In addition to finding the redshift probability distribution of our six candidates using BPZ, we also fit SED templates described in Oesch et al. [50]. From this, we find an average probability of . We conclude that three out of the six candidates, borg_1459+7146_785, borg_0240-1857_129, and borg_0240-1857_369, are likely to be contaminants. For the remaining three, contamination is still a possibility, and hence we make a conservative assumption of contamination (two out of three sources at ), based on the estimate from the BoRG[z9-10] survey [18] using the average probability for the candidates in their sample.
V.2. Clustering in borg_0240-1857: evidence for or against contamination?
Of the six possible candidates identified in the full BoRG[z8] survey, three of them, including the two brightest, are found in the same field (borg_0240-1857). The exposure time for this pointing is similar to the median of the survey ( s in ), and thus such a catch is highly unlikely under the assumptions of a uniform distribution of candidates in the 62 fields analyzed here. Based on theoretical expectations, the presence of clustering can be used to verify the identity of bright high- sources [48], under the broad assumption that UV luminosity is correlated with dark-matter halo mass (e.g., Trenti et al. 76, Tacchella et al. 73). Overdensities have also been identified at in LBG samples [78, 36]. However, one alternative possibility, more consistent with the relatively large size of the two bright -dropouts, would be the presence of an overdensity of passive and dusty satellite galaxies within an intermediate redshift group. In either case, a further exploration of this configuration is very interesting since it can either identify an exciting overdensity of unexpectedly bright sources at , or shed light on the properties of intermediate redshift galaxies with extreme colors.
V.3. Completeness
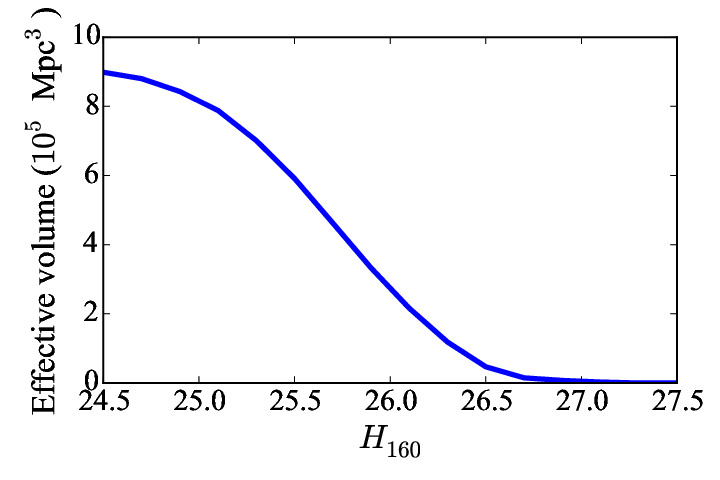
We perform source recovery simulations to determine the efficiency and completeness of our selection, following Oesch et al. [50], Oesch et al. [51], Oesch et al. [53]. To do this, we insert and recover artificial galaxies with a Sérsic luminosity profile in the images. Half of the sources follow a de Vaucouleurs profile (Sérsic index ), and the other half follow an exponential profile (Sérsic index ), spanning a range of magnitudes (), redshifts () and sizes (logarithmic distribution with mean 0175 at , scaling as ). The spectra of the sources are modeled as power law with (Gaussian distribution) with a sharp cut-off at rest-frame . The intrinsic profiles of the artificial sources are convolved with the WFC3 PSF for each corresponding filter, before being inserted into the BoRG science images at random positions. Sources are then identified with SExtractor, and the statistics of the recovery rate is quantified. This is through the definition of which is the completeness of the source detection, that is the probability of recovering an artificial source of magnitude in the image, and of , which is the probability of identifying an artificial source of magnitude and redshift within the dropout sample, assuming that the source is detected. One example of the selection function for the dropout search in field borg_0440-5244 is shown in the bottom panel of Figure 4, while the upper panel of the same figure shows the overall effective volume probed by our search over all BoRG archival fields as a function of the apparent magnitude.

V.4. Determination of the luminosity function
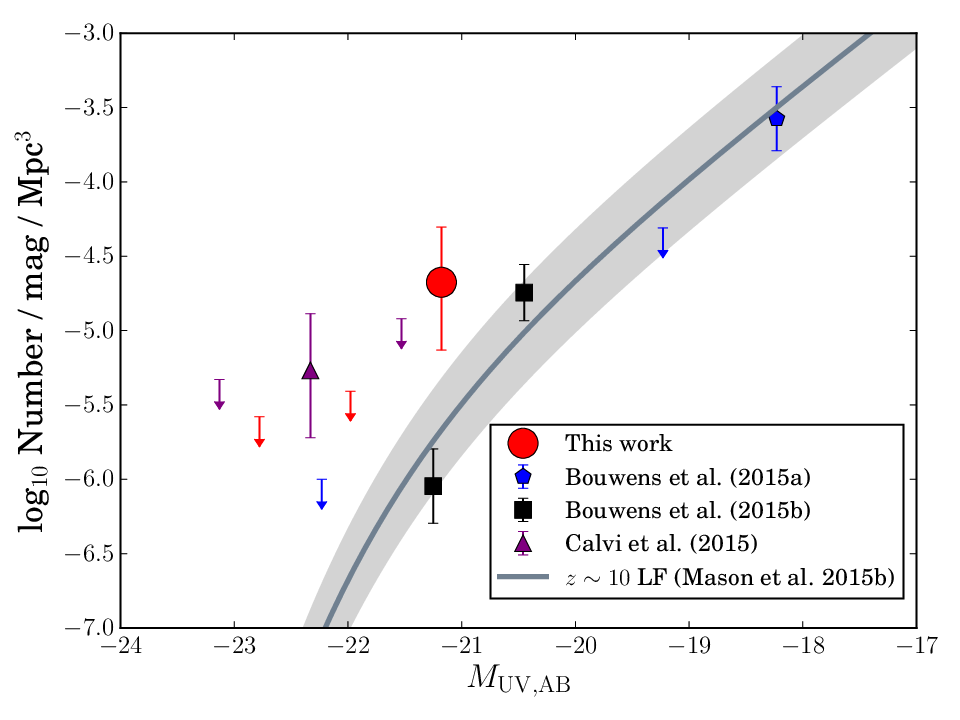
From the discussion in Section V.1, we consider the two brightest sources to be likely contaminants because of their large half-light radii, and we exclude the point-like source borg_1459+7146_785 as well. For the surviving three candidates we assume a contamination rate of , e.g. we expect two sources to be at . After taking into account the effective volume probed by our selection, our estimates for the bright-end of the luminosity function at is reported in Table 2, and shown in Figure 5. Interestingly, we infer a higher number density of bright sources than previous determinations by Bouwens et al. [15], Bouwens et al. [16] around , although the uncertainty is very large because of the small number of candidates. For brighter sources (), our upper limits on density are similar to those obtained in legacy fields, and strengthen the evidence for suppression of the abundance of galaxies at the bright-end of the luminosity function.
When compared to the initial results from the ongoing BoRG[z9-10] survey [18], assuming that our two brightest sources are low-redshift contaminants, we do not find evidence of ultra-bright () galaxies despite analyzing data covering more than twice the area. If follow-up observations of our brightest sources indicate that they are likely at high redshift, we would instead determine that the LF is higher at the bright end than the upper limit from Bouwens et al. [15], and is instead consistent with the determination by Calvi et al. [18] at .
Overall, our LF determination is higher, but still consistent at with the theoretical model of Mason et al. [45], shown as grey shaded area in Figure 5. Previous studies did not attempt unconstrained fits to the LF, likely because of the small number of candidates. To evaluate the status of the situation with our additional datapoints, we attempt to derive Schechter parameters for a maximum likelihood fit to the stepwise LF data, carried out assuming a Poisson distribution for the number of galaxies expected in each bin (see Bradley et al. 8). Due to the non-detection at by Bouwens et al. [15], the LF is suppressed at the faint end. This leads to a likelihood landscape that is very flat over a wide region of the parameter space, and hence, we are unable to sufficiently constrain the Schechter parameters. Our fit attempt thus highlights that the dataset is still too small for tight quantitative constraints, but future growth in the number of candidates identified will allow rapid improvements.
Finally, we note that our conclusions rest on the assumption that the two brightest candidates we identified in field borg_0240-1857 are contaminants. If we were to include them in the analysis as sources, we would infer that the LF would favor a power law at the bright end, rather than a Schechter form. Evidence for a single or double power-law form at high redshift has been seen in determinations of the LF at (Bowler et al. 17, Finkelstein et al. 27, also earlier considered by Bouwens et al. 13), and potentially at by Calvi et al. [18], and may be naturally interpreted as a decrease in mass quenching from processes such as AGN feedback at high redshift [17]. Magnification bias, however, can also produce this effect on an otherwise Schechter-like LF. Thus, the astrophysical interpretation of our search ultimately rests on follow-up observations to establish the nature of the candidates borg_0240-1857_129 and borg_0240-1857_369. In any case, it is very interesting to note that the number of potential candidate -dropouts that we identified is small (just six in over 60 fields), making further observations time-efficient, especially because half of the sources are clustered in a single pointing.
VI. Conclusions
In this paper we presented a search for candidates in archival data of the 2010-2014 Brightest of Reionizing Galaxies (BoRG[z8]) survey, a pure-parallel optical and near-infrared survey using HST/WFC3. While the survey was optimized to identify sources as -dropouts, we searched over the deepest 293 arcmin2 of the survey for -dropout sources with , motivated by recent identification of very bright sources with . Our key results are:
- •
We identify six galaxy candidates, detected in at S/N and satisfying a conservative color selection with non-detection in bluer bands of the survey. The candidate’s magnitudes vary from to . Analysis of the surface brightness profile leads to the tentative identification of three contaminants, with the two brightest sources likely being intermediate redshift passive galaxies due to their size, and one faint source a galactic cool dwarf star because of the compact size and high stellarity.
- •
Of the six candidates, three are in the same field, borg_0240-1857, including the two brightest of the sample. Such strong clustering would be naturally explained if the sources were (see Muñoz & Loeb 48), despite contrary indication from , but an alternative explanation of sub-halo clustering at intermediate redshift would also be viable.
- •
Based on our best estimate of the LF, we infer a higher galaxy number density for sources at compared to the observations of Bouwens et al. (2015a,b) and with the theoretical model of Mason et al. (2015b). However, our measurement is still consistent at the level with these studies.
- •
Irrespective of the nature of the two brightest sources in the sample, the selection criteria that we adopted yield a small number of candidates, very manageable for follow-up observations. This is quite remarkable, since the BoRG[z8] survey was not designed with in mind, and the number of contaminants could have been much larger given the absence of a second detection band and the lack of a near-UV color to help remove passive and dusty intermediate redshift galaxies.
- •
Targeted follow-up observations can efficiently clarify the nature of the candidates we identified, help to further constrain the bright-end of the LF and characterize the properties of the yet unstudied population of compact intermediate redshift passive galaxies that mimic the colors of sources.
The efficiency of targeted follow-ups and the overall potential to complement searches for sources traditionally carried out in legacy fields are demonstrated by the very recent award of Spitzer IRAC time to our team to investigate the nature of the sources discussed here (PID #12058, PI Bouwens). With these observations, it will be possible to clarify the behavior of the bright end of the LF at , as well as to confirm ideal targets for further spectroscopic follow-up investigations without having to wait for James Webb Space Telescope.
References
- [1] Alvarez, M. A., Finlator, K., Trenti, M. 2012, ApJ, 759, L38
- [2] Atek, H., Siana, B., Scarlata, C. et al. 2011, ApJ, 743, 121
- [3] Barone-Nugent, R. L., Trenti, M., Wyithe, J. S. B. et al. 2014, ApJ, 793, 17
- [4] Barone-Nugent, R. L., Wyithe, J. S. B., Trenti, M. et al. 2015a, MNRAS, 450, 1224
- [5] Barone-Nugent, R. L., Sonnenfeld, A., Wyithe, J. S. B. et al. 2015b, MNRAS, 453, 3068
- [6] Benítez, N., 2000, ApJ, 536, 571
- [7] Bertin, E. & Arnouts, S. 1996, A&AS, 117, 393-404
- [8] Bradley, L. D., Trenti, M., Oesch, P. A. et al. 2012, ApJ, 760, 108
- [9] Bouwens, R. J., Illingworth, G. D., Blakeslee, J. P., Broadhurst, T. J. & Franx, M. 2004, ApJ, 611, L1
- [10] Bouwens, R. J., Illingworth, G. D., Blakesless, J. P. & Franx, M. 2004, ApJ, 653, 53
- [11] Bouwens, R. J., Illingworth, G. D., Franx, M. & Ford, H. 2007, ApJ, 670, 928
- [12] Bouwens, R. J., Illingworth, G. D., Labbé, I. et al. 2011a, Nature, 469, 504
- [13] Bouwens. R. J., Illingworth, G. D., Oesch, P. A. et al. 2011b, ApJ, 737, 90
- [14] Bouwens, R. J., Bradley, L., Zitrin, A. et al. 2014, ApJ, 795, 126
- [15] Bouwens, R. J., Illingworth, G. D., Oesch, P. A. et al. 2015a, ApJ, 803, 34
- [16] Bouwens, R. J., Oesch, P. A., Labbé, I. et al. 2015b, arXiv:1506.01035v2
- [17] Bowler, R. A. A., Dunlop, J. S., McLure, R. J. et al. 2014, MNRAS, 440, 2810
- [18] Calvi, V., Trenti, M., Stiavelli, M. et al. 2015, arXiv:1512.05363
- [19] Caruana, J., Bunker, A. J., Wilkins, S. M. et al. 2012, MNRAS, 427, 3055
- [20] Casertano, S., de Mello, D., Dickinson, M. et al. 2000, AJ, 120, 2747
- [21] Coe, D., Zitrin, A., Carrasco, M. et al. 2013, ApJ, 762, 32
- [22] Curtis-Lake, E., McLure, R. J., Dunlop, J. S. et al. 2016, MNRAS, 457, 440
- [23] Ellis, R. S., McLure, R. J., Dunlop, J. S. et al. 2013, ApJ, 763, L7
- [24] Fall., S. M. & Efstathiou, G. 1980, MNRAS, 193, 189
- [25] Fialkov, A. & Loeb, A. 2015, ApJ, 806, 256
- [26] Finkelstein, S. L., Papovich, C., Dickinson, M. et al. 2013, Nature, 502, 524
- [27] Finkelstein, S. L., Ryan, R. E., Jr, Papovich, C. et al. 2015, ApJ, 810, 71
- [28] Giallongo, E., Menci, N., Castellano, M., Fontana, A., Grazian, A. & Pentericci, L. 2012, ApJ, 755, 124
- [29] Grazian, A., Fontana, A., Santini, P. et al. 2015, A&A, 575, A96
- [30] Grogin, N. A., Kocevski, D. D., Faber, S. M. et al. 2011, ApJS, 197, 35
- [31] Holwerda, B. W., Bouwens, R., Oesch, P., et al. 2015, ApJ, 808, 6
- [32] Huang, X., Zheng, W., Wang, J. et al. 2015, MNRAS, 801, 12
- [33] Illingworth, G. D., Magee, D., Oesch, P. A. et al. 2013, ApJS, 209, 6
- [34] Infante, L., Zheng, W., Laporte, N. et al. 2015, ApJ, 815, 18
- [35] Ishigaki, M., Kawamata, R., Ouchi, M., Oguri, M., Shimasaku, K., & Ono, Y. 2015, ApJ, 799, 12
- [36] Ishigaki, M., Ouchi, M. & Harikane, Y., 2015, arXiv150901751
- [37] Koekemoer, A. M., Fruchter, A. S., Hook, R. N. & Hack, W. 2003, in The 2002 HST Calibration Workshop: Hubble After the Installation of the ACS and the NICMOS Cooling System, ed. S. Arribas, A. Koekemoer, & B. Whitmore (Baltimore, MD: STScI), 337
- [38] Koekemoer, A. M., Faber, S. M., Ferguson, H. C. et al. 2011, ApJS, 197, 36
- [39] Labbé, I., González, V., Bouwens, R. J. et al. 2010, ApJ, 716, L103
- [40] Labbé, I., Oesch, P. A., Illingworth, G. D. et al. 2015, arXiv:1507.08313
- [41] Madau, P., Haardt, F., & Rees, M. J. 1999, ApJ, 514, 648
- [42] Madau, P. & Haardt, F. 2015, ApJ, 813, L8
- [43] Malhotra, A., Rhoads, J. E., Pirzkal, N. et al. 2005, ApJ, 626, 666
- [44] Mason, C. A., Treu, T., Schmidt, K. B. et al. 2015a, ApJ, 805, 79
- [45] Mason, C. A., Trenti, M. & Treu, T. 2015b, ApJ, 813, 21
- [46] McLeod, D. J., McLure, R. J., Dunlop, J. S., Robertson, B. E., Ellis, R. S., & Targett, T. A. 2015, MNRAS, 450, 3032
- [47] McLure, R. J., Dunlop, J. S., Bowler, R. A. A. et al. 2013, MNRAS, 432, 2696
- [48] Muñoz, J. A. & Loeb, A. 2008, MNRAS, 385, 2175
- [49] Muñoz, J. A. & Loeb, A. 2011, ApJ, 729, 99
- [50] Oesch, P. A., Stiavelli, M., Carollo, C. M. et al. 2007, ApJ, 671,1212
- [51] Oesch, P. A., Carollo, C. M., Stiavelli, M. et al. 2009, ApJ, 690, 1350
- [52] Oesch, P. A., Bouwens, R. J., Carollo, C. M. et al. 2010, ApJ, 709, L21
- [53] Oesch, P. A., Bouwens, R. J., Illingworth, G. D. et al. 2012, ApJ, 759, 135
- [54] Oesch, P. A., Bouwens, R. J., Illingworth, G. D. et al. 2013, ApJ, 773, 75
- [55] Oesch, P. A., Bouwens, R. J., Illingworth, G. D. et al. 2014, ApJ, 786, 108
- [56] Oesch, P. A., van Dokkum, P. G., Illingworth, G. D. et al. 2015, ApJ, 804, L30
- [57] Oke, J. B. & Gunn, J. E. 1983, ApJ, 266, 713
- [58] Pentericci, L., Fontana, A., Vanzella, E. et al. 2011, ApJ, 743, 132
- [59] Pentericci, L., Vanzella, E., Fontana, A. et al. 2014, ApJ, 793, 113
- [60] Planck Collaboration, Ade, P. A. R., Aghanim, N. et al. 2015, arXiv:1502.01589
- [61] Postman, M., Coe, D., Bénitez, N. et al. 2012, ApJS, 199, 25
- [62] Roberts-Borsani, G. W., Bouwens, R. J., Oesch, P. A. et al. 2015, arXiv:1506.00854
- [63] Schechter, P. 1976, ApJ, 203, 297
- [64] Schenker, M. A., Stark, D. P., Ellis, R. S. et al. 2012, ApJ, 744, 179
- [65] Schlafly, E. F., Finkbeiner, D. P. 2011, ApJ, 737, 103
- [66] Schmidt, K. B., Treu, T., Trenti, M. et al. 2014, ApJ, 786, 57
- [67] Schneider, P., Kochanek, C. S. & Wambsganss, J. 2006, Gravitational Lensing: Strong, Weak and Micro (Berlin: Springer)
- [68] Stark, D. P., Ellis, R. S., Bunker, A. et al. 2009, ApJ, 697, 1493
- [69] Stark, D. P., Ellis, R. S., Chiu, K., Ouchi, M. & Bunker, A. 2010, MNRAS, 408, 1628
- [70] Stark, D. P., Richard, J., Charlot, S. et al. 2015, MNRAS, 450, 1846
- [71] Stark, D. P., Walth, G., Charlot, S. et al. 2015, MNRAS, 454, 1393
- [72] Steidel, C. C., Giavalisco, M., Pettini, M., Dickinson, M., & Adelberger, K. L. 1996, ApJ, 462, L17
- [73] Tacchella, S., Trenti, M. & Carollo, C. M. ApJ, 768, L37
- [74] Tilvi, V., Papovich, C., Finkelstein, S. L. et al. 2014, ApJ, 794, 5
- [75] Trenti, M. & Stiavelli, M. 2008, ApJ, 676, 767
- [76] Trenti, M., Stiavelli, M., Bouwens, R. J. et al. 2010, ApJ, 714, L202
- [77] Trenti, M., Bradley, L. D., Stiavelli, M. et al. 2011, ApJ, 727, L39
- [78] Trenti, M., Bradley, L. D., Stiavelli, M. et al. 2012, ApJ, 746, 55
- [79] Treu, T. 2010, ARA&A, 48, 87
- [80] Treu, T., Trenti, M., Stiavelli, M., Auger, M. W. & Bradley, L. D. 2012, ApJ, 747, 27
- [81] Treu, T., Schmidt, K. B., Trenti, M., Bradley, L. D., & Stiavelli, M. 2013, ApJ, 775, L29
- [82] Turner, E. L., Ostriker, J. P.
- [83] van Dokkum, P. G. 2001, PASP, 113, 1420
- [84] Vanzella, E., Fontana, A., Pentericci, L. et al. 2014, A&A, 569, A78
- [85] Willott, C. J., Delorme, P., Omont, A. et al. 2007, AJ, 134, 2435
- [86] Wyithe, J. S. B., Yan, H., Windhorst, R. & Mao, S. 2011, Nature, 469, 181
- [87] Yan, H., Yan, L., Zamojski, M. A. et al. 2011, ApJ, 728, L22
- [88] Zheng, W., Postman, M., Zitrin, A. et al. 2012, Nature, 489, 406
- [89] Zheng, W., Shu, X., Moustakas, J. et al. 2014, ApJ, 795, 93
- [90] Zitrin, A., Zheng, W., Broadhurst, T. et al. 2014, ApJ, 793, L12
- [91] Zitrin, A., Labbé, I., Belli, S. et al. 2015, arXiv:1507.02679