Rotation in the Pleiades with K2: I. Data and First Results Note: Version from August 24, 2026
Abstract
Young (125 Myr), populous (1000 members), and relatively nearby, the Pleiades has provided an anchor for stellar angular momentum models for both younger and older stars. We used K2 to explore the distribution of rotation periods in the Pleiades. With more than 500 new periods for Pleiades members, we are vastly expanding the number of Pleiads with periods, particularly at the low mass end. About 92% of the members in our sample have at least one measured spot-modulated rotation period. For the 8% of the members without periods, non-astrophysical effects often dominate (saturation, etc.), such that periodic signals might have been detectable, all other things being equal. We now have an unusually complete view of the rotation distribution in the Pleiades. The relationship between and follows the overall trends found in other Pleiades studies. There is a slowly rotating sequence for , and a primarily rapidly rotating population for . There is a region in which there seems to be a disorganized relationship between and for . Paper II continues the discussion, focusing on multi-period structures, and Paper III speculates about the origin and evolution of the period distribution in the Pleiades.
I Introduction
The three most fundamental parameters of a star are its mass, its composition, and its angular momentum. Together, they determine how the star evolves from birth through the pre-main sequence phase to main sequence hydrogen burning, and beyond, and further, whether and how planets form and migrate. Angular momentum evolution is tied during star formation to cloud core fragmentation processes and stellar multiplicity, and during pre-main sequence evolution to star-disk interactions coupled with simple radial contraction and internal structural changes. Main sequence angular momentum evolution is dominated by spin-down due to mass loss and core-envelope coupling efficiencies. Although theoretical guidance addressing these matters for stars from Myr to Gyr ages has been significant (see,e.g., Bouvier et al. 2014 and references therein), the problems to be addressed are still lacking in empirical guidance in critical areas.
Because the Pleiades is populous (over 1000 members; e.g., Bouy et al. 2015), relatively young (125 Myr; Stauffer et al. 1998a), and nearby (136 pc; Melis et al. 2014), it has provided an anchor for stellar angular momentum models for both younger and older stars. As such, we need a thorough understanding of the rotational distribution of stars in the Pleiades. There is ample evidence that angular momentum evolution depends on stellar mass, so obtaining a reliable rotation distribution for stars of a wide range of masses is critically important. The NASA K2 mission (Howell et al. 2014), using the repurposed 1-m Kepler spacecraft, observed the Pleiades cluster nearly continuously for 72 days, enabling us to probe rotation rates to lower masses and to higher precision than ever before.
The Pleiades has been extensively studied for decades (e.g., Trumpler 1921, Hertzsprung 1947, Johnson & Mitchell 1958), and more recent surveys (e.g., Lodieu et al. 2012, Sarro et al. 2014, Bouy et al. 2015) have identified candidate members down to at least 0.03 M☉ (18, or 22), past where K2 can obtain a viable light curve in the Pleiades (14.5, or 18). More than 1000 candidate members for the Pleiades were included in K2’s Campaign 4, down to mass 0.09 M☉.
The rotation of stars in the Pleiades has been the subject of study for quite some time, both spectroscopically (e.g., Anderson, Kraft, & Stoeckly 1966, Stauffer & Hartman 1987, Soderblom et al. 1993a,b, Terndrup et al. 2000, Queloz et al. 1998) and photometrically (e.g., van Leeuwen et al. 1987, Stauffer & Hartmann 1987, Stauffer et al. 1987, Prosser et al. 1993a,b, 1995). There have been two recent extensive photometric surveys of Pleiades rotation periods. Hartman et al. (2010) used the Hungarian Automated Telescope Network (HATNet) to obtain rotation periods for nearly 400 Pleiades members down to 0.4 M☉, with estimated completeness to 0.7 M☉. More recently, Covey et al. (2016) present new rotation period observations for more than 100 Pleiads from the Palomar Transient Facility (PTF), which greatly expanded the known periods for lower mass Pleiads down to 0.18 M☉. These ground-based surveys, however, necessarily were biased towards larger amplitude variability, and against periods near 1d.
Because K2 provides precision, sensitivity, and continuous (as opposed to diurnal) time coverage, in the present paper we push the known periods down to lower mass and lower amplitude than has ever been done before in the Pleiades. In the process of doing this, we have found other repeated patterns in the light curves (LCs). We have already scoured the K2 data for eclipsing binaries (David et al. 2015, 2016). Other periods that do not appear to be spot-modulated rotation periods are included in the Appendix. The rest of the periods are nearly all consistent with spot-modulated rotation periods (though a few are likely pulsation; see Paper II).
In Section II, we present the observations and data reduction, as well as assembly of Pleiades members out of the 1020 K2 LCs of candidate Pleiads. The overall distribution of K2-derived rotation rates is discussed in Section III. Section IV summarizes our main results.
This is the first of three papers focused on rotation periods in the Pleiades. Paper II, Rebull et al. (2016), discusses the several types of LCs and periodogram structures that we found in the K2 data, and some of the properties of these multi-period stars. Stauffer et al. (2016), Paper III, speculates about the origin and evolution of the period distribution in the Pleiades.
II Observations and Methods
II.1 K2 Data
Members of the Pleiades were observed in K2 campaign 4, which lasted for 72d. Note that the field of view is not centered on the cluster; see Fig. 1. All of the stars shown were observed in the long-cadence (30 min exposure) mode. Thirty-four of these stars were additionally observed in fast cadence (1 min exposure), but those data are beyond the scope of the present paper. There are 1020 unique K2 long-cadence light curves.

Kepler pixel sizes are relatively large, , and the 95% encircled energy diameter ranges from 3.1 to 7.5 pixels with a median value of 4.2 pixels. During the K2 portion of the mission, because only two reaction wheels can be used, the whole spacecraft slowly drifts and then repositions regularly every 0.245 d.
We have used several different sets of LCs employing different reductions. (1) The pre-search data conditioning (PDC) version generated by the Kepler project and obtained from MAST, the Mikulski Archive for Space Telescopes. (2) A version with moving apertures obtained following Cody et al. in prep. (3) A version using a semiparametric Gaussian process model used by Aigrain et al. (2015, 2016). (4) The ‘self-flat-fielding’ approach used by Vanderburg & Johnson (2014) as obtained from MAST. We removed any data points corresponding to thruster firings and any others with bad data flags set in the corresponding data product. The times (as shown in figures in this and our subsequent papers) are Kepler baricentric Julian day.
We inspected LCs from each reduction approach, and we selected the visually ‘best’ LC from among the four, such as the LC with the least discontinuities, or the one with the least overall trend, or the one least subject to saturation effects, etc. Out of our entire sample of 1020 LCs, the PDC LC was the best for 58% of the sample, 11% of the LCs had the best version from Aigrain et al., 8% had the best version from Cody et al., and 5% of the LCs were best in the Vanderburg & Johnson approach. It is important to note that in most cases, the period appears as a significant peak in the periodograms for all four LC versions, but the subtleties of the processing mean that one version is slightly better than another and is the one that we used to obtain the periods reported here. In general, the PDC LC was best for 3 d; both the Aigrain and Vanderburg approaches were on average best for the longer periods. For 18% of the 1020, it was not clear which was the best LC, either because the LC was saturated (too bright) or too faint, or adversely affected by nearby bright stars, or all the LC versions were different enough that no one LC could be selected as the best and most reliable. None of these latter confusing LCs were found to be periodic.
In two cases, there are pairs of lightcurves that are indistinguishable. EPIC 211076026 and 211076042 are ADS2755A and ADS2755B, which are sometimes jointly referred to as HII956 or HD 23479. These two stars are a visual binary with a separation of 0.7, so close that the K2 light curves are effectively identical. We dropped 211076026 and kept 211076042; the LC is not periodic. EPIC 211066337 (HII298) and EPIC 211066412 (HII299) are functionally indistinguishable light curves. They are a visual binary separated by 6. We have kept EPIC 211066337 and dropped EPIC 211066412. The net LC in EPIC 211066337 has two periods, 6.156, and 2.932 d, and we suspect that is one period per binary component (see Paper II).
II.2 Finding Periods
We looked for periodic signals using primarily the NASA Exoplanet Archive Periodogram Service11 1 http://exoplanetarchive.ipac.caltech.edu/cgi-bin/Periodogram/nph-simpleupload (Akeson et al. 2013). This service provides period calculations using Lomb-Scargle (LS; Scargle 1982), Box-fitting Least Squares (BLS; Kovács et al. 2002), and Plavchan (Plavchan et al. 2008) algorithms. We also looked for periods using CLEAN (Roberts et al. 1987).
In practice, though, the periodic signals are generally not ambigous and any method yields very similar periods. Different LC versions can make more of a difference in the derived period than different period-finding algorithms because of the influence of artifacts. We used LS for the analysis discussed here, because most of the periodic signals are sinusoidal.

Some LCs, periodograms, and phased LCs can be found in Fig. 2. These are representatives from a range of brightnesses and periods. The power spectra indicate unambiguously periodic signals – the peak is so high that little structure other than the peak can be seen in the power spectrum, and when there is substructure, it is a harmonic of the main signal. (However, see Paper II for multi-periodic stars.) For signals like those in Fig. 2, the false alarm probability (FAP) returned by the LS algorithm is 0; for 97% of the sample with periods, the FAP of the main peak is very small, 0. For many stars, the FAP of the second or third peak is also 0, which gives rise to the multi-periodic discoveries in Paper II. The only situations in which we took a star to be periodic when the FAP for the peak calculated over the whole LC was not 0 were situations in which, e.g., half the LC was corrupted by instrumental effects and thus we took a derived from the unaffected portion (which then meant that the FAP computed for that peak on that portion of the LC was very low), or the three stars in Sec. II.3.1 where there is a clear peak at the same location as others found for this star in an independent dataset, even if the formal FAP calculated for that peak from the K2 data was high.
For stars of the mass range considered here, the periods that we measure are, by and large, star spot-modulated rotation periods. Spot modulation is the simplest explanation for sinusoidal (or sinusoidal-like) variations where there are changes over an entire rotation phase.

To be conservative, we required at least 2 complete cycles of a pattern to call it periodic, thus the maximum period we searched for was 35 d. We do not expect Pleiades members to be rotating more slowly than 35d. Indeed, the distribution of periods we found (see Figure 3) is strongly peaked at 1 day; only 3% of the periods over all 1020 LCs (not just members identified in Sec. II.5 below) are longer than 10 d. Because the number of rotation periods falls off so strongly, we suspect that few or no legitimate rotation periods of Pleiades members are 35d, and our approach is not unduly biasing our derived distribution of rotation periods in the Pleiades. There may be some patterns that are repeated on timescales longer than 35d, but they are not rotation periods – the shapes of the LCs are much different than the rotation periods in the data.
Additionally, by inspection of individual LCs, we deemed some periodic signals with periods shorter than 35 d to not necessarily be rotation periods. Two objects, EPIC 211082420 (HII1431) and 210822691 (AKII465) are eclipsing binaries (see David et al. 2015, 2016). We have removed these periods from our sample because they are not spot-modulated rotation periods (AKII465 is also likely not a member of the Pleiades). There are other eclipsing binaries in our data, but for those, there is also a periodic signal from the primary, which we retain here because it is likely to be a rotation rate; see, for example, 211093684/HII2407 in David et al. (2015). There are 28 additional objects that have features in their LS periodograms that suggest possible periods 35 d, but that which we believe are not unambiguously periodic. Those stars are listed Appendix B for reference and those periods have been removed from subsequent analysis.
We find periods for 798 out of our sample of 1020 K2 LCs of candidate Pleiads. However, not all of those stars may be members; see Sec. II.5.
II.3 Comparison to Literature Values
II.3.1 Literature Periods
In order to verify our period-finding approach, it is useful to compare to prior Pleiades results. There are two recent papers that obtain periods in the Pleiades from large-field photometric monitoring. Hartman et al. (2010) used HATNet and reported periods for 383 Pleiads. We have 225 periodic objects in common (given spatial and brightness constraints), and we agree to within 10% of the derived for 85% of the objects; see Figure 4. The median fractional difference () is 0.7%. Covey et al. (2016) used PTF and report periods for 138 Pleiads. We have 75 periodic objects in common with this study (again, given spatial and brightness constraints), and 92% of them agree to within 10% of the derived ; see Figure 4. The median fractional difference is 0.07%.


For each of the targets in which we have periods that disagree (or in which the literature reports a period that we did not find), we inspected our LC and associated power spectrum in some detail. There are several bright targets for which we failed to find a period where others did; in the K2 data, the star is just too bright for the data reduction used here. For most of the stars where our period is very discrepant from the published one, we believe our period is correct for the stars at the time that we observed them. These discrepancies may be telling us something about the long-term spot distribution and/or spot evolution, but the details of that are beyond the scope of the present paper. 211089068/HII1348 has a period in Hartman et al. that is not quite a harmonic; they report 4.562d and we have 9.773d. In three cases, the power spectrum and phased LC derived from our data alone are not as convincing as other sources in this study (e.g., the FAP is not 0 for these periodogram peaks), but since they independently recover the same period as reported in Covey et al., we have opted to keep them. They are 210978953/HHJ114, 211055493/JRS26, and 211083672/HCG253.
We conclude that our approach to finding periods is working at least as well as those in the literature.

Figure 5 demonstrates the range of magnitudes to which the various studies are sensitive. The Hartman et al. (2010) study focused on the brighter stars, and the Covey et al. (2016) study focused on the fainter stars. This work, with K2, increases the numbers of periods known overall, but makes a more significant contribution of new periods for the fainter (lower mass) stars. Note that this plot includes periods for the 798 out of our 1020 K2 light curves; the literature reports periods for 500 (candidate) Pleiads, so we have more than doubled the number of known periods for candidate Pleiads. (However, not all of the K2 LCs are for likely member stars; see Sec. II.5.)
In the subsequent analysis here, we made a decision to not include periods from these literature studies for objects that did not have a K2 light curve, which omits 220 periods (not all of which may be members). Since the K2 target selection is primarily biased in position (Fig. 1), and since rotation period is not a function of the location in the cluster, this does not affect our conclusions.
II.3.2 Literature
Much early work on rotation in the Pleiades was done on projected rotational velocities, . Figure 6 shows the relationship between and for stars in this study for which there are values in the literature (see section II.4). The and agree well overall, which is an indication that we are measuring the rotation rate for these stars. The and do not agree well for two cases, 210996505/HII1132, and 211138217/HII1766. These are both earlier type stars which likely have a secondary component, where the is probably from the primary, and the is from the lower-mass secondary (see Paper III).

Both Jackson & Jeffries (2010) and Hartman et al. (2010) have already looked at the distribution of in the Pleiades in detail. This kind of analysis is limited by the number of values known; although we are adding many periods here, there are no new values.
II.4 Supporting Data from the Literature
We assembled a catalog of photometric data for all of our targets from the literature, including Johnson & Mitchell (1958), Stauffer et al. (1998a,b), Stauffer et al. (2007), Kamai et al. (2014), and Bouy et al. (2015). We added to this data from the Two-Micron All Sky Survey (2MASS; Skrutskie et al. 2006), from the Spitzer Space Telescope (Werner et al. 2004), including measurements from Sierchio et al. (2010) and the Spitzer Enhanced Imaging Products, SEIP22 2 http://irsa.ipac.caltech.edu/data/SPITZER/Enhanced/SEIP/overview.html, from the Widefield Infrared Survey Explorer (WISE; Wright et al. 2010), from SIMBAD’s listing of the Tycho catalog (ESA 1997), and from the United States Naval Observatory (USNO) Robotic Astrometric Telescope (URAT; Zacharias et al. 2015).
Ideally, we would have or mass for all of our targets. However, those quantities can be very model-dependent. Because we preferred to keep our discussion of the new K2 rotation period data on an empirical basis to the extent possible, our goal was to use an observed color as the proxy for mass or . The broad-band color that acts as the best such proxy over the entire mass range for which we have periods is . While is widely available from 2MASS, is harder to find. We only have measured band photometry for about half of the periodic stars; it was necessary to estimate magnitudes from other photometry for the rest.
The highest quality band photometry we have is from phototube photometry reported in Johnson & Mitchell (1958), Landolt (1979), Stauffer & Hartmann (1987) or references therein, or CCD photometry from Kamai et al. (2014). Additional band photometry, generally for fainter members, was obtained using CCD cameras on small telescopes by Prosser et al. (1991) and Stauffer et al. (1998b). For the remaining stars (mostly faint M dwarfs), we have adopted measured photometry at bands near in wavelength to . Specifically, we have adopted or magnitudes from SDSS-filter images reported in Bouy et al. (2013) or Bouy et al. (2015), or “” magnitudes (a very broad-band red filter) provided with the initial release of the URAT catalog (Zacharias et al. 2015) for all Pleiades members for which those quantitities are reported. For the stars for which we also have measured magnitudes, we have then derived transformations between , and and ; Figure 7 shows the data for one such transformation. For each of these three data sources, the photometry appears to have similar accuracies as the available band photometry, and the transformations are well-defined and not strongly curved. The three polynomial relations are:
| (1) |
| (2) |
| (3) |

For most stars, we have these estimated values from all three sources. When we have a measured , we use that; when we do not have a measured , we use the average estimated . Note that this is , not , that is K-short from 2MASS, not Kepler magnitude; is used throughout this paper, and not .
We assume that the typical reddening in the direction of the Pleiades applies: = 0.12, = 0.01, = 0.04 (Crawford & Perry 1976). There are four stars with K2 LCs that have larger reddening (HII476, HII870, HII1039, & HII1136); for these, we used reddening corrections from Soderblom et al. (1993b) and Breger (1986). Below, Tables 2, 3, and 6 include the observed and where available, from which one can derive the observed ; the that we used is explicitly included.
II.5 Membership and Definition of Sample
In order to establish the best possible set of Pleiades members, we evaluated each object using a combination of proper motions and photometric position in an optical color-magnitude diagram (CMD). We primarily used membership probabilities based on recent proper motion studies, Bouy et al. (2015); see also Sarro et al. (2014) and Lodieu et al. (2012)33 3 All objects analyzed by Lodieu et al. appear in Bouy et al.. Some Lodieu et al. members are reassigned in Bouy et al. which has better proper motions and photometry. See discussion in Sarro et al. (2014).. For objects where the membership probability and the photometric position were inconsistent, we evaluated stars on a case-by-case basis, comparing information from many sources, such as positions and proper motions, radial velocities, X-ray flux, IR flux, and H equivalent width. These values are from the literature, including Trumpler (1921), Hertzsprung (1947), Johnson & Mitchell (1958), Ahmad et al. (1965), Iriarte (1967), Artyukhina and Kalinina (1970), Jones (1970, 1973), Breger (1972, 1986), Morel & Magnenat (1978), Landolt (1979), Vasilevskis et al. (1979), Stauffer et al. (1984), van Leeuwen et al. (1986, 1987), Stauffer & Hartmann (1987), Jameson & Skillen (1989) Mermilliod et al. (1997, 2009), Micela et al. (1990, 1999), Prosser et al. (1991), Stauffer et al. (1991), Rosvick et al. (1992), Soderblom et al. (1993a), Kazarovets (1993), Hodgkin et al. (1995), Schilbach et al. (1995), Martin et al. (1996), Wang et al. (1996), Burkhart & Coupry (1997), Zapatero Osorio et al. (1997), Belikov et al. (1998), Stauffer et al. (1998a,b), Queloz et al. (1998), Malaroda et al. (2000), Pinfield et al. (2000, 2003), Ducati (2002), Deacon & Hambly (2004), Li et al. (2004), Scholz & Eislöffel (2004), Mermilliod (2006), Fox Machado et al. (2006, 2011), Gebran & Monier (2008), Renson & Manfroid (2009), Roeser et al. (2010; PPMXL), Lodieu et al. (2012), Zacharias et al. (2013; UCAC4), Cottaar et al. (2014), and Zacharias et al. (2015; URAT).
Our membership analysis usually began with the location of the star in a vs. CMD; in many cases, we also looked at other CMDs in order to make sure that a bad measurement in one band was not causing a discrepant CMD location. Next usually we looked at proper motion measurements in multiple studies (including the all-sky surveys like PPMX, UCAC4, URAT, etc.), again in order to attempt to minimize the influence of single “bad” measurement. If those steps did not yield an unambiguous decision, we next looked at all references to the star in SIMBAD in order to, for example, determine if any previous study had determined radial velocities or lithium equivalent widths or other data from which membership could be inferred (such as X-ray data). In a very few cases, we obtained new spectra to help determine membership (see Paper III). This process was qualitative in the sense that we weighted all of the information in a subjective manner. However, the process was also extensive, with each star considered individually and with all available information considered in detail. Based on the location of these stars in the CMD (Fig. 8) and the fact that most of the non-members show no period in their K2 data (also Fig. 8), we believe in the great majority of cases we have made the right decision.
As a result of this analysis, we have a set of our highest confidence members, for which there is considerable data supporting membership (often abbreviated as ‘best members’), and a set of non-members (NM). There is also a set of lower-confidence members (often abbreviated as ‘ok members’), where the evidence for membership is suggestive but not conclusive (e.g., all the proper motion studies said it was an unambiguous member, but it was slightly too high or too low in one of the optical CMDs, and had insufficient data to place it in the other optical CMDs). Our final list of members (best or ok) is in Table 2 (for the periodic members) and Table 3 for the rest, and is what we carry forward here. The list of objects we investigated with K2 LCs but that we believe are not Pleiades members appears in the Appendix, along with derived periods where relevant. Figure 8 shows the optical CMD, vs. , for stars with K2 LCs and for which we could obtain or calculate and . Many of the objects we took to be NM are clearly in a position inconsistent with membership.
Figure 8 also shows our effective bright and faint cut-offs. For and (or and ), the K2 LCs are either too bright or too faint to yield reliable periods using our approach. These objects are dropped from our sample going forward, and appear as a list in the Appendix.

| Name | Number | Description |
|---|---|---|
| Initial sample | 1020 | All K2 LCs of candidate Pleiades members. |
| Best members | 775 | Highest-confidence (our determination) Pleiades members with K2 light curves, and neither too bright nor too faint (614.5). |
| OK members | 51 | Lower-confidence (our determination) Pleiades members with K2 light curves, and neither too bright nor too faint (614.5). |
| The sample, a.k.a. the sample of members | 826 | The set of all high-confidence (‘best’) plus lower-confidence (‘ok’) members that are neither too bright nor too faint (614.5); a.k.a. ‘members of the right brightness range.’ |
| The periodic sample | 759 | The subset of all high-confidence (‘best’) plus lower-confidence (‘ok’) members that are neither too bright nor too faint (614.5) and are found to be periodic by us in these K2 data. |
Our set of members consists of 799 high-confidence (‘best’) Pleiades members and 54 more lower-confidence (‘ok’) members, for a total of 853. Thus, we find that 167 of the candidate Pleiads with K2 LCs are unlikely to be members (see Appendix). Omitting the too bright and too faint stars for our sample, there are 775 high-confidence members, with 51 more lower-confidence members (for a total of 826 members). Out of those 775 (best members), 716 (92.4%) have at least one measured period that we believe in the overwhelming majority of cases to be a rotation period and due to star spots. Including the lower confidence members, 759/826 (91.9%) have at least one measured period that we believe to be the rotation period. Table 1 summarizes the most important of these numbers. Table 2 includes all of these members and their measured periods. This sample of members (both ‘best’ and ‘ok’) that are within 614.5 is hereafter the set of ‘members of the right brightness range,’ and is what our analysis is based on (unless otherwise specified). An online-only figure set with one set of plots (like those in Fig. 2) for each star can be found in Appendix F.
We also scoured the literature for any information about binarity. This information came from: Abt et al. (1965), Anderson et al. (1966), Stauffer et al. (1984), Liu et al. (1991), Mermilliod et al. (1992), Rosvick & Mermilliod (1992), Soderblom et al. (1993b), Bouvier et al. (1997), Queloz et al. (1998), Raboud & Mermilliod (1998), Geissler et al. (2012), and Kamai et al. (2014). We note here that most of these literature surveys focused on the brighter sources, and there are K2 data for many fainter stars. We discuss more about binaries below, primarily in Sec. III.2, and in Papers II and III. (Note that Paper III also includes a description of how we identified photometric binaries.)
II.6 Members Not Detected As Periodic
As can be seen in Fig. 8, about 8% of the sample are not detected as periodic in our data (see Appendix A for example LCs and power spectra). For these stars, one or more of these criteria are met: (a) no periodogram peaks with very low FAP in the LS output; (b) periodogram peak(s) change position significantly between LC versions, or the purported periodic signal appears as a peak in the periodograms in only one LC version; (c) phased LC does not look convincing (e.g., a wide distribution of fluxes at most phases) because the pattern is not well-repeated from cycle to cycle; (d) LC obviously and signficantly affected by instrumental effects (e.g., bimodal distribution of flux values originating from saturated pixels); (e) rarely, the repeated pattern is not consistent with spot modulation. A list of those in the last category appear in Appendix B.
Some of these not-detected-as-periodic members can be found at nearly every color. The K2 data are exquisite, and we expect all stars to rotate, and low-mass stars as young as the Pleiades should have large starspots. There are several possible explanations as to why we do not detect these stars to be periodic. These stars could have periods much longer than 35d, which is very unlikely for the Pleiades. Despite our best efforts, these stars could actually be non-members (and thus could have a period much longer than 35 d; with only 72 d of data, it would be hard to reliably identify a period much longer than 35 d). It could be that these stars have periodic variations on timescales 35 d but at a lower level than we can detect, perhaps from smaller spots/spot groups. The stars could have a rotation axis that is pole-on, such that there really is little to no variation detectable from our Solar System. Alternatively, they could have disorganized spots distributed more or less homogeneously that preclude a reliably periodic signal in the LC. In about half of the cases, however, these LCs are corrupted by instrumental effects in the data reductions we have; either the stars are too bright themselves for reliable LCs, or nearby bright stars adversely affect the extracted LCs44 4 Other investigators have methodologies to extract photometry and derive periods for very bright (saturated) stars (e.g., White et al. 2015), but these are not included here, in part because we do not have access to those data reductions, but also because we are primarily interested in the FGKM stars.. There are also several LCs that are just effectively too faint (poor signal-to-noise ratio, SNR) for viable periods to be extracted from the data reductions we have. A period might have been detected for many of these not detected as periodic member stars if the saturation level was higher, or the exposures different (longer for the poor SNR, shorter for the saturated), or if the star was located elsewhere on the CCD. Since we already detect periods in a very large fraction of the members, were it not for these non-astrophysical effects, the fraction could be even closer to 1. This is different than prior studies of rotation in clusters, and it means that we have an unusually complete view of the rotation distribution in the Pleiades.
Basic parameters for these stars not detected as periodic are listed in Table 3. Five of these stars have reported periods in the literature which we do not recover; see Table 3.
| Label | Contents |
|---|---|
| EPIC | Number in the Ecliptic Plane Input Catalog (EPIC) for K2 |
| coord | Right ascension and declination (J2000) for target |
| Vmag | V magnitude (in Vega mags), if observed |
| Kmag | magnitude (in Vega mags), if observed |
| vmk0 | – dereddened , directly observed (if and exist) or inferred (see text) |
| P1 | Primary period, in days (taken to be rotation period) |
| P2 | Secondary period, in days |
| P3 | Tertiary period, in days |
| P4 | Quaternary period, in days |
| ampl | Amplitude, in magnitudes, of the 10th to the 90th percentile |
| LC | LC used as ‘best’aaLC1=PDC, from MAST; LC2=version following Cody et al. in prep; LC3=version following Aigrain et al. (2015, 2016); LC4=version reduced by Vanderburg & Johnson (2014) and downloaded from MAST. |
| memb | Membership indicator: Best, OK, or NM |
| Plit | Literature (rotation) period, in days, if available |
| vsini | Literature , in km s-1, if available |
| EPIC | RA, Dec (J2000) | other name | (mag) | (mag) | ccDereddened , directly observed (if and exist) or inferred (see text). (mag) | Membership |
|---|---|---|---|---|---|---|
| 210784603 | 033103.57+193805.1 | s3289407 | … | 10.13 | 3.77 | best |
| 210899735 | 033202.35+212310.8 | … | … | 12.11 | 4.89 | best |
| 210904850 | 033211.53+212756.1 | UGCSJ033211.55+212755.7 | … | 13.90 | 7.11 | best |
| 210971138 | 033310.49+223119.3 | DH027 | 15.55 | 11.25 | 4.19 | best |
| 211029507 | 033518.74+232621.0 | DH045 | … | 13.98 | 6.22 | best |
III Period and Period-Color Distributions
As discussed above, the overwhelming majority of the periods we have determined are spot-modulated rotation periods of the stars. We can now proceed to investigate the distribution of rotation rates. In this section, we investigate the rotation distribution against color. Note that that we have selected only one (and ) to be representative of the rotation period (and color) in the 22% of the stars for which there are more than one period recovered (see Paper II).
III.1 Morphology of vs.

Figure 9 shows the relationship between and for the sample. It follows the overall trends found in other Pleiades studies (e.g., Covey et al. 2016, Hartman et al. 2010). There is a slowly rotating sequence for (211 d), and a primarily rapidly rotating population for (0.1 2 d). There is a region in which there seems to be a disorganized relationship between and between (0.2 15 d).
Another important thing to note is that the lower-confidence members still follow the overall trends here; there is no compelling evidence from this plot per se to move those lower-confidence members into the non-member set. (In contrast, see Appendix D and Fig. 16 below.)
Among the long-period outliers in this plot, there are five stars with periods longer than 12 days, one of which is a lower-confidence member, but four of which are high confidence members. Those long- outliers are curious, since they seem out of place relative to the other members. These stars are discussed further in Paper III, though we highlight one here. We have taken EPIC 210855272/DH668 to have a period of 17.6 d for the reasons discussed in Paper II; that seems to be the best period. However, if we take =8.9 d (the other peak that appears in the periodogram), then this star would no longer be a long-period outlier; for its , it would have a more consistent with other stars of its color. It has H in absorption, but this may be acceptable for =3.6 mag. At that color, it has the largest H absorption equivalent width in the Pleiades, comparable to a field star at that color. It has a 60% chance of being a member according to Deacon & Hambly (2004), and a 72% chance of being a member in Bouy et al. (2015); based on that, we have it as a lower-confidence member.
Among the blue short-period outliers, the stars we identify as pulsators in Paper II have demonstrably shorter periods on average (and are among the bluest stars) than the rest of the ensemble, and this matches expectations. There are other very blue stars that are not quite among the shortest periods. Their LC morphology are more suggestive of rotation than pulsation. The stars with 0.3 d could also be pulsators (see Paper II). Normal A and F stars should not have spots, though Am stars could have spots (e.g., Balona et al. 2015). They could also be unresolved binaries, where the corresponds to the primary, but the corresponds to the fainter, lower-mass, spotted secondary.
III.2 Binaries
Whether a star is single or is one component of a binary could affect the measured rotation period we detect in the K2 Pleiades data. This might be true because the formation mechanism for single and binary stars might have different dependencies on either the initial angular momentum of the collapsing cloud core or on how much of that angular momentum is retained in the ZAMS descendents of that process. In addition, being a member of a binary will affect the photometric colors we measure and the signal-to-noise properties of any periodic signature that we measure in the K2 data. We therefore have searched for the possible influence of binarity on the period distribution that we have measured. The discussion about the influence of binarity continues in Papers II and III.
We assembled binary information from the literature (see Sec. II.5) from spectroscopy, radial velocities, high spatial resolution imaging, and new Robo-AO data (Riddle et al. in prep). The advantage of this inhomogenous data set is that we have a chance of identifying all of the binaries, but the disadvantage is that many existing surveys were limited spatially or limited by stellar brightness such that lack of binarity from this collection of data may actually reflect a lack of information rather than anything else. Figure 10 shows where these literature binaries fall in the CMD; Figure 11 shows vs. with the literature binaries highlighted. In these figures, visual binaries, spectroscopic binaries, binaries from adaptive optics (AO) observations, and eclipsing binaries are indicated separately. It is clear that most of the literature methods focused on bluer (brighter) stars. About 10% of the sample is tagged binary in the literature.
We can also use the optical CMD assembled here (Fig. 8) to more uniformly identify photometric binaries by the stars’ location in the CMD (see Paper III for details of this process). The advantage of this approach is that we can identify binaries with uniform sensitivity through the whole viable range of our data. The disadvantage is that we will miss binaries whose masses are significantly different from each other (i.e., causing only small shifts in the CMD). Figure 10 shows the CMD, and Figure 11 shows vs. , for photometric binaries selected via this approach; about 16% of the sample is tagged binary.
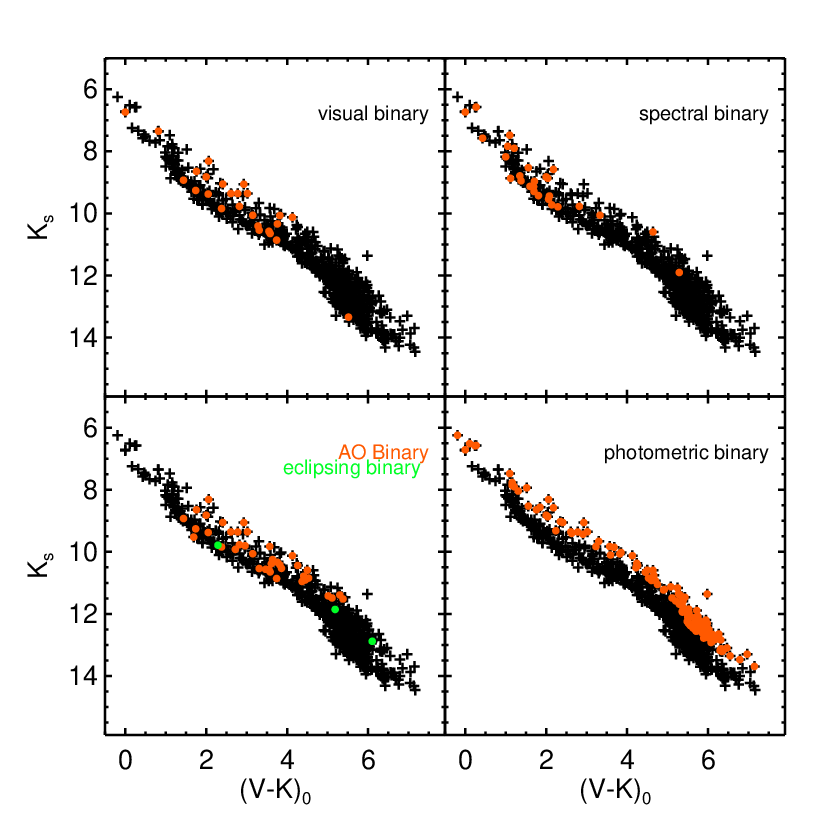

The slow sequence has relatively few binaries identified, except for the spectroscopic binaries, and these are nearly all cases where no secondary has been directly detected. In these cases, the secondary is generally much fainter than the primary, and the secondary is therefore unlikely to be significantly affecting the K2 light curves. Even in the cases of the visual binaries in the slow sequence, many of the secondaries are much fainter than their primaries, and here too, the secondaries are unlikely to have much of an impact on the K2 light curves of these stars. Since the primary stars are in the ‘right place’ in the vs. diagram for stars of their (mass), we infer that there is little influence on the primary’s rotation rate by the much lower mass secondary for these binaries.
We continue the discussion about the influence of binarity in Papers II and III.
III.3 Amplitudes
We calculated the amplitude of the light curves in magnitudes by assembling the distribution of all points in the light curve, taking the log of the 90th percentile flux, subtracting from that the log of the 10th percentile flux, and multiplying by 2.5. Figure 12 plots that amplitude against both and for the periodic light curves. While the lower amplitude variations are found at all periods, they tend to cluster at bluer colors; stars bluer than about 1.1 (see Paper III) have distinctly lower amplitudes. Some of these stars are likely pulsators, which accounts for the lower amplitude. Some are probably unresolved binaries, where the amplitude of the flux variation from the companion (causing the periodicity) is lessened by the flux from the primary. The median of the amplitude distribution (with or without the 1.1 stars) is 0.030 mag.

The outlier with the very large amplitude is 211010517/UGCSJ040234.77+230828.4 and it has a large amplitude because of a large-scale trend that is superimposed on the periodic light curve. We have taken it to be one of the best (high-quality) members, but it is just barely in the expected location in the CMD to be placed in the best member subset.
Aside from the outliers at the small and large amplitude ends of the distribution, there does not seem to be a trend with color or period.
IV Conclusions
We have presented the first part of our analysis of the K2 Pleiades lightcurves, in the process vastly expanding the number of Pleiades members known with periods, particularly at the low mass end. About 92% of the observed Pleiades members have at least one measured period, the overwhelming majority of which we believe to be spot-modulated rotation periods. For the 8% of the members without periods, non-astrophysical effects often dominate (saturation, etc.), such that periodic signals might have been detectable, all other things being equal. We now have an unusually complete view of the rotation distribution in the Pleiades.
The overall relationship between and follows the overall trends found in other Pleiades studies. There is a slowly rotating sequence for (211 d), and a primarily rapidly rotating population for (0.1 2 d). There is a region in which there seems to be a disorganized relationship between and between (0.2 15 d).
Thanks in no small part to the many low-mass fast rotators, the distribution of periods peaks strongly at 1 day; only 3% of the periods are longer than 10 d. The typical amplitude of the variation (between 10-90% of the distribution of points) is 0.03 mag. Some much lower amplitudes can be found at the bluest colors, which could be from pulsation or a consequence of binarity (where the lower-mass, fainter star is responsible for the spot-modulated rotation period).
Our periods agree well with the literature periods and literature . There is no simple way to distinguish binaries from single stars in the vs. parameter space.
About 70% of the periodic stars have a single, essentially stable period. However, we have discovered complicated multi-period behavior in Pleiades stars using these K2 data, and we discuss this further in Paper II. Paper III (Stauffer et al. 2016) continues the discussion by speculating on the origin and evolution of the periods in the Pleiades.
References
- [1] Abt, H., Barnes, R., Biggs, E., Osmer, P., 1965, ApJ, 142, 1604
- [2] Aigrain, S., Hodgkin, S., Irwin, M., Lewis, J., Roberts, S., 2015, MNRAS, 447, 2880
- [3] Aigrain, S., Parvianinen, H., Pope, B., 2016, MNRAS, 459, 2408
- [4] Akeson, R., et al., 2013, PASP, 125, 989
- [5] Anderson, C., Stoeckly, R., Kraft, R., 1966, ApJ, 143, 299
- [6] Artyukhina, N., & Kalinina, E., 1970, TrSht, 40, 3
- [7] Balona, L., Krisciunas, K., Cousins, A., 1994, MNRAS, 290, 905
- [8] Balona, L., Guzik, J., Uytterhoeven, K., Smith, J., Tenenbaum, P., Twicken, J., 2011, MNRAS, 415, 3531
- [9] Balona, L., Catanzaro, G.,Abedigamba, O., Ripepi, V., Smalley, B., 2015, MNRAS, 448, 1378
- [10] Belikov, A., Hirte, S., Meuseinger, H., Piskunov, A., Schilbach, E., 1998, A&A, 332, 575
- [11] Bouvier, J., et al., 1997, A&A, 323, 139
- [12] Bouvier, J., Matt, S., Mohanty, S., Scholz, A., Stassun, K., Zanni, C., 2014, prpl.conf, 433 http://adsabs.harvard.edu/abs/2014prpl.conf..433B
- [13] Bouy, H., Bertin, E., Moraux, E., et al., 2013, A&A, 554, 101
- [14] Bouy, H., Bertin, E., Sarro, L., et al., 2015, A&A, 577, 148
- [15] Breger, M., 1972, ApJ, 176, 367
- [16] Breger, M., 1986, ApJ, 309, 311
- [17] Burkhart, C., & Coupry, M., 1997, A&A, 318, 870
- [18] Cottaar, M., Covey, K., Meter, M., et al., 2014, ApJ, 794, 125
- [19] Covey, K., Agüeros, M., Law, N., Liu, J., Laher, R., Levitan, D., Ovek, E., Sesar, B., Surace, J., 2016, ApJ, 822, 81
- [20] Crawford, D., & Perry, C., 1976, AJ, 81, 419
- [21] David, T., et al., 2015, ApJ, 814, 62
- [22] David, T., et al., 2016, AJ, in press (arXiv:1602.01901)
- [23] Deacon, N., & Hambly, N., 2004, A&A, 416, 125
- [24] Ducati, J., 2002, CDS/ADC Collection of Electronic Catalogues, 2237, 0 (2002) http://adsabs.harvard.edu/abs/2002yCat.2237….0D
- [25] ESA, 1997, The Hipparcos and Tycho Catalogues. ESA SP-1200
- [26] Fox Machado, L., Pérez Hernández, F., Suárez, J., Michel, E., Lebreton, Y., 2006, A&A, 446, 611
- [27] Fox Machado, L., Michel, R., Álvarez, M., Fu, J., Zurita, C., 2011, RMxAX, 40, 237 http://adsabs.harvard.edu/abs/2011RMxAC..40..237F
- [28] Gebran, M., & Monier, R., 2008, A&A, 483, 567
- [29] Geissler, K., et al., 2012, ApJ, 746, 44
- [30] Hambly, N., Hawkins, M., Jameson, R., 1993, A&AS, 100, 607
- [31] Haro, G., Chavira, E., Gonzalez, G., 1982, BITon, 3, 3 http://adsabs.harvard.edu/abs/1982BITon…3….3H
- [32] Hartman, J., Bakos, G., Kovács, G., Noyes, R., 2010, MNRAS, 408, 475
- [33] Hertzsprung, E., 1947, AnLei, 19, 1 http://adsabs.harvard.edu/abs/1947AnLei..19A…1H
- [34] Hodgkin, S., Jameson, R., Steele, I., 1995, MNRAS, 274, 869
- [35] Howell, S, et al., 2014, PASP, 126, 398
- [36] Iriarte, B., 1967, BOTT, 4, 791 http://adsabs.harvard.edu/abs/1967BOTT….4…79I
- [37] Jackson, R., & Jeffries, R., 2010, MNRAS, 402, 1380
- [38] Jameson, R., & Skillen, I., 1989, MNRAS, 239, 247
- [39] Johnson, H.,& Mitchell, R., 1958, ApJ, 128, 31
- [40] Jones, B., 1970, AJ, 75, 563
- [41] Jones, B., 1973, A&AS, 9, 313
- [42] Kamai, B., Vrba, F., Stauffer, J., Stassun, K., 2014, AJ, 148, 30
- [43] Kazarovets, E., 1993, PZ, 23, 141 http://adsabs.harvard.edu/abs/1993PZ…..23..141K
- [44] Kovács, G., Zucker, S., & Mazeh, T. 2002, A&A, 391, 369
- [45] Krisciunas, K., 1994, ComAp, 17, 213 http://adsabs.harvard.edu/abs/1994ComAp..17..213K
- [46] Landolt, A., 1979, ApJ, 231, 468
- [47] Liu, T., Janes, K., Bania, T., 1991, ApJ, 377, 141
- [48] Lodieu, N., Deacon, N., & Hambly, N., 2012, MNRAS, 422, 1495
- [49] Malaroda, S., Levato, H., Morrell, N., Garcá, B., Grosso, M., Bolzicco, G., 2000, A&AS, 144, 1
- [50] Martin, E., Rebolo, R., Zapatero-Osorio, M., 1996, ApJ, 469, 706
- [51] Melis, C., Reid, M., Mioduszewski, A., Stauffer, J., Bower, G., 2014, Science, 345, 1029
- [52] Mermilliod, J.-C., et al., 1992, A&A, 265, 513
- [53] Mermilliod, J.-C., Bratschi, P., Mayor, M., 1997, A&A, 320, 74
- [54] Mermilliod, J.-C., 2006, http://adsabs.harvard.edu/abs/2006yCat.2168….0M
- [55] Mermilliod, J.-C., Mayor, M., Udry, S., 2009, A&A, 498, 949
- [56] Micela, G., Sciortino, S., Vaiana, G., Harnden, F., Rosner, R., Schmitt, J., 1990, ApJ, 348, 557
- [57] Micela, G., Sciortino, S., Harnden, F., Kashyap, V., Rosner, R., Prosser, C., Daminani, F., Stauffer, J., Caillault, J.-P., 1999, A&A, 341, 751
- [58] Morel, M., & Magnenat, P., 1978, A&AS, 34, 477
- [59] Oppenheimer, B., Basri, G., Nakajima, T., Kulkarni, S., 1997, AJ, 113, 296
- [60] Pinfield, D., Hodgkin, S., Jameson, R., Cossburn, M., Hambly, N., Devereux, N., 2000, MNRAS, 313, 347
- [61] Pinfield, D., Dobbie, P., Jameson, R., Steele, I., Jones, H., Katsiyannis, A., 2003, MNRAS, 342, 1241
- [62] Plavchan, P., Jura, M., Kirkpatrick, J. D., Cutri, R. M., & Gallagher, S. C. 2008, ApJS, 175, 191
- [63] Prosser, C,, Stauffer, J., Kraft, R., 1991, AJ, 101, 1361
- [64] Prosser, C,, Schild, R., Stauffer, J., Jones, B., PASP, 105, 269
- [65] Prosser, C,, Shetrone, M., Marilli, E., et al., 1993, PASP, 105, 1407
- [66] Prosser, C,, Shetrone, M., Dasgupta, A., et al., 1995, PASP, 107, 211
- [67] Queloz, D., Allain, S., Mermilliod, J.-C., Bouvier, J., Mayor, M., 1998, A&A, 335, 183
- [68] Raboud, D. & Mermilliod, J.-C., 1998, A&A, 329, 101
- [69] Rebull, L., Stauffer, J., Cody, A., 2016, AJ, submitted
- [70] Renson, P., & Manfroid, J., 2009, A&A, 498, 961
- [71] Roberts, D., Lehar, J., Dreher, J., 1987, AJ, 93, 968
- [72] Roeser, S., Demleitner, M., Schilbach, E., 2010, AJ, 139, 2440
- [73] Rosvick, J., Mermilliod, J.-C., Mayor, M., 1992, A&A, 255, 130
- [74] Sarro, L., Bouy, H., Berihuete, A., Bertin, E., Moraux, E., Bouvier, J., Cuillandre, J.-C., Barrado, D., Solano, E., 2014, A&A, 563, 45
- [75] Scargle, J. D., 1982, ApJ, 263, 835
- [76] Schilback, E., Robichon, N., Souchay, J., Guibert, J., 1995, A&A, 299, 696
- [77] Scholz, A., Eislöffel, J., 1004, A&A, 421, 259
- [78] Sierchio, J., Rieke, G., Su, K., Plavchan, P., Stauffer, J., Gorlova, N., 2010, ApJ, 712, 1421
- [79] Skrutskie, M., Cutri, R. M., Stiening, R., et al., 2006, AJ, 131, 1163
- [80] Soderblom, D., Jones, B., Balachandran, S., Stauffer, J., Duncan, D., Fedele, S., Hudon, J., 1993, AJ, 106, 1059
- [81] Soderblom, D., Stauffer, J., Hudon, J. D., Jones, B., 1993, ApJS, 85, 315
- [82] Stauffer, J., & Hartmann, L., 1987, ApJ, 318, 337
- [83] Stauffer, J., Hartman, L., Soderblom, D., Burnham, N., 1984, ApJ, 280, 202
- [84] Stauffer, J., Schild, R., Baliunas, S., Africano, J., 1987, PASP, 99, 471
- [85] Stauffer, J., Klemola, A., Prosser, C., Probst, R., 1991, AJ, 101, 980
- [86] Stauffer, J., Schultz, G., & Kirkpatrick, J. D., 1998a, ApJ, 499, 199
- [87] Stauffer, J., Schild, R., Barrado y Navascués, D., et al., 1998b, ApJ, 504, 805
- [88] Stauffer, J., Hartmann, L., Fazio, G., et al., 2007, ApJS, 172, 663
- [89] Stauffer, J., Cody, A., Baglin, A., et al., 2014, AJ, 147, 83
- [90] Stauffer, J., Rebull, L., Bouvier, J. et al., 2016, submitted
- [91] Stauffer, J., 1984, ApJ, 280, 189
- [92] Terndrup, D., Stauffer, J., Pinsonneault, M., et al., 2000, AJ, 119, 1303
- [93] Trumpler, R., 1921, LicOB, 10, 110 http://adsabs.harvard.edu/abs/1921LicOB..10..110T
- [94] Vanderburg, A., & Johnson, J., 2014, PASP, 126, 948
- [95] Vasilevskis, S., van Leeuwen, F., Nicholson, W., Murray, C., 1979, A&AS, 37, 333
- [96] Wang, J., Li, C., Zhao, J., Jiang, P., 1996, AcASn, 37, 68 http://adsabs.harvard.edu/abs/1996AcASn..37…68W
- [97] Werner, M., et al., 2004, ApJS, 154, 1
- [98] White, T., Aerts, C., Antoci, V., et al., 2015, K2 conference November 2015 http://lcogt.net/files/K2SciCon/Tim_White-White_Pleiades_K2SciCon.pdf
- [99] Wright, E., Eisenhardt, P. R. M., Mainzer, A. K., et al., 2010, AJ, 140, 1868
- [100] van Leeuwen, F., Alphenaar, P., Brand, J.., 1986, A&AS, 65, 309
- [101] van Leeuwen, F., Alphenaar, P., Meys, J., 1987, A&AS, 67, 483
- [102] Zacharias, N., Finch, C., Subasavage, J., et al., 2015, AJ, 150, 101
- [103] Zapatero Osorio, M., Rebolo, R., Martin, E., 1997, A&A, 317, 164
Appendix A Examples of Members Not Detected as Periodic
Section II.6 above mentions member stars not detected by us as periodic. Here are 6 examples of these kinds of stars. In the top row, 211029507/DH045 and 210804032/DH354 both have flat LCs with no significant periodogram peaks. In the second row, 210967607/DH335 and 210998086/PELS174 both have LCs compromised by saturated pixels, either from themselves or a nearby bright star. In the last row, 210784603/s3289407 and 210837336/PELS063 both have somewhat of a repeated pattern, but this pattern is irregular enough that we have designated these as having a ‘timescale’, not a rotation period; see §B).

Appendix B Timescales
For some objects, we found a period during our analysis, but individual inspection of the light curves suggests that whatever is causing the repeating pattern is not a spot-modulated rotation period. We have opted to describe this as a ‘timescale’ rather than a period. In several cases, they are also non-members. They do not really have a preferential color; see Fig. 14. However, this Figure also demonstrates that many of the timescale objects are photometric non-members. For comparison, Fig. 13 includes two examples of timescale objects that are members.
The repeating pattern in EPIC 211005312/s4337464 is the most borderline case, by which we mean that this LC could conceivably be a spot-modulated signal; see Fig. 15. However, it is a NM.
In one case, EPIC 211145558=BPL336, the LC texture resembles the ‘bursts’ from NGC 2264, characterized by Stauffer et al. (2014) as accretion bursts (see Fig. 15). This object is not a member of the Pleiades; it could be a member of Taurus, suggesting that an interpretation of accretion bursts is not impossible. It does not have a clear IR excess (it is detected only at the shortest two bands of WISE, and [3.4][4.6]=0.3 mag). It is located very far to the East and somewhat to the North of the Pleiades cluster center, towards where Taurus members are. Another possibility of course is that all the structure is instrumental, not real, but this structure is found in all of the LC versions we have. It is listed as a photometric member in Pinfield et al. (2003), though the proper motions in URAT are not consistent with Pleiades membership, and Bouy et al. (2015) also have it as a clear NM.
For completeness, we note that the actual eclipses in the eclipsing binaries, which also have a repeating pattern that is not a rotation period, are not included here, but appear in David et al. (2015, 2016).


| EPIC | RA, Dec (J2000) | Other name | Timescale (d) | Membership | Notes |
|---|---|---|---|---|---|
| 210784603 | 033103.57+193805.1 | s3289407 | 20 | best memb | … |
| 210909681 | 033326.45+213229.8 | s4679029 | 22 | NM | … |
| 211018285 | 033652.52+231545.2 | DH065 | 16.81 | ok memb | Possibly rotation period or possibly timescale. |
| 211071563 | 033935.45+240706.3 | HHJ407 | 33 | best memb | … |
| 211063756 | 034218.86+235922.2 | SK687 | 18 | NM | … |
| 211020453 | 034512.69+231746.5 | HII580 | 25 | NM | … |
| 211114664 | 034554.25+244806.7 | WCZ114 | 18 | NM | … |
| 210837725 | 034705.34+202639.5 | s4798986 | 30 | ok memb | … |
| 211045908 | 035122.47+234219.1 | BPL234 | 26 | NM | … |
| 211026586 | 035146.55+232334.7 | BPL241 | 24 | NM | … |
| 210914077 | 035202.47+213637.7 | DH735 | 28 | NM | … |
| 211020039 | 035203.61+231721.5 | SK202 | 29 | NM | … |
| 210837336 | 035208.80+202618.9 | PELS063 | 23 | ok memb | … |
| 210928539 | 035225.91+215031.8 | DH752 | 30 | NM | … |
| 211132831 | 035242.50+250702.9 | SRS33701 | 12.5 | NM | … |
| 211063255 | 035321.59+235854.2 | SK132 | 35 | NM | … |
| 211044588 | 035359.92+234100.3 | BPL296 | 5.2 | NM | … |
| 211082538 | 035507.08+241725.8 | SK67 | 25-30 | NM | … |
| 211051964 | 035549.89+234822.7 | BPL332 | 35 | NM | … |
| 211145558 | 035621.72+252110.4 | BPL336 | 23 | NM | “bursts, ” not spots. |
| 211050613 | 035626.19+234703.5 | DH835 | 15-30 | NM | Hard to know which period is right. |
| 210751596 | 035721.70+190803.4 | UGCSJ035721.71+190803.2 | 25 | NM | only see repeated pattern in one LC version. |
| 211110418 | 035852.12+244348.5 | UGCSJ035852.13+244348.3 | 25 | NM | … |
| 211137552 | 040049.31+251210.9 | DH895 | 29 | NM | … |
| 211038138 | 040105.79+233444.3 | UGCSJ040105.81+233443.8 | 20 | best memb | … |
| 211005312 | 040154.08+230331.6 | s4337464 | 19.579 | NM | This could be a spot period. |
| 211026906 | 040437.17+232351.5 | s5092529 | 25 | best memb | … |
| 211045801 | 041001.97+234212.3 | s4634206 | long, 50d? | NM | … |
Appendix C Stars that are too bright or too faint for this sample
We empirically determined that our brightness and faintness limits are effectively and , respectively. Sometimes, despite these limits, we were still able to derive a period (and in two cases, two distinct periods). Here, we list those objects that are too bright or too faint for our sample.
| EPIC | RA, Dec (J2000) | Other name | Period(s) (d) | membership |
|---|---|---|---|---|
| 210967871 | 033228.28+222806.5 | DH019 | … | ok memb |
| 211075945 | 034133.76+241118.6 | BPL24 | 0.496079 | NM |
| 211068507 | 034248.16+240401.4 | BPL45 | … | best memb |
| 211110493 | 034300.16+244352.5 | BPL49 | … | best memb |
| 211096282 | 034340.29+243011.4 | BPL62 | … | best memb |
| 211097372 | 034353.54+243111.6 | BPL66 | … | best memb |
| 211082490 | 034448.21+241722.2 | Caeleno=HII447 | … | best memb |
| 200007769 | 034452.53+240647.8 | Electra=HII468 | … | best memb |
| 211116936 | 034509.73+245021.3 | HII541 | 0.674473, 0.647851 | best memb |
| 200007772 | 034512.50+242802.1 | Taygeta=HII563 | … | best memb |
| 200007771 | 034549.60+242203.7 | Maia=HII785 | … | best memb |
| 210976082 | 034550.40+223606.0 | BPL78 | … | ok memb |
| 211073549 | 034550.64+240903.7 | BPL79 | … | best memb |
| 211099592 | 034554.47+243316.2 | Asterope=HII817 | … | best memb |
| 200007770 | 034619.58+235654.1 | Merope=HII980 | … | best memb |
| 211086019 | 034623.11+242036.3 | BPL100 | … | ok memb |
| 211138940 | 034702.53+251345.6 | BPL123 | … | NM |
| 211106625 | 034705.70+244003.7 | BPL124 | 0.267422 | best memb |
| 211094511 | 034712.09+242832.0 | BPL132 | … | best memb |
| 211088076 | 034717.91+242231.6 | BPL137 | … | NM |
| 210983090 | 034723.97+224237.3 | BPL142 | 0.304403, 0.247935 | best memb |
| 200007767 | 034729.08+240618.4 | Alcyone=etaTau=HII1432 | … | best memb |
| 211102808 | 034739.00+243622.3 | BPL152 | … | best memb |
| 211090981 | 034819.00+242512.9 | BPL172 | … | NM |
| 211028385 | 034820.81+232516.5 | HII1823 | … | best memb |
| 210993392 | 034825.60+225212.3 | BPL179 | … | NM |
| 200007768 | 034909.74+240312.1 | Atlas=HII2168 | … | best memb |
| 200007773 | 034911.21+240812.0 | Pleione=HII2181 | … | best memb |
| 211048942 | 035125.55+234521.3 | BRB14 | … | best memb |
| 211029838 | 035144.91+232639.5 | BPL240 | … | best memb |
| 211123454 | 035157.11+245706.5 | DH729 | … | NM |
| 210914077 | 035202.47+213637.7 | DH735 | … | NM |
| 211131711 | 035323.34+250550.5 | BPL284 | … | NM |
| 211069099 | 035334.54+240438.2 | BPL287 | … | NM |
| 211135437 | 035415.27+250952.3 | BPL306 | … | best memb |
| 211140205 | 035444.19+251511.1 | BPL316 | … | NM |
| 211115616 | 035523.07+244905.2 | BPL327 | 0.231512 | best memb |
| 211103918 | 035622.33+243723.4 | DH832 | … | NM |
| 211080216 | 035634.19+241513.1 | DH838 | … | NM |
| 210981512 | 035639.65+224112.2 | DH842 | … | NM |
| 211085541 | 035758.48+242008.8 | DH861 | … | NM |
Appendix D Non-Members
There are more than 150 stars where a K2 LC was obtained, presumably because SIMBAD or other literature considered these objects as Pleiades members. However, consideration of each of the individual stars, including the references mentioned above in Section II.5, suggests that these are not, in fact likely to be Pleiades members. They are listed in Table 6 with the period(s) we derived, and plotted (where possible) in Fig. 16. Only about 20% of these objects have periods, which is a significantly lower rate than that for the members, consistent with these being a different population. Note also that several of the NM have repeated patterns that we believe to not be spot-modulated, periodic signals; these timescales are listed in Appendix B. EPIC 211145558/BPL336 (in Fig. 15) is discussed there.
EPIC 211094095/HII813 is one peculiar case worthy of additional discussion. It has a very long period for a Pleiades member (19.15d; see Fig. 15). The LC shape is plausibly due to spot modulation. It has an 84% chance of membership in Deacon & Hambly (2004), a 6% chance of membership in Belikov et al. (1998), a 48% chance of membership in Stauffer et al. (1991), but a 98% chance of membership in Bouy et al. (2015). Its motion in RA is very discrepant from the ensemble Pleiades motion, though the actual measurements in the literature cover a much wider range than for other members of comparable brightness. We have declared it a NM based on an unpublished HIRES spectrum (discussed in Paper III). Its radial velocity is about 5-8 km s-1 too high. If it is a member, its very long period would have to be explained in the context of models of rotational evolution.
EPIC 211082433/V692Tau=HCG509=HHJ430 is another peculiar case. It has two significant periods like many of the other Pleiades members; see Fig. 15. It appears too high in the optical CMD for us to consider it a member. It has a 2% chance of being a member in Belikov et al. (1998), 0% in Kazarovets (1993), 17% in Stauffer et al.(1991), and 16% in Bouy et al. (2015). On the other hand, it is one of two stars that Oppenheimer et al. (1997) report has a high Li abundance which means it is almost certainly young. We have opted to leave it as a NM, but it is quite puzzling nonetheless. Interestingly, there is a ‘glitch’ in the phased LC at 0.374d; the other of the two stars with Li is HCG332, discussed in Paper II as having angular dips. It could be that this ‘glitch’ in HCG509 is a similar effect as in HCG332. There is no compelling evidence for IR excess in HCG509.

| EPIC | RA, Dec (J2000) | Other name | (mag) | (mag) | Period (d) | |
|---|---|---|---|---|---|---|
| 210979798 | 032928.08+223936.2 | s5035799 | … | 11.10 | 3.03 | 29.564 |
| 210978791 | 033008.26+223838.9 | DH010 | … | 12.77 | 4.98 | … |
| 211004869 | 033035.37+230308.3 | DH012 | … | 14.26 | 5.33 | … |
| 210909681 | 033326.45+213229.8 | s4679029 | … | 11.21 | 2.94 | … |
| 210960667 | 033338.99+222108.9 | DH029 | … | 13.44 | 4.95 | … |
| 210931896 | 033617.62+215339.1 | AKII293 | 11.00 | 9.25 | 1.64 | 4.370 |
| 210953848 | 033626.15+221445.7 | DH057 | … | 12.53 | 4.68 | … |
| 210820939 | 033629.04+201119.8 | UGCSJ033629.05+201119.6 | … | 12.47 | 3.12 | … |
| 210833806 | 033753.23+202301.7 | UGCSJ033753.25+202301.2 | … | 12.75 | 4.98 | … |
Appendix E Cross-ids
This section gives some of the common synonyms for our targets in the literature. The table is available in its entirety in the online version; a description of the columns appears in Table 7.
| Label | Contents |
|---|---|
| EPIC | Number in the Ecliptic Plane Input Catalog (EPIC) for K2 |
| Name | More common name used here |
| HII | Name in HII catalog (Hertzsprung 1947) |
| HCG | Name in HCG catalog (Haro et al. 1982; Kazarovets 1993) |
| HHJ | Name in HHJ catalog (Hambly et al. 1993) |
| PELS | Name in Pels catalog (van Leeuwen et al. 1986) |
| DH | Name in DH catalog (Deacon & Hambly 2004) |
| SRS | Name in SRS catalog (Schilbach et al. 1995; Belikov et al. 1998) |
| BPL | Name in BPL catalog (Pinfield et al. 2000) |
| SK | Name in SK catalog (Stauffer et al. 1991) |
| Tr | Name in Tr catalog (Trumpler 1921) |
| WCZ | Name in WCZ catalog (Wang et al. 1996) |
| Simbad | Name used in Simbad as primary identifier |
| Lodieu | Name in Lodieu et al. (2012) catalog |
| Bouy | Name in Bouy et al. (2015) catalog |
| 2MASS | Name in 2MASS All-sky point source catalog |
Appendix F Phased LCs: Figure Set
This section consists of an online-only figure set. Each periodic member (e.g., each source in Table 2) has a PNG file that looks like the rows of, e.g., Fig. 2. Note that many of these sources have up to four periods that we identify; see Paper II for more discussion of these sources. The plots in each PNG file consist of the original light curve (in units of flux), the power spectrum, and the phased light curve (in relative flux) for each viable period, for up to a total of four periods.