A laser diode based system for calibration of fast time-of-flight detectors
Abstract
A system based on commercially available items, such as a laser diode, emitting in the visible range nm, and multimode fiber patches, fused fiber splitters and optical switches may be assembled, for time calibration of multi-channels time-of-flight (TOF) detectors with photomultipliers’ (PMTs’) readout. As available laser diode sources have unfortunately limited peak power, the main experimental problem is the tight light power budget of such a system. In addition, while the technology for fused fiber splitters is common in the Telecom wavelength range ( nm), it is not easily available in the visible one. Therefore, extensive laboratory tests had to be done on purpose, to qualify the used optical components, and a full scale timing calibration prototype was built. Obtained results show that with such a system, a calibration resolution () in the range 20-30 ps may be within reach. Therefore, fast multi-channels TOF detectors, with timing resolutions in the range 50-100 ps, may be easily calibrated in time.
Results on tested optical components may be of interest also for time calibration of different light detection systems based on PMTs, as the ones used for detection of the vacuum ultraviolet scintillation light emitted by ionizing particles in large LAr TPCs.
keywords
Timing detectors; scintillators; particle identification methods1 Introduction and layout of the proposed calibration system
Some examples of time-of-flight (TOF) detectors, based on scintillators with photomultipliers’(PMTs’) readout and arranged along orthogonal coordinates, are shown in table 1.
| Detector | Scintillator | PMT | (ps) | |
|---|---|---|---|---|
| MICE [2] | BC404 or BC420 | 40-60 x 4-6 x 2.5 | Ham. R4998 | |
| MEG [3] | BC404 | 79.6 x 4 x 4 | Ham. 5924 | |
| NA49 [4] | BC408 | 12(48) x 1 (1.25) x 1.5(2.4) | Ham. R3478 | 80 |
| DASP [5] | NE110 | 172 x 20 x 2 | RCA 8575 | 210 |
| E813 [6] | BC408 | 200 x 8.5 x 5 | Ham. H1949 | 110 |
| GlueX [7] | Eljen | 200 x 6.0 2.5 | XP2020 | |
| PAMELA [8] | BC404 | 41(18) x 33(15) x 07.(0.5) | Ham. 5900 | 120 |
| ARGUS [9] | NE110 | 218 x 9.3 x 2 | RCA8575 | |
| BELLE [10] | BC408 | 255 x 6 x 4 | Ham. 6680 | |
| CDFII [11] | BC408 | 279 x 4 x 4 | Ham. R7761 | |
| CLEOII [12] | BC408 | 280 x 10 x 5 | XP2020 | 139 |
| [13] | NE110 | 210-300 x 21 x 2 | XP2020 | |
| OBELIX [14] | NE110 | 300 x 9.3x 4 | XP2020 | 170 |
| E735 [15] | BC408 | 305 x 10 x 5 | XP2020 | 110 |
| MARKIII [16] | NE Pilot F | 317.5 x 15.6 x 5.1 | XP2020 | |
| CLAS [17] | BC408 | 32-450 x 15-22 x 5.1 | XP4312B/D1 | 163 |
| DIRAC [18] | BC420 | 40 x 7 x 2.2 | Ham. R1828-01 | 123 |
| TOPAZ [19] | Eljen | 400 x 13 x 2.5 | Ham. H1949 | |
| HARP[1] | BC408 | 180-250 x 21 x 2.5 | XP2020 |
For a particle crossing an individual scintillation counter , with double-side PMTs readout (), the time difference between the STOP signal from the PMT and the START signal from a reference counter is given by:
| (1) |
where is the particle crossing time, its distance from the counter center, L is the scintillator length, the effective velocity of light in the scintillator ( ns/m) and includes all system delays (cables, PMT transit time, etc.).
To assure optimal performances, it is essential to determine precisely the individual channel delays . They may drift during data-taking, due to temperatures excursions and other effects. As reported in reference [1], standard RG58 signal cables have time variation up to 95 ppm/∘C, due to thermal excursions, while the better RG213 cables reach values around 30 ppm/∘C. With typical time delays around 100 ns, time drift of the order of 9 (3) ps/∘C may be reached by using RG58 (RG213) signal cables. This has to be compared with a TOF detector resolution () in the range 50-150 ps.
The quantity
| (2) |
where are the time differences corrected for the system delays , does not depend on the particle impact point and allows the measurement of its time-of-flight (TOF). This may be used for particle identification (PID).
Time calibration of a TOF system means the precise determination of delays at a start time and the monitoring of their change along the data-taking period. Cosmic rays, as in the case of the HARP Tof Wall [1], or impinging beam particles, as in the case of the MICE TOF system [2], may be used. Another way is to deliver fast calibration pulses to each individual channel. The requirement on the light calibration pulses is that their rising edge mantains the original time characteristics with minimal deterioration, up to the injection point in the scintillation counter and that their time delays do not sensibly vary during the calibration procedure.
For a TOF system, made of two detectors, of which the first gives the start signal (), the TOF measurement resolution is given by:
| (3) |
where is the intrinsic resolution of each TOF detector and the resolution of the calibration system, used to determine the delays.
The request on the calibration system is to have as small as possible. This translates, in practice, into the request to have calibration pulses with the smallest width () and thus the best rising edge determination. The intrinsic laser width must be minimal and the additional spread introduced by the laser pulse delivery system kept as small as possible. If possible, all must be realized with components commercially available for easiness.
Laser based calibration systems were used for the experiment at Grenoble [13], the MARK-III experiment at SLAC [16], the CLAS system at CEBAF [17], the TOPAZ experiment at KEK [19] and the HARP/PS214 experiment at CERN [20].
As an example, in reference [20] a custom-made duplicated Nd/Yag laser at 532 nm, with passive Q-switch and active/passive mode locking was used 11 1 model SYLP0 from Quanta Systems srl, Italy, with 60 ps FWHM, 10 Hz repetition rate, 3 mJ energy per pulse. It was followed by a custom-made optical delivery system to the individual scintillators, based on a bundle of 64 Corning SMF-28 IR monomode fibers 22 2 made by Fiberlan srl, Milano. The fibers in the bundle behave as “limited number of modes” fibers at the wavelength of interest ( nm), with a measured dispersion of .. Unfortunately, a laser of this type is expensive and difficult to operate.
By using this system, a calibration resolution () around 70 ps was quoted for the large Tof Wall of the HARP experiment at CERN PS [1].
All the previous systems comply with the previous requests only in part, especially for the use of commercially availabile optical components and laser systems.
The use of turnkey low-cost laser-diode systems, but unluckily with limited peak power, has been proposed by the T0 detector group of the ALICE Collaboration at LHC [21]. Laser diodes have high repetition rates (up to several MHz) but regrettably low energies per pulse (up to a factor lower, as respect to conventional systems), putting severe constraints on the optical laser pulse delivery system to the individual channels in terms of attenuation.
A TOF detector laser diode calibration system may be built up from optical switches that direct the input laser pulse to one of output channels, fused fiber splitters that divide the input laser pulse to output channels and fiber patch cables for connections between the previous items 33 3 Such a calibration system may be used also for timing systems based on PMTs different from conventional scintillation time-of-flight detectors, such as PMTs systems used for the detection of the vacuum ultraviolet(VUV) light emitted by ionizing particles in large LAr TPCs. In this case requirements on the time calibration system may be relaxed, as required time resolutions are in the ns range, instead that in the 50-150 ps one.

A simple layout is shown in figure 1 that illustrates the prototype system developed at INFN Milano Bicocca. The start signal () is given by a fast photodiode (ch 3), while the stop signal is given by the signals from the two PMTs at the end of the counter scintillator bar under test (ch no 1,2).
The aim of this paper was to develop a calibration system for fast TOF detectors based on commercially available optical components, avoiding custom-made solutions, and using low-cost fast diodes. The main concern were to keep the timing characteristics of the delivered calibration laser pulses under control (by reducing to a minimum) and to manage efficiently the system power budget, to allow calibration of a multi-channel system (up to some hundreds).
2 Experimental test setup
The layout of the experimental setup used for the measurement of the optical components under test is shown in figure 2.

Light pulses from a fast laser 44 4 Model Pilas 040 from Advanced Laser Systems, with FWHM ps, repetition rate up to 1 MHz, peak power 1 W, free space beam head optics are injected into a Multimode (MM) Arden Photonics ModCon mode scrambler, with dB insertion loss at 850 nm 55 5 A mode scrambler is used to reduce dependency from the light source in bandwith and attenuation measurements for multimode (MM) fibers, giving a more uniform injection into the fiber (or into a 1m MM fiber) using an Olympus 20x microscope objective, with 0.4 N/A and 1.2 mm working distance. Fine alignment for the injection is obtained via a Newport manual micrometric stage. After the last optical element under test, the output light pulse is focalized, via another 20x microscope objective placed on a micrometric 3-axis Thorlabs flexure stage, on a fast InGaAs MSM Hamamatsu G4176 photodiode (with 30 ps rise and fall time). For optimal performances, the photodetector is powered by a 1 GHz broadband Picosecond Pulse Lab 5550B bias tee 66 6 thus providing the bias voltage to the active device, while allowing high speed signals to pass through with minimum signal degradation and its signal is amplified by a 10dB broadband inverting amplifier 77 7 Model BBA-3 from Alphalas Gmbh, with 15 GHz bandwidth. The amplified signal is then measured with a 20 GHz HP 54750 sampling scope, where the trigger signal is given by the laser sync out.
The laser source has been characterized by the manufacturer with a 20 GHz Ultrafast detector, with FWHM < 20 ps, and a 50 GHz HP54750A scope. The timing characteristics of the injection system used are shown in table 2. Our results compare well with datasheet FWHM data for G4176 photodetectors from the manufacturer, that are in the range 70-80 ps with a similar test setup.
| expected | measured | |
| laser | ps | |
| bias tee | ps | |
| HP54750 scope | ps | |
| G4176 photodiode | ps ( ps typ.) | |
| fast amplifier | ps | |
| total | ps ( ps typ.) | ps (with MS) |
| ps (without MS) |
Timing characterization of single optical components, such as fiber patch cords, optical switches, fused fiber splitter, has been done by putting them after the laser light injection stage and measuring the increase in the signal FWHM (). From the measured FWHM, one can then compute using a gaussian approximation for the signal shape. In most cases, this is true aside for the longer fiber patches ( m) where non gaussian tails appear in the falling edge of the signal.
As their timing characteristics are determined by measuring the increase of the FWHM, as respect to , the precise determination of is essential. From the reported mesurements a relative error around a few per mille may be quoted.
3 Tests of optical system components
A critical point for a time calibration system is the stability in time of the used laser. Tests were done with the available Pilas 040 laser, at 10 KHz repetition rate, using a 10 m long MM fiber as a delay before the photodetector. On a timescale of several hours of continuos operation, the measured risetime had a maximum variation of ps (6 per mille effect) and the pulse time delay ( ns) of less than 12 ps ( per mille effect).
For an optimal behaviour of the calibration system, in all optical elements the laser pulse must be transmitted with minimimal attenuation and mantaining its timing characteristics, mainly its risetime. Assuming a gaussian shape for the impulse, the key parameter for characterisation of such waveform is its standard deviation 88 8 We remind here for easiness the main relations between often measured time parameters in the gaussian approximation: , .
For each optical component under test a complete set of measurements was done to characterize both its transmission properties (power measured with the optical powermeter or pulse amplitude, , measured via the sampling scope) and its timing properties ( risetime, falltime, FWHM and pulse delay). Preliminary results were reported in reference [22].
3.1 Characterization of used optical fibers
To guarantee an optimal and simple injection of the light from the laser source, large core multimode fibers (MM) are to be preferred to small core single mode (SM) fibers. The problem is that MM fibers may suffer from a remarkable deterioration of the timing properties of the propagating laser pulse, due to modal dispersion. This has to be checked in the real experimental conditions on the distances of interest for the calibration setup, e.g. with fiber patchcords up to 15-20 meters, to go from the laser source to the detector channels to be calibrated. Tests were done with the setup of figure 2 where the signal at the end of the fiber under test was measured directly by a powermeter 99 9 Model Ophir Nova with a PD300 head for attenuation studies and by the full setup with a Hamamatsu G4176 photodetector and a HP54750 sampling scope for the timing properties studies. Attenuation studies were done with and without the optical mode scrambler.


Figure 3 and table 3 show the attenuation measured in decibel (dB) with different types of MM core fibers, using patches of different lengths. Results for core fibers are shown in figure 4 and reported also in table 3. Measurements are affected by systematic errors mainly due to the fluctuations in the laser intensity (within ).


| MM fiber | fiber type | Attenuation(dB/m) | Attenuation (dB/m) |
|---|---|---|---|
| (no scrambler) | (scrambler) | ||
| Thorlabs AFS 50/125Y | step index: 400-2400 nm | ||
| 50 core; 0.22 NA | |||
| Thorlabs SFS 50/125Y | step index: 250-1200 nm | ||
| 50 core; 0.22 NA | |||
| Corning 50/125 | graded index | ||
| 50 core; 0.20 NA | |||
| OZ/OPTICS 50/125 IRVIS | graded index: 400-1800 nm | ||
| 50 core; 0.20 NA | |||
| OZ/OPTICS 50/125 UVVIS | step index: 200-900 nm | ||
| 50 core; 0.22 NA | |||
| Nufern S105/125-22A | step index: 800 - 1600 nm | ||
| 100 core; 0.22 NA | |||
| Thorlabs AFS 105/125Y | step index: 400-2400 nm | ||
| 100 core; 0.22 NA | |||
| OZ/OPTICS 100/140 IRVIS | graded index: 400 - 1800 nm | ||
| 100 core; 0.29 NA |
Results on pulse dispersion, in terms of pulse delay and increase in the 10-90 % risetime or in the FWHM are shown in figure 5 for several mm core MM fiber patches. All tests were done with a mode scrambler before the fiber patch to be tested.

Additional results for 100 m core diameter fiber patches are shown instead in figure 6.

Most fiber patches under test have FC (“Fiber Channel”) connectors, that behave better than SMA (“Subminiature A” microwave) connectors traditionally used for MM fibers. The influence of the insertion of commercially available FC/FC mate sleeves was studied with specimen from different producers. The only information directly provided by the producer is their insertion loss (attenuation). Results with a Corning 50/125Y 10 m long fiber were compared with the ones with two 5 m fibers, of the same type, using in between a FC/FC mate sleeve. No appreciable difference was seen, as shown in table 4, aside a small change in the pulse delay ( per mille).
| patch | (mV) | FWHM (ps) | pulse delay (ns) |
|---|---|---|---|
| 10 m | 76.73 0.25 | 89.72 1.95 | 129.710 0.002 |
| 5m + 5m mate A | 76.46 0.23 | 91.10 1.80 | 129.580 0.002 |
| 5m + 5m mate B | 76.07 0.19 | 89.42 0.90 | 129.590 0.002 |
| 5m + 5m mate C | 75.95 0.18 | 89.58 1.29 | 129.590 0.003 |
3.2 Characterization of used optical switches and fused fiber splitters
Optical switches direct the input light signal to one of outputs with minimal insertion losses. The maximum number of available output channels is typically 16-32 in the visibile range, using MM fibers. Optical fiber fused splitters instead split the input signal over output channels in an even way (if required). These last components are quite common for the Telecom range of wavelengths (850 nm or 1300-1500 nm) but difficult to find for the visible range at nm.
After the mode scrambler, a MM optical switch made by PiezoJena GmBH 1010 10 Model F-109-05 with Thorlabs SFS 50/125 fibers as pigtails was put. The measured FWHM of the laser signal increased from ps to ps. At 408 nm, the output signal variation from channel to channel was within 1 %, with a cross-talk and an insertion loss dB. These numbers are to be compared with manufacturer specs, at nm, where an insertion loss of 1.5 dB and a cross-talk dB were quoted.
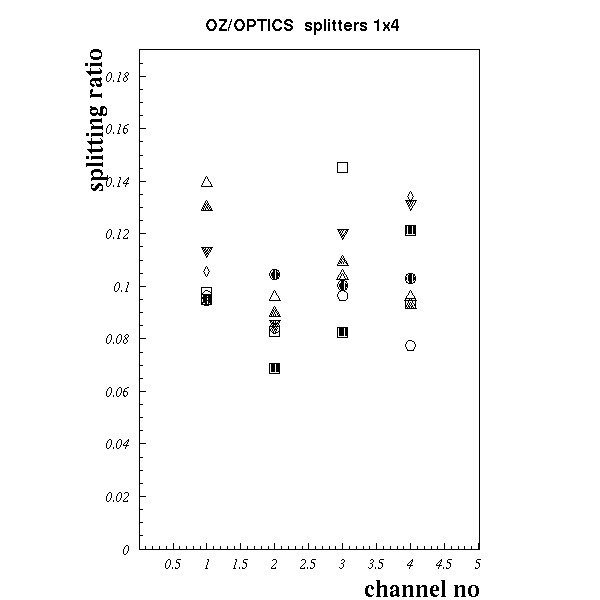
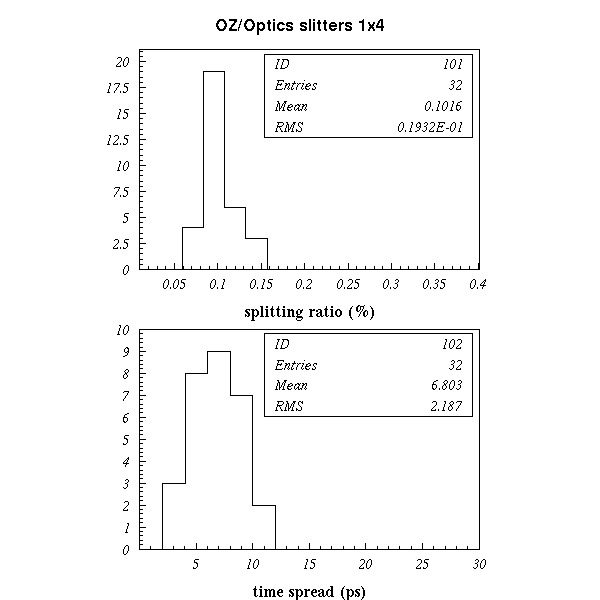
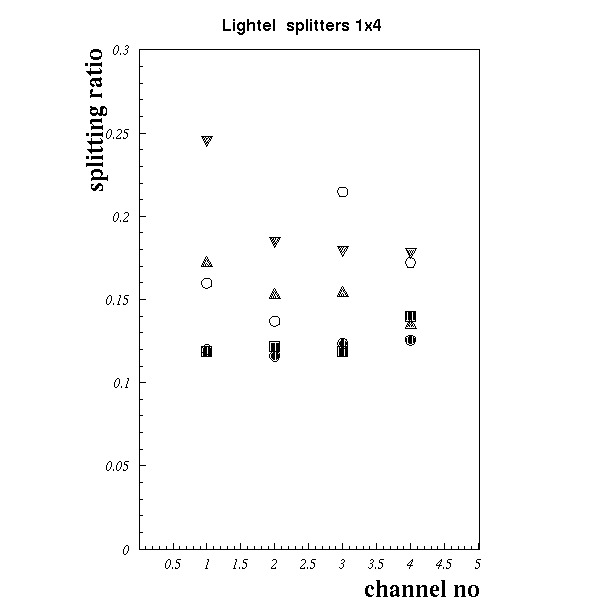
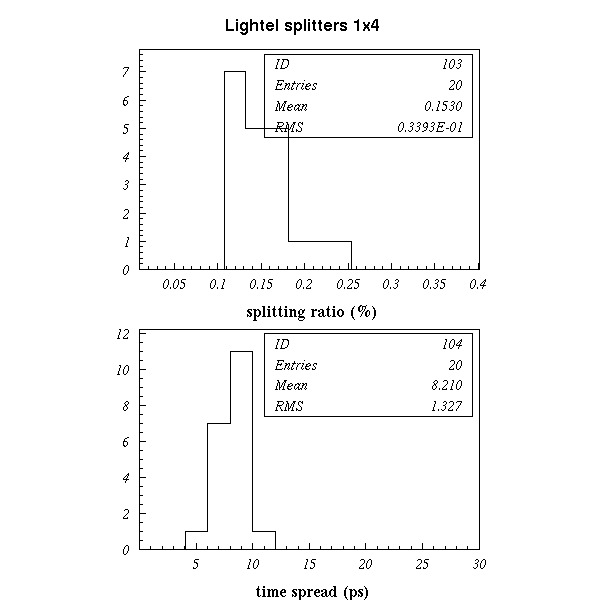
Several optical splitters , , made by OZ/Optics and Lightel, with 50 m or 100 m core fibers, were tested. The optical fused fiber splitters replaced the optical switch, after the mode scrambler in the test setup. A relevant insertion loss at 400 nm (around 2-3 dB) and a dispersion in the splitting ratio was seen. The measured FWHM of the input laser signal increased typically of ps after insertion of the optical splitters. Figures 7 to 9 show the output splitting ratio (in %) 1111 11 defined as the power ratio between the total input and a single channel output and the increase in the pulse timing resolution for some and splitters from OZ/Optics and Lightel, made with 50m fibers. Results for splitters made both with 50 m or 100 core fibers are resumed instead in table 5. Results are reported as average values rms values to give an idea of the distribution width over the specimens of the considered samples 1212 12 Spreads in some cases are large as specimen were from different manufacturer’s production batches. Uniformity of response may be a major concern for proper operations of passive fused splitters. Entries for the third and fourth columns of table 5 were obtained from distributions, as the ones reported in figures 7 to 9.
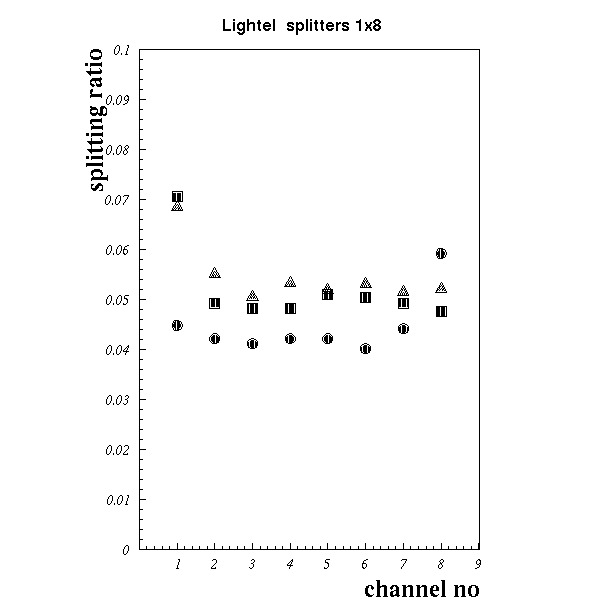
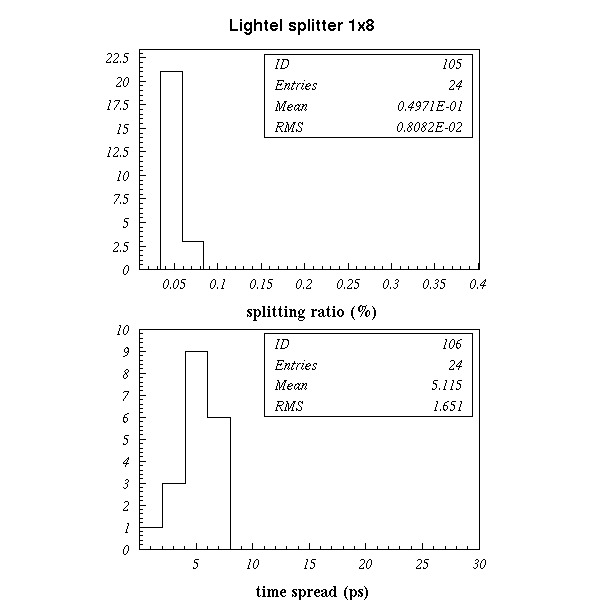
| no of tested | splitting ratio | tot. insertion loss (dB) | ||
|---|---|---|---|---|
| specimens | ||||
| OZ/Optics 1x4 50 m | 8 | |||
| Lightel 1x4 50 m | 5 | |||
| Lightel 1x8 50 m | 3 | |||
| OZ/Optics 1x4 100 m | 2 | |||
| Lightel 1x4 100 m | 2 |
3.3 Temperature dependence for optical components
As the variation of delays is mainly due to thermal excursions in the experimental hall housing the used TOF system, it is important to study also the influence of temperature on the fibers to be used in the calibration system. A precision LAUDA cooling thermostat RP845 (precision of the thermal bath), where a part of the fiber under test was kept at fixed temperature, was added to our test system. Different patches were tested: two 15 m Thorlabs AFS 50/125 and OZ/OPTICS UVVIS fiber patches (14 m in the thermal bath, 1 m in air) and one 30 m OZ/OPTICS IRVIS 50/125 fiber patch (28 m in the thermal bath, 2m in air). Results are shown in figure 10 and no relevant influence is seen in the operating range between -10 and 50 for the most important parameters.

The same tests were done to measure the behaviour of a specimen of Lightel 1x4 and OZ/Optics 1x4 optical splitters as a function of temperature. Results are shown in figure 11 and, as before, no relevant influence is seen in the operating range between -10 and 50 .


In conclusion, the tested optical components: switches, fused fiber splitters, fiber patchcords seem all suitable to assemble the pulse delivery system for a diode laser based calibration system, either with 50 m or 100 m MM fiber’s core diameter, mantaining the original time characteristics of the input laser calibration pulse.
3.4 Timing properties of the full laser pulse delivery system
A laser pulse delivery system, based on optical switches, fused optical splitters and fiber patches to inject light into the channels to be calibrated, provides light calibration pulses with time resolution given by:
| (4) |
where ps is the original laser pulse resolution, ps is the time spread introduced by the optical switch, ps is the one introduced by the fiber splitters and ps/m) is the one introduced by the used fiber patches.
In the prototype calibration system, assembled at INFN Sezione Milano Bicocca, OZ/OPTICS IRVIS 50 m fibers were used. They have a pulse width dispersion ps/m, an attenuation dB/m, with a temperature effect assuming an temperature excursion of for a 10 m fiber, and a delay ns/m. In its present configuration, up to 36 (72) individual channels (using or splitters) may be calibrated. It may be easily extended to configurations with up to 100-200 channels. Configurations with more channels require more powerful diode-lasers systems, that are difficult to find now on the market or a more tight control on the power budget of the system. Figure 1 shows the setup presently assembled in laboratory, where the light from one splitter is injected, by means of a reflection prism, into the center of the scintillation counter to be calibrated.
Using the test setup of figure 2, where the full laser pulse delivery system under test (up to the splitter output) is put between the fiber scrambler and the Hamamatsu G4176 photodiode, it was possible to estimate the timing characteristics of the proposed system. They are resumed in table 6. From table 6 we may estimate that, for the system under test, ps in agreement with the estimate from equation 4 1313 13 in this estimate is evaluated through the quadratic difference of FWHM at the end of the calibration system and after the Mode Scrambler, taking into account our measurement of the intrinsic laser width.
| after Mode Scrambler | at end of cal. system | at end of cal. system | |
|---|---|---|---|
| (OZ/Optics 1x4 splitters) | (Lightel 1x4 splitters) | ||
| P.H. (mV) | |||
| risetime (ps) | |||
| FWHM (ps) |
4 Test of a prototype calibration system
The calibration system resolution () is determined by the goodness of the timing properties of the rising edge of the laser calibration pulse 1414 14 strongly dependent of the smallness of the laser pulse width, that in the gaussian approximation is related to the rising edge via the formula: risetime(10-90 %) = 0.717 x FWHM, that gives the STOP signal, and from the jitter on the START signal (in our case given by the fast photodiode in ch no 3). Therefore, only a direct test may estimate properly the value of the calibration resolution.
The prototype calibration system, shown in figure 1, was tested using a 1m long 100/125 m MM fiber to inject light into the scintillator bar of the system to be calibrated.
About of the laser light arrives to the injection prism for the TOF scintillator bar under test, depending on the type of optical splitter used. With a trigger on cosmic rays, put at the center of the scintillation counter, it was possible to see that the calibration signal in the counter is roughly a factor 2-3 bigger than the one of cosmic muons.
The PMTs’ signals were acquired with a VME system, based on a CAEN V2718 interface, and sent after a 50% passive splitter to a CAEN V792 charge integrating analog-to-digital module (QADC) and a CAEN V1290 time-to-digital module (TDC), after a CAEN V895 leading edge discriminator, with a threshold set at a -50 mV value. The two TDC signals () are computed as differences between the L/R PMT discriminated signal (STOP) and a reference signal (START) sent, after the splitter, to a fast photodiode 1515 15 Thorlabs DET02A, rise time 50 ps and fall time 150 ps, with CAEN A1423 wideband amplifier.
A home-written data acquisition system acquired data from both TDC’s and ADC’s as a binary file, that was later analyzed with the ROOT package [25].
The intrinsic detector resolution may be evaluated from a gaussian fit to the distribution, as , see [26] for more details. From measurements with the full calibration system inserted was estimated around 52 ps, as seen in figure 12. Injecting directly the laser pulse into the scintillator bar under test we obtained instead ps.


Assuming that the difference is due only to the presence of the calibration system from the initial 1x2 splitter to the final 1m long injection fiber, a calibration resolution around 18 ps may be estimated 1616 16 The calibration resolution has simply been estimated from the quadratic difference of , corresponding to the measured scintillator counter time resolution , with and without the calibration system inserted. This number has to be compared with the intrinsic resolution of the TOF system to be calibrated (see formula 3). and demonstrates that such a system may be useful for TOF detectors with an intrinsic resolution down to 50-100 ps.
5 Conclusion
Optical components to assemble a calibration system, based on a laser diode as a light source, have been extensively tested. Optical switches and fused splitters introduce minimal deterioration on the timing properties of the delivered laser pulse. The same is true for optical fiber patches, if their length is less than 10-20 meters. A prototype system has been assembled in laboratory at INFN Sezione Milano Bicocca, showing that calibration resolutions around 20-30 ps are within reach. Therefore, we conclude that such a calibration system may be used for fast TOF system based on scintillators, with up to 100-200 channels and timing resolutions in the range 50-100 ps, such as the one developed for the MICE experiment at RAL [23]
The obtained results on optical properties of fiber patches, fused fiber splitters, optical switches may be of interest also for the calibration/ monitoring of new timing systems based on PMTs, such as the ones foreseen for future large Liquid Argon TPCs [24].
Acknowledgements
We would like to acknowledge the skilfull work of Mr. R. Mazza, F. Chignoli of INFN Milano Bicocca and M. Prata of INFN Pavia for help in the realization of the test setup and thank Dr. L. Mariani of dB Electronics, Dr. M. Bombonati of Hamamatsu Italia and Ing. G. Manusardi of Fiberlan srl for helpful discussions.
References
- [1] Baldo Ceolin,M. et al. , "The time-of-flight TOFW detector of the HARP experiment: Construction and Performance", Nucl. Instr. Meth. A532 (2004) 548.
- [2] Bertoni, R. et al., "The design and commissioning of the MICE upstream time-of-flight system", Nucl.Instrum.Meth. A615 (2010) 14.
- [3] Dussoni, S. et al., "The Timing Counter of the MEG Experiment: Design and Commisioning", Nucl. Instr. Meth. A617 (2010),387.
- [4] G. Palla et al., “ The grid-geometry time-of-flight detector used in the NA49 experiment at CERN-PS”, Nucl. Instr. Meth. A451 (2000) 406
- [5] W. Braunschweig et al., “ A large area time-of-flight system with a resolution of 0.5 ns fwhm”, Nucl. Instr. Meth. 134 (1976) 261
- [6] V. Sum et al., “ A time-of-flight array for 1 to 2 GeV/c particles”, Nucl. Instr. Meth. A 326 (1993) 489
- [7] S. Denisov et al., “ Characteristics of the TOF counters for GlueX experiment”, Nucl. Instr. Meth. A494 (2002) 495
- [8] G. Barbarino et al., “The PAMELA time-of-flight system: status report”, Nucl. Phys. Suppl. B125 (2003) 298
- [9] R. Heller et al., “The Argus time-of-flight system”, Nucl. Instr. Meth. A235 (1985) 26
- [10] H. Kichimi et al., “The Belle TOF system”, Nucl. Instr. Meth. A453 (2000) 315
- [11] Ch. Paus et al., “ Design and Performance tests of the CDF time-of-flight system”, Nucl. Instr. Meth. A461 (2001) 579
- [12] Y. Kubota et al., “ The CLEO II detector”, Nucl. Instr. Meth. A320 (1992) 66
- [13] Baldo Ceolin,M. et al., Performance of the N- Scintillation counters Trigger and TOF System, Nuovo Cimento 105A (1992) 1679.
- [14] G.C. Bonazzola et al., “ Performances of the OBELIX time-of-flight system”, Nucl. Instr. Meth. A356 (1995) 270
- [15] S. Banerjee et al., “ Design and performances of a time-of-flight system for particle identification at the FERMILAB Collider”, Nucl. Instr. Meth. A269 (1988) 121
- [16] Brown,J.S. et al., "The Mark III time-of-flight system", Nucl. Instr. Meth. 221 (1984),503
- [17] Smith, E.S. et al., "The time-of-flight system for CLAS", Nucl. Instr. Meth. 432 (1999) 265.
- [18] B. Adeva et al., “ The time-of-flight detector of the DIRAC experiment”, Nucl. Instr. Meth. A491 (2002) 41 C34, 1729 (1980).
- [19] Kishida, T. et al., "A laser calibration system for the KEK TOPAZ barrel TOF counters", Nucl. Instr. Meth. 254 (1987) 367.
- [20] Bonesini, M. et al., "Construction of a Fast Laser-based Calibration System for the Harp TOF counters Wall", IEEE Trans. Nucl. Sci NS-50 (2003) 1053
- [21] Bondila, M. et al., " ALICE T0 Detector", IEEE Trans Nucl. Science 52 (2005) 1705.
- [22] M. Bonesini et al., “ Laboratory tests for Diode-laser based Calibration Systems for Fast Time-of-flight Systems”, POS(Tipp 2014) 230.
- [23]
Gregoire, G. et al.,"MICE Technical Report",
2005,Rutherford Appleton Laboratory";
M. Bonesini, “Progress of the MICE experiment ”, PoS EPS-HEP2015 (2015) 521. - [24] M. Bonesini [Icarus/WA104 Coll.], “The WA104 Experiment at Cern ”, J.Phys. Conf. Ser. 650 (2015) 1,012015.
- [25] https://root.cern.ch/doc/master/index.html
- [26]
W.B. Atwood, Lecture at SLAC Summer Institute, 1980,
p. 287;
M. Bonesini, “ A Review of Recent Techniques for TOF detectors”, Villaolmo, Conf. Proceedings, p. 455, 2003