An achromatic break in the afterglow of the short GRB 140903A:
evidence for a narrow jet
Abstract
We report the results of our observing campaign on GRB 140903A, a nearby () short duration (0.3 s) gamma-ray burst discovered by Swift. We monitored the X-ray afterglow with Chandra up to 21 days after the burst, and detected a steeper decay of the X-ray flux after 1 day. Continued monitoring at optical and radio wavelengths showed a similar decay in flux at nearly the same time, and we interpret it as evidence of a narrowly collimated jet. By using the standard fireball model to describe the afterglow evolution, we derive a jet opening angle 5 deg and a collimation-corrected total energy release 21050 erg. We further discuss the nature of the GRB progenitor system. Three main lines disfavor a massive star progenitor: the properties of the prompt gamma-ray emission, the age and low star-formation rate of the host galaxy, and the lack of a bright supernova. We conclude that this event was likely originated by a compact binary merger.
Subject headings
X-rays: bursts; gamma ray burst: individual (GRB 140903A);.
I. Introduction
Gamma-ray bursts (GRBs) are produced by a highly relativistic outflow collimated into jets. The angular size of the outflow is therefore a key ingredient in determining the true energy release and the event rate. These parameters provide a crucial test for any progenitor and central engine model.
Measuring the collimation of short duration GRBs, i. e. those lasting less than 2 s [56], is not only a primary interest of the GRB field, but has a broader impact. Growing observational evidence connects short GRBs with compact binary mergers [44, 84, 14, 98, and references therein], which are among the most promising sources of gravitational wave (GW) radiation [86, 2]. Therefore, the degree of collimation of short GRBs is a critical input for inferring the true rate of binary mergers, the expected detection rate of advanced LIGO and Virgo [1], and for estimating our chances to observe the electromagnetic counterpart of a GW source (Abbott et al. 3, Troja et al. 90).
Observationally, the beamed geometry leaves a clear signature in the afterglow temporal evolution, manifesting itself as an achromatic light curve break (known as “jet-break”), visible on timescales of days-weeks after the explosion [72]. At early times (hours after the explosion), the evolution of the afterglow is the same as for a spherical explosion. However, later on, the jet edges become visible causing the observed flux to rapidly fall off [94, 93]. For a jet expanding into a homogeneous ambient medium such steepening takes place at a time [76, 94], when the outflow is decelerated down to a bulk Lorentz factor , where is the jet half-opening angle. The detection of a jet-break in the afterglow light curve is therefore an important diagnostic tool for constraining the outflow geometry, and the burst energetics.
In the case of short bursts, the faintness of their afterglows often hampers the search for jet-breaks. Only a small fraction of short GRBs have been detected at optical or radio wavelengths, and often sampled too poorly to meaningfully constrain the afterglow temporal evolution [53, 32]. Nicuesa Guelbenzu et al. [66] presented good evidence for an achromatic steepening in the optical/NIR light curve of the short GRB 090426. However, the classification of this burst is rather ambiguous [6, 58], and it was proposed that the event was more likely an interloper, originated by a massive star progenitor [85, 95, 66]
Candidate jet-breaks have been identified in several X-ray afterglows of short GRBs (Burrows et al. 21, Soderberg et al. 2006, Stratta et al. 83, Fong et al. 39, Coward et al. 29, Zhang et al. 104), however their interpretation as jet-breaks remain quite controversial. Several studies suggest that the X-ray light curves may be shaped by a persistent energy injection from the central engine [36, 23, 73] rather than by external shock emission [62]. In this scenario the sharp decay of the X-ray flux is attributed to the rapid turn-off of the energy source rather than to the outflow geometry, and no collimation is needed to explain the observed light curves. Indeed, in the small sample of events with simultaneous optical and/or radio coverage (e.g. GRB090510, De Pasquale et al. 33; GRB130603B, Tanvir et al. 84) the observed temporal breaks appear to be chromatic rather than frequency-independent. The jet-break interpretation, to still hold, would require an alteration of the basic jet model, such as a two-component jet [28], evolving shock parameters [33], or the presence of additional emission components [42, e.g.].
In this paper, we present our multi-wavelength campaign of the short GRB 140903A which revealed an achromatic break in its afterglow light curve. Through the analysis of the broadband data, we show that the observed emission is fully consistent with the standard forward shock model, and requires a narrowly collimated outflow. A previous analysis of this event, based on Swift observations, did not detect the presence of a jet-break in the X-ray data [38]. Our addition of deep, late-time Chandra observations is indeed critical for the jet-break detection and its characterization. We further investigate the GRB classification and the nature of its progenitor, and conclude that this event is a bona fide short GRB, likely originated by a compact binary merger. The paper is organized as follows: our observations and data reduction procedures are detailed in II; we present our analysis of the GRB prompt emission, its afterglow and host galaxy in III; our results are discussed in V. Throughout the paper, times are referred to the Swift trigger time, and the phenomenology of the burst is presented in the observer’s frame. We employ a standard CDM cosmology with km s-1 Mpc-1, = 0.308, and =0.692 [70]. Unless otherwise stated, errors are given at the 68% confidence level for one interesting parameter, and upper limits are reported at the 3 confidence level.
II. Observations and Data Reduction
II.1. Swift BAT and XRT
GRB 140903A triggered the Swift Burst Alert Telescope [11, BAT;] at 15:00:30 UT on 3rd September, 2014 [30]. The Swift X-ray Telescope [22, XRT;] began settled observations of the GRB field 74 s after the BAT trigger, and monitored the X-ray afterglow during the following 3 days, until the source faded below the detector sensitivity threshold. The XRT data comprise 24 ks acquired in Photon Counting (PC) mode.
BAT and XRT data were processed using the Swift software package distributed within HEASOFT (v. 6.17). We used the latest release of the BAT and XRT Calibration Database, and followed standard data reduction procedures.
II.2. Chandra
The Chandra X-Ray Observatory performed two Target of Opportunity (ToO) observations in order 1) to precisely localize the X-ray afterglow (PI: T. Sakamoto), and 2) to characterize its late-time temporal evolution, and search for a possible jet-break (PI: E. Troja). Our first observation (ObsId 15873) (catalog ADS/Sa.CXO#obs/15873) started 3 d after the burst, and observed the field for a total exposure of 19.8 ks. Our second Chandra observation (ObsId 15986) (catalog ADS/Sa.CXO#obs/15986) was performed on 2014, Sep 18. for a total exposure of 59.3 ks. Chandra data were reduced using version 4.6.1 of the CIAO software with CALDB version 4.6.3. Events from the GRB afterglow were selected using a source extraction radius of 2 pixels, and the derived count rates were corrected for vignetting effects and Point Spread Function (PSF) losses. The background contribution was estimated from an annular, source-free region centered on the afterglow position.
The GRB afterglow is detected at both epochs. In our first Chandra observation we detect 80 net source counts in the 0.5-8.0 keV energy band. We corrected the native Chandra astrometry by aligning our X-ray and optical images (see II.3). Based on the match of five bright X-ray and optical sources, we determine a refined X-ray (J2000.0) position of , with an error radius of 0.4″(90% confidence level). In our second and last Chandra observation only 6 counts are measured at the source position, corresponding to a detection significance 99.99% [57].

II.3. Discovery Channel Telescope
We initiated an observing campaign with the Large Monolithic Imager (LMI) mounted on the 4.3 m Discovery Channel Telescope (DCT) in Happy Jack, AZ. Observations in the filters started on 2014 Sep 04 at 3.17 UT, approximately 12 hours after the Swift trigger, and continued to monitor the field for the next 3 weeks. Late-time images in the and filters were acquired on 2016 March 17 (561 days after the burst) and used as templates for image subtraction. Standard CCD reduction techniques (e.g., bias subtraction, flat-fielding, etc.) were applied using a custom IRAF11 1 IRAF is distributed by the National Optical Astronomy Observatory, which is operated by the Association of Universities for Research in Astronomy (AURA) under cooperative agreement with the National Science Foundation. pipeline. Individual short (10–20 s) exposures were aligned with respect to astrometry from the Sloan Digital Sky Survey (SDSS; Ahn et al. 4) using SCAMP [15] and stacked with SWarp [16].
As shown in Figure 1, the field of GRB 140903A is quite complex: the optical afterglow lies on top of a relatively bright host galaxy (see below), and only 12″ away from an extremely bright ( mag) star. In order to extract the afterglow brightness from our DCT images, we performed digital image subtraction with the High Order Transform of PSF ANd Template Subtraction (HOTPANTS; Becker 13). The resulting photometry, calibrated with respect to nearby point sources from SDSS, is presented in Table 1. The transient is detected with high significance in our first epoch at hr, and possibly at 2.5 days, although the significance of this last detection is only marginal (3 ).
Using the images from 2016 March 17, we measure the following magnitudes for the underlying host galaxy: , and . From earlier observations we also measure , and , although we caution that these fluxes may include some afterglow contribution. The host is unresolved in all of our DCT images (seeing ranging from 08–20). Using astrometry from nearby SDSS point sources for reference, we measure a (J2000.0) position of , . The excess afterglow flux measured in our subtracted images is consistent with this location, within the estimated uncertainty of our astrometric tie (100 mas in each coordinate).
| Date | Time Since Burst | Telescope | Instrument | Filter | Exposure Time | Afterglow Magnitudea | Host Magnitudea |
|---|---|---|---|---|---|---|---|
| (UT) | (d) | (s) | (AB) | (AB) | |||
| 2014 Sep 4.13 | 0.51 | DCT | LMI | 300 | |||
| 2014 Sep 4.15 | 0.53 | DCT | LMI | 300 | |||
| 2014 Sep 4.22 | 0.60 | Gemini | GMOS | 120 | |||
| 2014 Sep 5.18 | 1.55 | DCT | LMI | 630 | |||
| 2014 Sep 5.26 | 1.63 | Gemini | GMOS | 600 | |||
| 2014 Sep 6.12 | 2.50 | DCT | LMI | 600 | 22.3b | ||
| 2014 Sep 6.15 | 2.52 | DCT | LMI | 600 | |||
| 2014 Sep 6.17 | 2.55 | DCT | LMI | 600 | 21.97 0.16 | ||
| 2014 Sep 6.20 | 2.57 | DCT | LMI | 600 | 19.66 0.08 | ||
| 2014 Sep 6.84 | 3.22 | LT | IO:O | 900 | |||
| 2014 Sep 8.12 | 4.49 | DCT | LMI | 600 | 22.9 | ||
| 2014 Sep 8.14 | 4.52 | DCT | LMI | 340 | |||
| 2014 Sep 8.84 | 5.22 | LT | IO:O | 1200 | 19.640.13 | ||
| 2014 Sep 13.82 | 10.20 | CAHA | 720 | 18.920.05 | |||
| 2014 Sep 13.84 | 10.22 | CAHA | 1200 | 18.570.07 | |||
| 2014 Sep 13.85 | 10.23 | CAHA | 1800 | 18.250.05 | |||
| 2014 Sep 23.11 | 19.49 | DCT | LMI | 600 | |||
| 2016 Mar 17.92 | 561 | DCT | LMI | 880 | 20.580.09 | ||
| 2016 Mar 18.19 | 561 | DCT | LMI | 880 | 20.120.05 | ||
| 2016 Apr 02.48 | 577 | Gemini | GMOS | 600 | 20.280.09 |
II.4. Liverpool and Calar Alto Telescopes
Near-IR images were acquired in -bands using the 2.0m Liverpool (LT) and the 3.5m Calar Alto telescopes (CAHA). The LT images were taken in the -band with the IO:O camera, which provides a field of view and a pixel scale. The CAHA data were acquired in the -bands with the instrument, yielding a field of view and a pixel scale. In order to reduce the contamination of the nearby bright star, these observations were taken in relatively short (20 s - 30 s) exposures. The reduction followed standard steps; bad pixel masking, bias and flat field correction, sky subtraction, plus stacking, performed by calling on IRAF tasks [87]. The resulting photometry, calibrated with respect to nearby point sources from SDSS and 2MASS [82], is presented in Table 1. We used the offsets from Blanton & Roweis [18] to convert the 2MASS Vega magnitudes to the AB system.
II.5. Gemini Imaging
We imaged the field of GRB 140903A with the Gemini Multi-Object Spectrograph (GMOS; Hook et al. 47 on the 8 m Gemini North telescope. We obtained a single 120 s image beginning at 05:24 UT on 2014 Sep 4 ( hr), and a dithered sequence of 10 60 s exposures at a mean epoch of hr on 2014 Sep 5. Our last observation was performed on 2016 April 2 and used as template for image subtraction. The images were reduced in the standard manner using the gemini IRAF package. We performed digital image subtraction on the GMOS images using the same analysis methods as was used for the DCT images (Sect. II.3). In the subtracted frame transient emission is clearly detected at an offset of 9644 mas from the galaxy’s center. At a redshift =0.351 this corresponds to a physical projected offset of 0.50.2 kpc. For the transient component we infer mag in our first epoch, and mag in the second epoch. This implies a steep temporal decay with slope =1.540.15 between the two observations.

II.6. Gemini Spectroscopy
We obtained a series of spectra of the afterglow+galaxy with GMOS beginning at 05:34 UT on 2014 Sep 4 ( hr). GMOS was configured with the R400 grating and a central wavelength of 600 nm, providing coverage from –8000 Å with a resolution of . We restricted our analysis to 5500 Å due to the poor signal-to-noise of the spectrum at lower wavelengths.
The resulting spectrum is plotted in Figure 2. The strongest (non-telluric) feature is a broad (FWHM15 Å) absorption line at Å, along with a weaker (but still broad, FWHM10 Å) absorption line at Å. We interpret these features as corresponding to Na I with . We also detect narrow emission lines at Å and Å, which correspond to H and [O III] at , which we adopt for the redshift of the host22 2 The weaker [O III] 4959 line falls in the chip gap at = 0.351.. Weak absorption features corresponding to Ca II H+K are also visible at this redshift, though with marginal significance.
II.7. GTC Spectroscopy
Further optical spectroscopy of the host galaxy was performed using OSIRIS (Optical System for Imaging and low Resolution Integrated Spectroscopy; Cepa et al. 25) at the 10.4 m GTC. Observations started on Oct 03, 2014, i.e. 30.2 d after the trigger, using the R1000B grism (2600 s exposures) and R2500I VPH (3600 s exposures). The spectra covered the 3600–7800 Å range at a resolution of 1000 and the 7300–10,000 Å range at resolution 2500. The 1.0” slit was positioned on the location of the host galaxy and 2 2 binning mode was used for data acquisition. The obtained spectra were reduced and calibrated following standard procedures using custom tools based in IRAF and Python. Spectra were flux calibrated using the spectrophotometic standard star GD248, which was observed during the same night with a 2.52″ slit. In order to account for slit losses, we renormalized the flux of the source to match the DCT magnitudes shown in Table 1. Acquisition images were not usable due to the nearby saturated star.
Although close to a skyline, H is clearly detected in the red spectrum at Å, consistent with the redshift from GMOS (Section II.6). No emission lines are visible in the blue grism spectrum. This may be due to the presence of dust, also suggested by a clear spectral curvature towards the short wavelengths.
| Date | Time Since Burst | Frequency | Flux |
|---|---|---|---|
| (UT) | (d) | ( GHz) | (Jy) |
| 2014 Sep 04.06 | 0.44 | 6.1 | 11811 |
| 2014 Sep 06.13 | 2.51 | 6.1 | 20313 |
| 9.8 | 15310 | ||
| 2014 Sep 07.92 | 4.30 | 6.1 | 14117 |
| 2014 Sep 12.89 | 9.27 | 6.1 | 9020 |
| 9.8 | 75 | ||
| 2014 Sep 21.88 | 18.26 | 6.1 | 130 |
II.8. Jansky Very Large Array
GRB 140903A was observed with the Jansky Very Large Array (VLA) at both 6.1 GHz (C-band) and at 9.8 GHz (X-band). Observations started 10 hrs after the burst, and periodically monitored the source for 18 days [38]. Radio data were downloaded from the public NRAO archive, and reduced using the Common Astronomy Software Applications (CASA) v. 4.5.2 package. After standard calibration and basic flagging, we visually inspected the data and applied further screening when needed. Galaxies 3C286 and J1609+2641 were used as flux and phase calibrators, respectively. The log of radio observations is reported in Table 2. Our values are slightly higher, but largely consistent with those reported by Fong et al. [38]. A simple power-law fit to the data yields decay slopes =0.63 and 0.5 for 1 d. This does not take into account the possible effects of interstellar scintillations (ISS), which we model in Section IV.2.
III. Data Analysis
III.1. Gamma-ray data
The prompt emission consists of a main Fast Rise Exponential Decay (FRED) pulse, with a duration of = 0.300.03 s in the 15-350 keV band (Figure 3, left panel). The time-averaged spectrum, from T+0.09 to T+0.47, shows that the prompt emission is well described (=44 for 57 degrees of freedom) by a simple power-law with =1.990.08. According to this best fit model, the burst fluence in the observed 15-150 keV energy band is (1.35)10-7 erg cm-2, which, at a redshift =0.351, corresponds to an isotropic-equivalent energy of =(6.00.3)1049 erg. Due to the narrow BAT energy bandpass, this only places a lower limit to the bolometric energy release. However, for a typical GRB spectrum [8], the measured soft photon index indicates that the spectral peak lies close to or within the BAT energy range [75]. In this case, the bulk of the emission mainly falls within the observed range, and the derived value of represents a good estimate of the total energy radiated in the prompt emission.

Spectral lags were calculated by cross-correlating the light curves in the standard BAT channels: 1 (15-25 keV), 2 (25-50 keV), 3 (50-100 keV), 4 (100-350 keV). We followed the method outlined by Ukwatta et al. [91] and, in order to increase the signal-to-noise in the higher energy channels, performed the analysis on non mask-weighted lightcurves, each with a 4 ms time resolution. The derived lags are =12 ms and =-1 ms, where the quoted uncertainties were derived by Monte Carlo simulations. The results of our lag analysis are shown in Fig. 3 (right panel).
We also searched for temporally extended emission following the main burst, but no significant signal was found. By assuming a power-law spectrum with photon index =2, we set a 3 upper limit of 810-10 erg cm-2 s-1 (15-50 keV) in the time interval 10-100 s. This is consistent with the MAXI upper limit of 8.410-10 erg cm-2 s-1 in the 4-10 keV energy band [79].
III.2. X-ray data
III.2.1 Spectral analysis
The afterglow spectral parameters were derived from the time-averaged XRT/PC spectrum (from 100 s to 110 ks). We binned the data in order to have at least 1 count per spectral channel, and performed the fit within XSPEC [7] v.12.9.0 by minimizing the Cash statistic. The spectrum is well described by an absorbed power law model (W-stat=329 for 359 degrees of freedom, d.o.f.). The best fit parameters are a photon index =1.660.09, and an absorbing column (=0.351)=(1.30.4)1021 cm-2, in excess to the Galactic value =2.91020 cm-2 in the burst direction [52]. The adopted value is consistent within errors with the = cm-2 estimated by Willingale et al. [96].
In our first Chandra observation, the source spectrum is well fit (W-stat=55 for 58 dof) by an absorbed power law model with =1.80.2, and =1.31021 cm-2, fixed at the value of the XRT best fit. In our second and last Chandra observation the low number of counts prevents any spectral analysis. As the hardness ratios of the two Chandra observations are consistent within the uncertainties, the same spectral parameters were adopted to estimate the observed flux.
For the best fit parameters quoted above, we derived an unabsorbed energy conversion factor (ECF) of (4.80.2)10-11 erg cm-2 cts-1 for the Swift/XRT data, and of (1.400.15)10-11 erg cm-2 cts-1 for the Chandra ACIS-S data.
III.2.2 Temporal Analysis
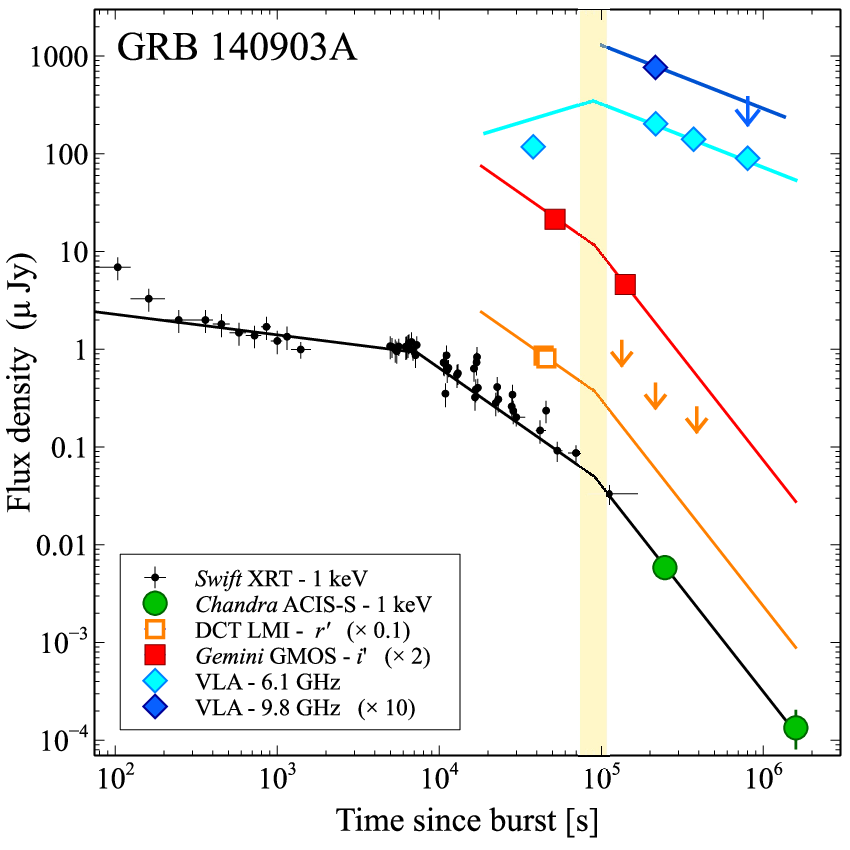
The X-ray light curve was binned to have a minimum of 15 counts in each temporal bin. The observed count-rates were converted into flux units by using the ECFs derived in Section III.2.1, and by propagating the relative uncertainties. We modeled the afterglow temporal decay with a series of power-law segments () and minimized the statistics to obtain the best fit to the data. The afterglow displays a shallow decay phase with temporal index 0.2, which steepens to 1.1 after 7 ks. Our first Chandra/ACIS-S data point lies below the predictions based on the Swift/XRT dataset, hinting at a second temporal break in the light curve. However, the combined XRT/ACIS-S dataset could be reasonably well described by adopting a steeper temporal index 1.5 for the final power-law decay, and no additional break. A second Chandra observation was therefore executed in order to distinguish between the two models. This last measurement confirms the presence of an additional break in the X-ray light curve at a time 1 d, and allows us to constrain the slope of the final decay to 2.1 The best fit temporal models are summarized in Table 3. The X-ray light curve and our best fit model are presented in Fig. 4, and compared to the optical (Table 1) and radio measurements (Table 2) in order to highlight the achromatic nature of the last temporal break , which we interpret as the jet-break time.
| Band | / dof | |||||
|---|---|---|---|---|---|---|
| (ks) | (ks) | |||||
| X | 0.200.02 | 7.3 | 1.06 | 69 | 2.11 | 43 / 46 |
| O | 1.540.15 | – | – | – | – | – |
| X+O | 0.210.02 | 7.9 | 1.16 | 89 | 2.1 | 49 / 48 |
| R (6.1 GHz) | -0.5a | 89 | 0.630.14 | – | – | – |
| R (9.8 GHz) | 0.5 | – | – | – | – | – |
III.3. Afterglow Spectral Energy Distribution
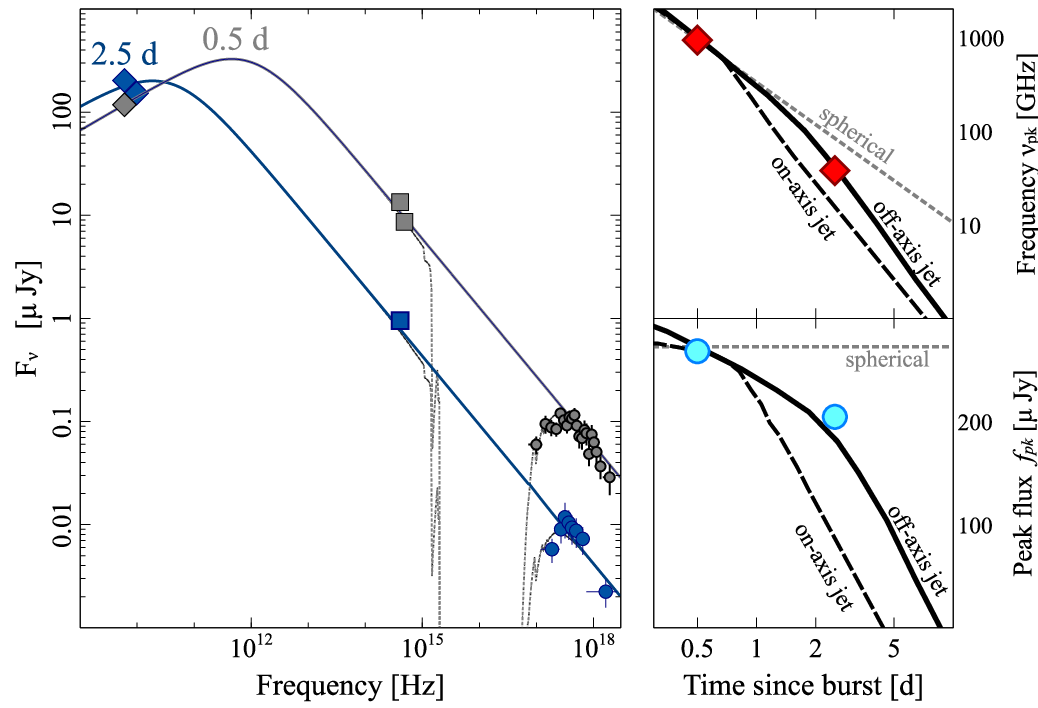
In order to study the spectral evolution across the temporal break detected in X-rays, we extracted the afterglow spectral energy distribution (SED) at two different epochs, =0.5 d () and =2.5 d (). These times were selected in order to maximize the simultaneous coverage at different wavelengths.
Optical fluxes were derived by the best fit temporal model in Table 3, and corrected for Galactic extinction in the GRB direction (0.03; Schlegel et al. 78). A power-law fit ( ) to the optical and X-ray data yields spectral slopes =0.720.05 at =, =0.760.12 at =, significant intrinsic absorption =(1.80.4)1021 cm-2, and marginal evidence of dust extinction . The simple power-law fit provides a good description of the dataset (W-stat=355 for 371 d.o.f.), suggesting that optical and X-ray emission belong to the same spectral segment () of the synchrotron spectrum. The lack of significant spectral variation across the temporal break is consistent with the properties of a jet-break, and exclude alternative interpretations (e.g. cooling frequency).
By extrapolating the observed spectrum to radio energies, the predicted flux at = is 10 mJy, two orders of magnitude higher than the radio measurement. This implies a spectral break between the optical and radio band, and that the radio data belong to a different spectral segment (). By adopting the standard closure relations for GRB afterglows [103] we fixed the radio spectral index to , and fitted the broadband SED with a smoothly broken power-law. We added to the model a systematic uncertainty in order to take into account the possible effects of interstellar scattering and scintillation at radio wavelengths. Although a proper estimate of the ISS fluctuations requires more complex modeling (see Section IV.2), at this stage we introduce an uncertainty of 30%. Our fit constrains the spectral peak to lie in the IR region at 9.31011 Hz at 0.5 d. At our second epoch, the radio measurements are only slightly lower than the extrapolation of the higher energy spectrum, implying that the spectral peak moved close to the radio band. We estimate 37 GHz at 2.5 d, above the VLA frequencies. This shows that the observed radio, optical and X-ray emission remained in the same spectral regime, thus the observed temporal break was not caused by spectral variations. Basic considerations on the spectral and temporal behavior of the afterglow disfavor a wind-like environment, which would cause a steeper decay (1.5) of the pre-break X-ray afterglow. Our analysis also shows that the broadband spectrum evolved in time as , and . As shown in Figure 5 (right panels), these decay rates are significantly steeper than the ones predicted by the spherical fireball model for a uniform medium, and are instead consistent with the spectral evolution of a collimated outflow. In particular, the slow decay of the peak flux strongly favors a narrow jet model seen slightly off-axis.
III.4. Host Galaxy Properties
GRB 140903A is located on top of a compact and red galaxy, suggestive of an old system. Based on the galaxy sky densities in the -band [99], we estimated a small probability of a chance association, 310-4 [19, 89], and we therefore consider this galaxy as the GRB host. From our -band measurement we derive a rest-frame absolute -band magnitude -20.9 mag, or when compared to the luminosity function of galaxies at a similar redshift 0.20.4 [97]. In order to characterize the galaxy’s physical properties we used the late-time (3 d) optical and IR data to build the host galaxy SED, and ran a photometric fit with a grid of spectral templates within LEPHARE v. 2.2 [48]. The templates were created using the stellar population synthesis libraries of Bruzual & Charlot [20] with the Padova 1994 evolutionary tracks, and assuming the initial mass function from Chabrier [26]. We adopted an exponential star formation history with different -folding times , and included the contribution of emission lines following Kennicutt [55].
Our results are shown in Figure 6. Our best fit model (gray curve) well reproduces the optical and NIR continua. The best fit parameters for the galaxy template are: an intrinsic extinction =0.25, solar metallicity, -folding time =500 Myr, stellar mass log(M/M⊙)=10.610.15, an old stellar age =4.1 Gyr, and a moderate star formation rate SFR =1.00.3 M⊙ yr-1 in agreement with the presence of nebular emission lines in our spectra.
By using the extinction corrected H line flux we infer a comparable value of SFR = 0.380.04 M⊙ yr-1 [55] for a Chabrier IMF. and a specific SFR of 0.47 0.05 () M⊙ yr-1. Based on the diagnostic ([O III] 5007) / 0.48 [65], we estimate a super-solar metallicity 12 + log (O/H) 9.00.2, not unprecedented among short GRB host galaxies [68].

IV. Results
IV.1. Origin of the X-ray emission
The early X-ray afterglow of GRB 140903A is characterized by a period of fairly constant emission lasting 4 hr. The shallow decay slope 0.2 is not consistent with a standard forward shock origin, and this is often considered a sign of prolonged energy injection into the blastwave [101, 36, 23]. Indeed, it has been suggested that in a significant fraction of GRBs the X-ray plateaus are originated by the internal dissipation of the engine driven wind rather than by shocks at an external radius. In this scenario, known as “internal plateau” [88], the forward shock component is sub-dominant, and the observed X-ray emission is directly powered by the central engine. One of the most popular models invokes a newborn magnetar as the power source of the GRB and its afterglow: as the magnetar spins down, it injects energy into the jet causing a period of nearly flat emission (the plateau), followed by a steeper temporal decline with slope 2 [102]. This rapid decay may mimic the presence of a jet-break, complicating the interpretation of the observed X-ray emission.
In the case of GRB 140903A, the standard expression for magnetic dipolar radiation [81] provides an excellent description of the X-ray dataset, as it can fully account for the two salient features of the observed lightcurve – a short-lived plateau and a final steep decay – with the advantage of only two free parameters. However, due to the small radius at which the internal dissipation occurs, a bright optical and radio counterpart is not expected in these cases. Indeed a distinctive feature of ‘internal plateaus’ is that they appear as achromatic bumps visible in X-rays, but not at lower energies [88, 61, 73]. Our SED analysis showed instead that X-ray, optical and radio data are consistent with being from the same emission component. In particular, by considering that the radio data lie above the self-absorption frequency , we can derive a rough estimate of the emitting radius 41016 cm at =0.5 d [10], consistent with an external shock origin. Moreover, the observed temporal and spectral indices (0.7, 1.1) after the plateau phase are in agreement with the canonical closure relations for and 2.4. Based on these considerations, we favor an external origin for the observed X-rays. In this scenario, the X-ray plateau is indirectly powered by the central engine via sustained energy injection into the forward shock and, after the cessation of energy injection is communicated to the shock front, the afterglow evolves in a standard fashion [92]. Therefore, the X-ray emission is not directly linked to the time history of the central engine, instead it carries important information about the jet collimation, energetics, and surrounding environment.
IV.2. Afterglow modeling
We modeled the broadband dataset (from radio to X-rays) by using the standard prescriptions for an expanding spherical fireball, and the scaling relations for the post-jet-break evolution [76]. We excluded from the fit the early time data () as they are affected by persistent energy injection. In our fit we implemented a routine to calculate the expected ISS modulation for each set of input afterglow parameters. By adopting the ‘NE2001’ model [27], we derived a scattering measure SM = 1.310-4 kpc/m-20/3 and a transition frequency =8 GHz in the direction of GRB 140903A. Observations below this frequency could possibly be affected by strong scattering if the source size is smaller than the ISS angular scale, 1 as. At the GRB redshift this corresponds to an apparent fireball size 21016 cm, which is likely the case at the early timescales here considered. The derived ISS fluctuations were treated as a source of systematic uncertainty and added in quadrature to the statistical errors when evaluating the fit statistics.
We assumed a uniform circumburst medium with density , and constant microphysical parameters and . Under these assumptions, we did not find an acceptable fit to the data (=65 for 43 dof), mainly because the model predicts a much faster decay of the peak flux and peak frequency after the jet-break. We attempted to model this effect by leaving the microphysical parameters free to vary in time as and . Although the fit formally improves for 0.5, and 0.2, it yields an unphysical solution , and extreme values for the blastwave kinetic energy and the jet opening angle. We considered this model an unrealistic description of the explosion, and turned to a different interpretation to explain the observed properties.
As shown in Figure 5 (right panels), the temporal evolution of the broadband spectrum appears roughly consistent with a collimated fireball observed slightly off-axis. We therefore introduced in our model the effects of different viewing angles [94, 93]. This provides a better description of the observed data. The best fit parameters are an isotropic equivalent kinetic energy =4.31052 erg, a circumburst density =0.032 cm-3, and shock parameters =2.110-4, =0.14. We derived a jet opening angle of =0.0900.012 rad, and an observer’s angle of 0.055 rad. These values are similar to the opening angles inferred from other candidate jet-breaks [21, 29, 38].

IV.3. Constraints on SN-like transients
The possibility of an optical/IR transient rising a few days after the short GRB explosion is the current focus of intense research [9, 100, 54, e.g.]. The detection and identification of such transients [84, 98, 51, 50, e.g.] would represent the smoking gun proof of short GRB progenitors, and a powerful tool to search for electromagnetic counterparts of GW sources. We used our late-time observations to constrain some of the most promising models as well as the presence of an emerging supernova.
As shown in Figure 7 (left panel) our -band upper limits at 2.5 d and 4.5 d can constrain the presence of a fast-rising and rapidly decaying transient, peaking in the optical a few days after the burst. We considered two models: the classical Li & Paczyński [59] macronova (or kilonova) powered by the radioactive decay of the ejecta (shaded area), and the more recent merger-nova [100] powered by a long-lived magnetar (shaded area). Recent theoretical [9] and observational [84] results showed that the macronova emission is heavily suppressed at optical wavelengths due to the high-opacity of the ejecta. Models for the late-time infrared emission [9, e.g.], although highly dependent on the input physics, generally predict a signal (23 mag at 4 d) well below the sensitivity of our observations. However, exceptions may occur if a small amount of lanthanide-free material is ejected during the merger [54] or if the ejecta are re-energized by the central engine [100]. The resulting transient spans a wide range of luminosities depending on the details of the explosion, and our measurements can only constrain the bright end of the predicted values. For a Li & Paczyński [59] macronova with a typical ejecta mass of =M⊙ (thin solid line) we can exclude only the extreme values of the parameter (210-3), which measures the fraction of radioactive material converted into heat. Our limit is more interesting in the case of a larger ejecta mass of =0.1M⊙, for which we can exclude 10-5 (thick solid line). This is consistent with the most recent calculations of radioactive heating rate [63, 60].
Yu et al. [100] argued that, if the GRB central engine is a stable magnetar, the macronova luminosity could be boosted by several orders of magnitude. In this scenario, the main power source is the magnetar-driven wind rather than the radioactive decay energy. As shown in Figure 7, for a typical range of ejecta masses (10-2 M⊙) the predicted signal of a merger-nova (dashed line) could be consistent with our observations.
As mentioned in Section II.3, we found marginal (3 ) evidence of a signal in our observations 2.5 days post burst. The resulting magnitude, =23.110.36, is above the predicted afterglow signal and, if real, would imply an optical rebrightening between our Gemini observations at 1.5 d and the DCT observations at 2.5 d. When compared with the macronova predictions, this signal would require either an extreme value of the -parameter 510-410-3 for =0.01 M⊙, or a large ejecta mass, =0.1 M⊙, and 10-5, more typical of a NS-BH merger [40]. The merger-nova predictions could instead reproduce the observed flux for ejecta masses 10-3 M⊙, typical of NS-NS mergers [12].
Our last -band observation, performed three weeks after the burst, is used to constrain the contribution of a possible SN. In Figure 7 (right panel) we compare our upper limit with the light curves of SN1998bw and SN2006aj, associated to nearby long GRBs. The templates were created by compiling data from literature [41, 37] and then corrected for cosmological effects and extinction in a standard fashion. Our limit (-19 mag, rest-frame) is fainter than the emission expected from a SN1998bw-like explosion. Although our photometric dataset cannot exclude an event such as SN2006aj, we also note that the spectroscopic observations do not show any evidence of broad absorption lines typical of GRB-SNe.
V. Discussion
We have presented several lines of evidence linking GRB 140903A to the class of short duration GRBs [56], and in support of the popular compact binary merger model. Although characterized by a rather soft spectrum with photon index 2, the GRB prompt emission displays a very short duration (0.3 s), negligible spectral lags, and a low luminosity (1050 erg s-1), all key features of the class of short GRBs [67, 43]. The GRB afterglow was found on top of a relatively bright galaxy. Given the accurate afterglow localization, the probability of a chance alignment can be considered negligible (0.03%). Moreover, the galaxy’s properties (stellar mass, age, and metallicity) are broadly consistent with the population of short GRB host galaxies [77, 31, 14]. Both the environment and the lack of a bright SN (Section IV.3) disfavor a massive star progenitor, and support instead the merger model for GRB 140903A.
Direct evidence of a NS merger progenitor would be the detection of an r-process macronova [59]. Our observations constrain only a limited range of the parameter space and, for the most likely values of ejecta masses and heating fraction, our upper limits are consistent with theoretical predictions. A marginal detection in the residual image at 2.5 days could fit well the expected emission from a magnetar-driven macronova (or merger-nova; Yu et al. 100). Unfortunately, given the low significance of the detection, the lack of confirmation in other bands, and the complexity of the field, we cannot exclude that the observed feature is an artifact of the subtraction process. Although this does not allow us to draw any robust conclusion on this particular event, it shows that rapid and deep observations of short GRBs with large aperture telescopes are fundamental in order to pin down the possible onset of a macronova.
The most remarkable feature of this afterglow is the detection of an achromatic break at tj1 d followed by a steep decay of the X-ray flux. Several mechanisms have been suggested to explain a rapid decay of the X-ray afterglow [102, 88, 92, e.g.], although most of them predict a chromatic break preceding the steep flux decay. An achromatic break could be due to the cessation of energy injection. However, our analysis showed that the pre-break afterglow is consistent with the standard closure relations [103] without energy injection. We therefore interpret the observed break as evidence of a collimated outflow. Although early studies suggested the production of relatively wide outflows from NS mergers [74, 5], more recent works show that confinement from either the poloidal magnetic field [71] or the expanding cloud of ejecta [64, 34] can produce a jet-like structure. Our observations of GRB 140903A add compelling evidence that, at least some, short GRBs are beamed into narrow jets.
In Section IV.2 we constrained the basic properties of the jet: an opening angle 5∘, an isotropic-equivalent energy release 41052 erg, and a viewing angle 3∘. Our modeling yields a blast-wave kinetic energy that is significantly higher than the observed prompt gamma-ray energy. This would imply an unusually low radiative efficiency, 0.2%. However, since we observed the explosion slightly off-axis, the faint prompt emission could be due to a viewing angle effect: if the GRB jet is characterized by a compact central core and a steep radial gradient [49], an off-axis observer would indeed measure a dimmer and spectrally softer burst.
The beaming factor 250 has a direct impact on the GRB energy release and true event rate, and therefore on the progenitor models. Coward et al. [29] estimate the observed rate of short GRBs as 8 Gpc-3 yr-1. Collimation can boost this number up to 2103 Gpc-3 yr-1, which is consistent with the conservative rate density of NS-NS mergers from Abadie et al. [1]. This would suggest that most NS mergers successfully launch a short GRB, and that other systems, such as NS-BH or white dwarf binaries, do not contribute significantly to the observed GRB population. An important caveat to the above comparison between observations and progenitor models is that estimates of GRB jet angles are unavoidably biased by our observing strategy and limited sensitivity. Narrowly collimated jets, if pointed toward us, are more likely to trigger Swift over a larger volume and to produce bright afterglows, allowing for the jet-break detection. On the other hand, wide outflows of comparable energy produce dimmer GRBs and afterglows, which are harder to detect and characterize. A proper assessment of the GRB event rate should properly account for these observational biases.
The collimation-corrected energy release is 21050 erg, which is in the typical range for short GRBs and lower than average long duration bursts [24, 104]. Recently, Perna et al. 69 proposed a new mechanism to power a short GRB from a BH-BH collision. However, the low disc mass available in this system could only power a faint, low-luminosity transient, not consistent with the energetics measured in our case. GRB 140903A was more likely produced by a merger event in which at least one of the two compact objects was a neutron star. According to the standard NS merger model, a stellar-mass black hole surrounded by a hot massive torus is formed after the merger. Energy is extracted from this system through neutrino anti-neutrino annihilation or magnetically driven mechanisms. Pair annihilation of neutrinos and antineutrinos can supply an energy deposition rate 1051 erg s-1 [80, 17], consistent with the energy budget of GRB 140903A. Following the formalism of Fan & Wei [35], we use the burst energetics to estimate a post-merger disc mass 0.1 M⊙. This is in agreement with numerical simulation of merging NS-NS and NS-BH binaries. If instead the outflow is driven by more efficient magnetic processes, the disc mass could be as low as 10-3 M⊙, suggesting a high-mass binary NS merger [46]. An alternative scenario is the formation of a supra-massive and highly magnetized neutron star after the merger [45]. In this case, there are less robust predictions connecting the central engine and the GRB observed properties. A general requirement is that the total energy release should not exceed the maximum rotational energy of the newborn NS, 1053 (/2 )3/2 erg. The burst energetics are well below this limit, and consistent with the proto-magnetar model. A compact binary merger can therefore naturally explain the observed GRB properties, although the nature of the central engine and the energy extraction mechanisms remain uncertain. Only future detections of gravitational wave radiation will be able to ultimately discriminate between these different scenarios.
VI. Conclusions
We detected a temporal break in the X-ray afterglow light curve of the short GRB 140903A. The afterglow temporal decay was observed to steepen from 1.1 to 2.1, suggesting the presence of a jet-break at 1 d after the burst. Simultaneous observations at optical and radio wavelength showed that the break is achromatic.
This disfavors a large set of models, including the magnetar-powered ‘internal plateau’, which are expected to produce a chromatic break.
Instead we showed that the observed afterglow is consistent with the standard forward shock emission from a narrow jet expanding into a homogeneous medium.
We measure a jet opening angle of 5 deg, an observer’s angle of 3 deg, and a total energy release of 21050 erg.
Several lines of evidences link this event to the popular NS merger scenario: the prompt gamma-ray emission, the environment, the lack of a bright SN,
the energetics and rate of events.
Our results show that NS mergers can produce highly collimated outflows.
References
- [1] Abadie, J., Abbott, B. P., Abbott, R., et al. 2010, Classical and Quantum Gravity, 27, 173001
- [2] Abbott, B. P., Abbott, R., Abbott, T. D., et al. 2016a, Phys. Rev. Lett., 116, 061102
- [3] Abbott, B. P., Abbott, R., Abbott, T. D., et al. 2016b, ArXiv e-prints
- [4] Ahn, C. P., Alexandroff, R., Allende Prieto, C., et al. 2014, ApJS, 211, 17
- [5] Aloy, M. A., Janka, H.-T., & Müller, E. 2005, A&A, 436, 273
- [6] Antonelli, L. A., D’Avanzo, P., Perna, R., et al. 2009, A&A, 507, L45
- [7] Arnaud, K. A. 1996, in Astronomical Society of the Pacific Conference Series, Vol. 101, Astronomical Data Analysis Software and Systems V, ed. G. H. Jacoby & J. Barnes, 17
- [8] Band, D., Matteson, J., Ford, L., et al. 1993, ApJ, 413, 281
- [9] Barnes, J. & Kasen, D. 2013, ApJ, 775, 18
- [10] Barniol Duran, R., Nakar, E., & Piran, T. 2013, ApJ, 772, 78
- [11] Barthelmy, S. D., Barbier, L. M., Cummings, J. R., et al. 2005, Space Sci. Rev., 120, 143
- [12] Bauswein, A., Goriely, S., & Janka, H.-T. 2013, ApJ, 773, 78
- [13] Becker, A. 2015, HOTPANTS: High Order Transform of PSF ANd Template Subtraction, Astrophysics Source Code Library
- [14] Berger, E. 2014, ARA&A, 52, 43
- [15] Bertin, E. 2006, in Astronomical Society of the Pacific Conference Series, Vol. 351, Astronomical Data Analysis Software and Systems XV, ed. C. Gabriel, C. Arviset, D. Ponz, & S. Enrique, 112
- [16] Bertin, E., Mellier, Y., Radovich, M., et al. 2002, in Astronomical Society of the Pacific Conference Series, Vol. 281, Astronomical Data Analysis Software and Systems XI, ed. D. A. Bohlender, D. Durand, & T. H. Handley, 228
- [17] Birkl, R., Aloy, M. A., Janka, H.-T., & Müller, E. 2007, A&A, 463, 51
- [18] Blanton, M. R. & Roweis, S. 2007, AJ, 133, 734
- [19] Bloom, J. S., Kulkarni, S. R., & Djorgovski, S. G. 2002, AJ, 123, 1111
- [20] Bruzual, G. & Charlot, S. 2003, MNRAS, 344, 1000
- [21] Burrows, D. N., Grupe, D., Capalbi, M., et al. 2006, ApJ, 653, 468
- [22] Burrows, D. N., Hill, J. E., Nousek, J. A., et al. 2005, Space Sci. Rev., 120, 165
- [23] Cannizzo, J. K., Troja, E., & Gehrels, N. 2011, ApJ, 734, 35
- [24] Cenko, S. B., Frail, D. A., Harrison, F. A., et al. 2010, ApJ, 711, 641
- [25] Cepa, J., Bland-Hawthorn, J., González, J. J., & OSIRIS Consortium. 2000, in Astronomical Society of the Pacific Conference Series, Vol. 195, Imaging the Universe in Three Dimensions, ed. W. van Breugel & J. Bland-Hawthorn, 597
- [26] Chabrier, G. 2003, PASP, 115, 763
- [27] Cordes, J. M. & Lazio, T. J. W. 2002, ArXiv Astrophysics e-prints
- [28] Corsi, A., Guetta, D., & Piro, L. 2010, ApJ, 720, 1008
- [29] Coward, D. M., Howell, E. J., Piran, T., et al. 2012, MNRAS, 425, 2668
- [30] Cummings, J. R., Burrows, D. N., Evans, P. A., et al. 2014, GRB Coordinates Network, 16763
- [31] D’Avanzo, P., Malesani, D., Covino, S., et al. 2009, A&A, 498, 711
- [32] D’Avanzo, P., Salvaterra, R., Bernardini, M. G., et al. 2014, MNRAS, 442, 2342
- [33] De Pasquale, M., Schady, P., Kuin, N. P. M., et al. 2010, ApJ, 709, L146
- [34] Duffell, P. C., Quataert, E., & MacFadyen, A. I. 2015, ApJ, 813, 64
- [35] Fan, Y.-Z. & Wei, D.-M. 2011, ApJ, 739, 47
- [36] Fan, Y.-Z. & Xu, D. 2006, MNRAS, 372, L19
- [37] Ferrero, P., Kann, D. A., Zeh, A., et al. 2006, A&A, 457, 857
- [38] Fong, W., Berger, E., Margutti, R., & Zauderer, B. A. 2015, ApJ, 815, 102
- [39] Fong, W., Berger, E., Margutti, R., et al. 2012, ApJ, 756, 189
- [40] Foucart, F., Deaton, M. B., Duez, M. D., et al. 2014, Phys. Rev. D, 90, 024026
- [41] Galama, T. J., Vreeswijk, P. M., van Paradijs, J., et al. 1998, Nature, 395, 670
- [42] Gao, H., Ding, X., Wu, X.-F., Dai, Z.-G., & Zhang, B. 2015, ApJ, 807, 163
- [43] Gehrels, N., Norris, J. P., Barthelmy, S. D., et al. 2006, Nature, 444, 1044
- [44] Gehrels, N., Sarazin, C. L., O’Brien, P. T., et al. 2005, Nature, 437, 851
- [45] Giacomazzo, B. & Perna, R. 2013, ApJ, 771, L26
- [46] Giacomazzo, B., Perna, R., Rezzolla, L., Troja, E., & Lazzati, D. 2013, ApJ, 762, L18
- [47] Hook, I. M., Jørgensen, I., Allington-Smith, J. R., et al. 2004, PASP, 116, 425
- [48] Ilbert, O., Arnouts, S., McCracken, H. J., et al. 2006, A&A, 457, 841
- [49] Janka, H.-T., Aloy, M.-A., Mazzali, P. A., & Pian, E. 2006, ApJ, 645, 1305
- [50] Jin, Z.-P., Hotokezaka, K., Li, X., et al. 2016, ArXiv e-prints
- [51] Jin, Z.-P., Li, X., Cano, Z., et al. 2015, ApJ, 811, L22
- [52] Kalberla, P. M. W., Burton, W. B., Hartmann, D., et al. 2005, A&A, 440, 775
- [53] Kann, D. A., Klose, S., Zhang, B., et al. 2011, ApJ, 734, 96
- [54] Kasen, D., Fernández, R., & Metzger, B. D. 2015, MNRAS, 450, 1777
- [55] Kennicutt, Jr., R. C. 1998, ARA&A, 36, 189
- [56] Kouveliotou, C., Meegan, C. A., Fishman, G. J., et al. 1993, ApJ, 413, L101
- [57] Kraft, R. P., Burrows, D. N., & Nousek, J. A. 1991, ApJ, 374, 344
- [58] Levesque, E. M., Bloom, J. S., Butler, N. R., et al. 2010, MNRAS, 401, 963
- [59] Li, L.-X. & Paczyński, B. 1998, ApJ, 507, L59
- [60] Lippuner, J. & Roberts, L. F. 2015, ApJ, 815, 82
- [61] Lyons, N., O’Brien, P. T., Zhang, B., et al. 2010, MNRAS, 402, 705
- [62] Mészáros, P. & Rees, M. J. 1997, ApJ, 476, 232
- [63] Metzger, B. D., Martínez-Pinedo, G., Darbha, S., et al. 2010, MNRAS, 408, 2650
- [64] Nagakura, H., Hotokezaka, K., Sekiguchi, Y., Shibata, M., & Ioka, K. 2014, ApJ, 784, L28
- [65] Nagao, T., Maiolino, R., & Marconi, A. 2006, A&A, 459, 85
- [66] Nicuesa Guelbenzu, A., Klose, S., Krühler, T., et al. 2012, A&A, 538, L7
- [67] Norris, J. P. & Bonnell, J. T. 2006, ApJ, 643, 266
- [68] Perley, D. A., Modjaz, M., Morgan, A. N., et al. 2012, ApJ, 758, 122
- [69] Perna, R., Lazzati, D., & Giacomazzo, B. 2016, ArXiv e-prints
- [70] Planck Collaboration, Ade, P. A. R., Aghanim, N., et al. 2015, ArXiv e-prints
- [71] Rezzolla, L., Giacomazzo, B., Baiotti, L., et al. 2011, ApJ, 732, L6
- [72] Rhoads, J. E. 1999, ApJ, 525, 737
- [73] Rowlinson, A., O’Brien, P. T., Metzger, B. D., Tanvir, N. R., & Levan, A. J. 2013, MNRAS, 430, 1061
- [74] Ruffert, M. & Janka, H.-T. 1999, A&A, 344, 573
- [75] Sakamoto, T., Sato, G., Barbier, L., et al. 2009, ApJ, 693, 922
- [76] Sari, R., Piran, T., & Halpern, J. P. 1999, ApJ, 519, L17
- [77] Savaglio, S., Glazebrook, K., & Le Borgne, D. 2009, ApJ, 691, 182
- [78] Schlegel, D. J., Finkbeiner, D. P., & Davis, M. 1998, ApJ, 500, 525
- [79] Serino, M., Sakamoto, T., Kawai, N., et al. 2014, GRB Coordinates Network, 16778
- [80] Setiawan, S., Ruffert, M., & Janka, H.-T. 2004, MNRAS, 352, 753
- [81] Shapiro, S. L. & Teukolsky, S. A. 1983, Black holes, white dwarfs, and neutron stars: The physics of compact objects
- [82] Skrutskie, M. F., Cutri, R. M., Stiening, R., et al. 2006, AJ, 131, 1163
- [83] Stratta, G., D’Avanzo, P., Piranomonte, S., et al. 2007, A&A, 474, 827
- [84] Tanvir, N. R., Levan, A. J., Fruchter, A. S., et al. 2013, Nature, 500, 547
- [85] Thöne, C. C., Campana, S., Lazzati, D., et al. 2011, MNRAS, 414, 479
- [86] Thorne, K. S. 1987, Gravitational radiation. (Hawking, S. W. and Israel, W.), 330–458
- [87] Tody, D. 1993, in Astronomical Society of the Pacific Conference Series, Vol. 52, Astronomical Data Analysis Software and Systems II, ed. R. J. Hanisch, R. J. V. Brissenden, & J. Barnes, 173
- [88] Troja, E., Cusumano, G., O’Brien, P. T., et al. 2007, ApJ, 665, 599
- [89] Troja, E., King, A. R., O’Brien, P. T., Lyons, N., & Cusumano, G. 2008, MNRAS, 385, L10
- [90] Troja, E., Read, A. M., Tiengo, A., & Salvaterra, R. 2016, ApJ, 822, L8
- [91] Ukwatta, T. N., Dhuga, K. S., Stamatikos, M., et al. 2012, MNRAS, 419, 614
- [92] van Eerten, H. 2014, MNRAS, 442, 3495
- [93] van Eerten, H. & MacFadyen, A. 2013, ApJ, 767, 141
- [94] van Eerten, H., Zhang, W., & MacFadyen, A. 2010, ApJ, 722, 235
- [95] Virgili, F. J., Zhang, B., O’Brien, P., & Troja, E. 2011, ApJ, 727, 109
- [96] Willingale, R., Starling, R. L. C., Beardmore, A. P., Tanvir, N. R., & O’Brien, P. T. 2013, MNRAS, 431, 394
- [97] Willmer, C. N. A., Faber, S. M., Koo, D. C., et al. 2006, ApJ, 647, 853
- [98] Yang, B., Jin, Z.-P., Li, X., et al. 2015, Nature Communications, 6, 7323
- [99] Yasuda, N., Fukugita, M., Narayanan, V. K., et al. 2001, AJ, 122, 1104
- [100] Yu, Y.-W., Zhang, B., & Gao, H. 2013, ApJ, 776, L40
- [101] Zhang, B., Fan, Y. Z., Dyks, J., et al. 2006, ApJ, 642, 354
- [102] Zhang, B. & Mészáros, P. 2001, ApJ, 552, L35
- [103] Zhang, B. & Mészáros, P. 2004, International Journal of Modern Physics A, 19, 2385
- [104] Zhang, B.-B., van Eerten, H., Burrows, D. N., et al. 2015, ApJ, 806, 15