Compensation temperatures and exchange bias in La1.5Ca0.5CoIrO6
Abstract
We report on the study of magnetic properties of the La1.5Ca0.5CoIrO6 double perovskite. Via ac magnetic susceptibility we have observed evidence of weak ferromagnetism and reentrant spin glass behavior on an antiferromagnetic matrix. Regarding the magnetic behavior as a function of temperature, we have found that the material displays up to three inversions of its magnetization, depending on the appropriate choice of the applied magnetic field. At low temperature the material exhibit exchange bias effect when it is cooled in the presence of a magnetic field. Also, our results indicate that this effect may be observed even when the system is cooled at zero field. Supported by other measurements and also by electronic structure calculations, we discuss the magnetic reversals and spontaneous exchange bias effect in terms of magnetic phase separation and magnetic frustration of Ir4+ ions located between the antiferromagnetically coupled Co ions.
pacs
75.50.Lk, 75.30.Gw, 75.60.Jk, 75.47.LxI Introduction
Magnetic frustration emerges from competing magnetic interactions and degenerate multivalley ground states [1]. An example of such systems are the spin glasses (SG), in which the interactions between magnetic moments are in conflict with each other due to the presence of frozen-in structural disorder. The intriguing physical phenomena underlying the SG behavior have led to great interest in these materials since the 1970’s. The development of theories to model the SG found its applicability in a wide variety of research fields, from real glasses to neural networks and protein folding [2, 3]. Despite the great scientific interest and intense research over the last decades, the underlying physics that govern the SG phenomena is far from being well understood.
The canonical example of a SG type material is an intermetallic alloy in which a few percent of magnetic ions are dispersed arbitrarily in a non-magnetic matrix. These magnetic atoms are therefore separated by incidental distances, and thus the RKKY (Ruderman-Kittel-Kasuya-Yosida) interaction allows the coupling energy to have random sign. This class of systems corresponds to the historical discovery of SG, which traces back to the studies of strongly diluted magnetic alloys and the Kondo effect [3].
Later on, SG have been identified within other systems, such as insulating intermetallics, layered thin films and magnetic oxides. For the later class of materials, is important to mention the geometric frustrated pyrochlores[4, 5] and the extensively studied Co/Mn-based perovskites [6, 7, 8]. For these A(Co,Mn)O3 materials, the SG-like behavior is usually ascribed to the phase segregation and inhomogeneity of the compounds, and the dynamical process of magnetic relaxation being related to the growth and interactions of magnetic clusters [2, 9]. Many of these cobaltites and manganites exhibit the interesting exchange-bias (EB) effect, for which there is a shift of the magnetization as a function of the applied magnetic field [] curve in respect to its center. This phenomena is usually attributed to the induced exchange anisotropy at the interface between antiferromagnetic (AFM) and ferromagnetic (FM)/ferrimagnetic (FIM) phases in heterogeneous systems [10], and it has also been observed at FM/FIM/AFM-SG interfaces [11, 12]. It is commonly observed in multilayered systems, although also found in bulk materials with competing magnetic interactions with undefined magnetic interfaces between regions with AFM or FIM interactions [10].
We recently reported the structural and magnetic characterization of the La2-xCaxCoIrO6 double perovskite series [13]. For La2CoIrO6 the transition-metal ions valences are reported to be Co2+ and Ir4+ [14]. Our results show that La3+ to Ca2+ substitution leads to Co valence changes, and La1.5Ca0.5CoIrO6 presents both Co2+ and Co3+ in high spin configuration. Moreover, it presents the two key ingredients to achieve a SG state, which are different competing magnetic interactions and disorder [2, 3, 13].
In the course of studying the magnetic properties of La1.5Ca0.5CoIrO6, we have observed a reentrant spin glass (RSG)-like state, i.e., there is a conventional magnetic ordering and, at lower temperature (), the system achieves the SG state concomitantly to other magnetic phases. This behavior is ascribed to the Ir magnetic frustration due to Co AFM coupling and to the magnetic phase separation induced by the anti-site disorder (ASD) at the transition-metal sites.
This RSG state is intrinsically related to the EB effect observed for La1.5Ca0.5CoIrO6. Another important feature observed is that, for an appropriate choice of the applied dc magnetic field () the compound can reverse its magnetization up to three times in the -dependent magnetization measurements.
In this work we report the investigation of the magnetic behavior of La1.5Ca0.5CoIrO6. Using ac magnetic susceptibility measurements we have observed that the system exhibit conventional magnetic orderings at K and a spin glass transition at K, confirming its RSG state at low-. The dc magnetization measurements revealed that the high- anomaly is in fact associated with two conventional magnetic transitions, the AFM and FM phases of Co ions. The compensation temperatures in the -dependent magnetization measurements and the spontaneous EB effect in the isothermal magnetization measurements were investigated in detail. Studies of x-ray absorption near edge structure (XANES), x-ray magnetic circular dichroism (XMCD), x-ray photoelectron spectroscopy (XPS) and band structure calculations were also carried out. These data corroborates our argument that the magnetization reversals and zero field cooled (ZFC) exchange bias effect observed for La1.5Ca0.5CoIrO6 can be both understood in terms of the same underlying mechanism, i.e., are due to the competing interactions of Co ions that leads to magnetic phase segregation and frustration of the Ir magnetic moments.
II Experimental details
Polycrystalline samples of La1.5Ca0.5CoIrO6 were prepared by the solid state reaction in a conventional tubular furnace and air atmosphere. Stoichiometric amounts of La2O3, CaO, Co3O4 and metallic Ir were mixed and heated at C for 24 hours. Later the samples were re-grinded before a second step of 48 hours at C. Finally the materials were grinded, pressed into pellets and heated at C for two weeks. X-ray powder diffraction pattern revealed a single phase double perovskite structure with monoclinic symmetry, with 9% of ASD at Co/Ir sites [13]. Magnetic data were collected on a commercial Physical Property Measurement System. AC magnetic susceptibility was measured with driving field Oe, at the frequency range of 10-10000 Hz. DC magnetization was measured at ZFC and field cooled (FC) modes. XPS experiments were performed using an ultra-high vacuum (UHV) chamber equipped with a SPECS analyzer PHOIBOS 150. XMCD and XANES measurements were performed in the dispersive x-ray absorption (DXAS) beam line at the Brazilian Synchrotron Light Laboratory (LNLS) [15]. The edge step normalization of the data was performed after a linear pre-edge subtraction and the regression of a quadratic polynomial beyond the edge, using the software ATHENA [16]. The band structure calculations were performed using the WIEN2k software package [17].
III Results and discussion
III.1 X-ray Photoelectron Spectroscopy (XPS)
Fig. 1 shows the XPS spectra for La1.5Ca0.5CoIrO6. All the results presented correspond to the use of monochromatic Al x-ray radiation ( eV) using spectrometer pass energy () of 15 eV. The spectrometer was previously calibrated using the Au 4 (84.0 eV) which results on a full-width-half-maximum of 0.7 eV, for a sputtered metallic gold foil. The samples were referenced by setting the adventitious carbon C 1 peak to 284.6 eV. Prior to mounting in UHV, samples were slightly polished and ultra-sonicated sequentially in isopropyl alcohol and water. The photo-emission spectra were sequentially acquired after successive cycles of gentle Ar+ sputtering ( mbar Ar,1 kV, 1 A/cm2, 10-15 seconds intervals) for hydrocarbons removal. All spectra shown correspond to 45 s Ar+ sputtering at the ideally found conditions to avoid surface species reduction.
In Fig. 1(a) all elements found are indicated. We observe that residual carbon persist on the samples surface since the in-situ sputtering has been employed at the optimal conditions to avoid chemical reduction. Particularly important is the careful analysis of the cobalt 2 region which serves as a tool to assign Co cations sites and electronic configuration in several compounds [18, 19, 20]. Noteworthy, although XPS is most related to the surface chemical composition based on the limited photoelectrons inelastic mean free path in solids, because of the large mean free path of the cobalt photoelectrons (for eV, about 1.5 nm) the spectra presented can certainly reveal additional information from buried layers. As reported extensively in the literature, the expected binding energies for Co3+ and Co2+ are 779.5 and 780.5 eV, respectively [21]. Importantly, depending on the cation symmetry one may observe satellite features related to charge-transfer mechanisms which appear significantly stronger for Co2+ in octahedral sites, in contrast to Co3+ in octahedral or Co2+ in tetrahedral sites. The differences has been discussed in the literature and arises from an enhanced screening of Co3+ due to a larger Co 3-O 2 hopping strength and a smaller charge-transfer energy compared to those in the Co2+ charge state [22]. In Fig. 1, the Co 2 XPS spectra show prominent peaks at 779.6 and 795.3 eV related to the Co 2 and 2, respectively, in addition to the satellite feature located at 785.3 eV. The intense satellite is a clear signature of Co2+ in octahedral sites, most probably at a high-spin Co2+ configuration as observed for the cobalt monoxide [23].

The detailed analysis of the Co 2 region is however far from trivial, and the main peaks are known to be composed by multiplet splitting as described by Gupta and Sen [24], and extensively discussed in several recently studies [25, 26]. Nevertheless, we have considered that the intensity of each spin-orbit component can be fitted using two curves related to the different Co cations and respective satellites since Co2+ and Co3+ are known to display well distinguish binding energies at about 780.1 and 779.6 eV [26]. The spectral analysis for La1.5Ca0.5CoIrO6 compound employing two fitting components results on the assignment of Co2+ and Co3+ species located at binding energies and full-width-half-maximum of 780.1 (3.03) and 779.3 (1.89) eV, respectively. In order to compare the results obtained, the same procedure has been employed for La2CoIrO6 and La1.2Ca0.8CoIrO6, as depicted in Fig. 1(b). The results indicate a Co2+/Co3+ ratio of 2.33 for La2CoIrO6, 2.44 for La1.5Ca0.5CoIrO6 and 3.03 for La1.2Ca0.8CoIrO6. The increase of Co2+/Co3+ ratio as a function of the Ca incorporation is expected and has served to test our fitting procedure. Certainly, the absolute amount can be hardly determined. However, the trend observed can fairly indicate the relative amount of Co3+ species in the compounds.
Furthermore, the photoemission spectra close to the valence band [Fig. 1(c)] is particularly helpful to distinguish the spin state of the Co cations since it display noticeable multiplet structure. The spectral features observed have been discussed by several authors in great detail for CoO, Co3O4 and more recently for LaCoO3[23, 27, 28]. The most important structure are those close to 1-8 eV range, indicated by line 1, which is expected for Co3+ in octahedral sites, and the one indicated by line 2, related to strong multiplet effects in the final state of Co3+ cations. Previous calculations and photoemission studies have shown that Co3+ in a purely, low-spin state is characterized by an intense peak close to 1 eV but broad features at energies ranging up to 8 eV [27]. In contrast, the La1.5Ca0.5CoIrO6 compound displays two features peaking at line 1 and line 2, which suggest a Co3+ high spin state.
The approximate 70/30 proportion of Co2+/Co3+ estimated from the XPS spectra is consistent to the effective magnetic moment, /f.u., obtained from the Oe curve at the paramagnetic state (see below). Applying the usual equation for systems with two or more different magnetic ions [29]
| (1) |
and using the standard magnetic moments of Ir4+ (1.73 ), HS Co2+ (5.2 ) and HS Co3+ (5.48 ), yields
| (2) |
III.2 ac and dc magnetization vs.
Fig. 2(a) presents the ZFC-FC magnetization curves for Oe, were two peaks can be clearly observed. The inset shows a magnified view of a stretch of the curve, where are evidenced two anomalies at and K, associated to the magnetic ordering of the AFM and FM phases of Co ions, respectively, as it will be addressed later. The lower- cusp at K is due to a SG-like behavior, indicating a RSG phenomena. Since each peak is associated to a distinct mechanism, if an appropriate is applied in the opposite direction of the material’s spontaneous magnetization (), the curve can be shifted down and display up to three reversals of its magnetic moment.

This scenario can be understood in terms of the AFM coupling of the Co ions that are located at their predicted site, resulting in the frustration of Ir4+ magnetic moment, and the development of a FM component caused by the ASD. Studies of XANES on Co - and Ir -,-edges indicate a Co mixed valence on La1.5Ca0.5CoIrO6 (See Supplemental Material [30]). Also, the XPS measurement discussed above suggests a proportion 70%/30% of high spin Co2+/Co3+. Ir maintains 4+ valence by La3+ to Ca2+ substitution. Reports of neutron powder diffraction studies on La2-xSrxCoIrO6 [14] and several closely related compounds (e.g. La2-xSrxCoRuO6 [38] and LaBaCoIrO6 [39]) revealed AFM coupling of Co ions on these double perovskites, as predicted by the Goodenough-Kanamori-Anderson (GKA) rules [40]. Moreover, our electronic structure calculation results (see Supplemental Material [30]) indicate the AFM ordering as the most stable structure for La1.5Ca0.5CoIrO6. Therefore, this spin orientation can be assumed for the majority of Co ions. Consequently, the Ir4+ located in between the AFM coupled Co2+ ions might be frustrated. However, the system exhibit 9% of ASD, which together with the 30% of Co3+ leads to other nearest neighbor interactions such as Co2+–O–Co3+, Co3+–O–Co3+ and Ir4+–O–Ir4+. The latter two couplings are AFM, as predicted by the GKA rules [41, 42, 40], but Co2+–O–Co3+ coupling is expected to be a short range FM interaction via double-exchange mechanism [27, 43, 44].
The resulting magnetic moment of La1.5Ca0.5CoIrO6 can be estimated by the following argument. The main phase consists of AFM coupled Co2+ and frustrated Ir ions. Hence there is no contribution from the main phase to the resulting magnetization, as well as the AFM Co3+–O–Co3+ and Ir4+–O–Ir4+ couplings. To calculate the magnetization per formula unit, it must be taken into account that from the 30% of the Co3+ present in the system, in 9% it will permute to Ir site, giving rise to the FM Co2+–O–Co3+ interaction, which is the only from the interactions discussed above that is expected to contribute to the net magnetization. Using the standard magnetic moments of HS Co2+ and Co3+, the FM contribution to the resulting magnetization can be estimated to be
| (3) |
This result is very close to the low- value of the FC magnetization observed on inset of Fig. 2(b), 0.12 /f.u., and to the remanent magnetization of curve at 2 K ( /f.u., see Fig. 6). It is also close to the total magnetic moment obtained from band structure calculation, /f.u. (see Supplemental Material [30]). Surely, the above calculation is only an estimate, since it is not possible to establish the exact individual contribution of Co2+ and Co3+ magnetic moments. Also, the Co2+/Co3+ proportion may vary a bit from that obtained from XPS, leading to the discrepancy between the observed and calculated values. The slightly larger experimental values may be also related to the contribution of the frozen SG ions, which were not taken into account in the calculation. The above approximation only takes into account the linear exchange of Ising moments. In a 3D system, other exchange pathways may play a role, resulting in a more complex picture, but also with competing FM and AFM interactions and perhaps even canted spins [40, 5]. Hence, also for a 3D magnetic model, one would expect Ir4+ frustration. Frustration, along with the magnetic segregation due to ASD, fit very well the material’s magnetic behavior.
The magnetic interactions discussed above can explain the curve of Fig. 2(a) as the following. After ZFC, at low-, there is only the related to the Co interactions, since the Ir moments are frustrated. The system’s is here always chosen as opposite (negative) to direction (positive). Thus, applying in the opposite direction of , and ascending to higher- there is the first compensation temperature at K, due to the SG-spins alignment to direction. By increasing there is the decrease of the SG correlation length, resulting in the second magnetization reversal at K. With the further enhancement of the thermal energy the Co-FM phase can achieve positive magnetization, and there is the third compensation temperature at K. Finally, there are the transitions of the Co2+-AFM and Co2+/Co3+-FM phases to the paramagnetic state.
This behavior is closely related to the dynamics of the spin clusters, which are strongly dependent on and measurement time. For different times of measurement the compensation temperatures can vary. For a larger , the system achieves positive magnetization values already at low-, and there is no magnetic reversal, as can be observed on Fig. 2(b) for the curve measured under Oe. On the other hand, for small the SG peak is not large enough to achieve the positive magnetization and the system undergoes only to one compensation temperature, . For Oe, one have K, as shown in Fig. 2(b). Another important result obtained from Fig. 2(b) is that the low peak maxima shifts to lower- as increases. For , 500 and 1000 Oe the peak maxima are located at 27.8, 25.4 and 23.9 K respectively. This is an expected feature of a SG-like material, as will be discussed next.

The ac magnetic susceptibility () was measured as a function of for seven frequencies in the range 10-104 Hz. Fig. 3(a) shows the real (’ac) and imaginary (”ac) parts of susceptibility for some selected frequencies. For ’ac it was observed for the low- peak () a systematic shift of to higher- with the increase of driving frequency, where shift from 27 K at 10 Hz to 27.84 K at 104 Hz. It was also observed a decrease of the peak amplitude with increasing frequency. Both results are characteristic of SG-like materials. On the other hand, for the K only a small amplitude decrease was observed at higher frequencies, but no measurable shift, which characterizes ordinary magnetic transitions.
The frequency-dependent data turn out to be well described by the conventional critical slowing down model of the dynamic scaling theory [3, 46, 47], which predicts a power law
| (4) |
where is the relaxation time corresponding to the measured frequency, 0 is the characteristic relaxation time of spin flip, is the SG transition temperature (as frequency tends to zero), is the dynamical critical exponent and is the critical exponent of the correlation length. The solid line in the inset of Fig. 3(a) represents the best fit to the power law divergence, that yields K, s and . These results are in the realm of conventional SG phases.
A criterion that is often used to compare the frequency dependence of in different SG systems is to compare the relative shift in per decade of frequency
| (5) |
For La1.5Ca0.5CoIrO6 we found , which is within the range usually found for conventional SG (). For superparamagnets the usual value is , while for cluster glasses (CG) it has intermediate values between canonical SG and superparamagnets [3, 46, 45, 48].
The SG cusps on Fig. 3(a) are broader than usually observed for canonical SG. Since La1.5Ca0.5CoIrO6 is a RSG material, this may be due to the internal molecular field resulting from Co moments. In order to verify the field effect on the magnetization it was measured with Oe. Inset of Fig. 3(a) shows that, for this , also shifts to higher- with increasing frequency. The dashed line is the fit to the power law, yielding K, , Hz. With Oe, the relative shift in (Eq. 5) increases to . All these results are compatible to those usually reported for CG materials. Hence, induces the increase of the correlation length of the spin clusters, i.e., there is a transition from SG to CG in the system.
Fig. 3(b) shows ’ac and ”ac measurements for fixed Hz and Oe, but different . As expected, the SG peak is smeared out and shifts to lower- with increasing [3]. The inset shows that reasonably follows the Almeida-Thouless relation [49] for Oe, and the curve’s slope changes for higher fields. Since La1.5Ca0.5CoIrO6 is a RSG compound, have its effect on the underlying Co ions, inducing the transition from conventional SG to CG. This result may bring important insights about the effect of strong on the frozen spins and also on the limit of validity of the relation for a RSG. seems to remove the criticality of the transition, yet it does not fully prevent the formation of the frozen state [3].
In contrast to ’ac, for ”ac there was a small non-monotonic variation of the peak position and amplitude. This is an unconventional behavior for a SG-like material, and it was not found a reasonable simple explanation for it. It was already reported for the ternary intermetallic CeRhSn3 a shift toward lower- with increasing frequency [45, 50]. But differently than for La1.5Ca0.5CoIrO6, the shift was on ’, while ” goes to higher- with increasing frequency. Here is important to stress that, despite the fact our measurements were carefully taken, the overall smaller and more noisy ”ac makes it more difficult to precisely determine the position, specially for lower frequencies.
The complex magnetic behavior of La1.5Ca0.5CoIrO6 can be summarized in a rich phase diagram, showing its conventional and SG-like states. Fig. 4 displays the field-temperature phase diagram for the compound, where can be observed its Néel temperature () at K, its critical temperature () at K, and its freezing temperature () at K. An important result observed is that, depending on , at low- the material can behave as a conventional spin glass or as a cluster glass.

III.3 Exchange bias
curves for ordinary FM and FIM materials usually exhibit hysteretic behavior with coercive field due to the blocking of the domain wall motion. In SG-like materials irreversibility can also be observed arising out of anisotropy [3, 51, 52]. Hence, in a RSG system a large anisotropic coercivity can be expected due to the combined action of FM, AFM and SG phases. The ZFC measurements were performed for several using a systematic protocol detailed on Supplemental Material [30], and two representative curves are displayed in Fig. 5(a), where one can see a small increase in the magnetization from 5 to 15 K. The increase of thermal energy results in an enhancement of the SG alignment to the field direction, yielding in a larger magnetization. However, due to thermal energy, these spins can flip to the field direction, leading to the observed decrease of coercivity. It is also important to note that the system exhibit a non-negligible at zero field [inset of Fig. 5(a)]. This shows a systematic evolution with , and plays an important role on the process of pinning the spins, as it will be discussed next.

Here we define the EB field as , where and represent the right and left field values of the loop at the axis, respectively. The effective coercive field is . Usually, the EB effect is achieved when the system is cooled in the presence of non-zero . Interestingly, for La1.5Ca0.5CoIrO6 a non-negligible shift of the hysteresis loop is observed even when the system is cooled in zero field. This spontaneous EB effect, also called zero field cooled EB (ZEB), was recently reported for distinct systems such as Mn2PtGa [53] and Ni-Mn-In [54] alloys, and the nanocomposite BiFeO3-Bi2Fe4O4 [55]. But here we have found, to the best of our knowledge, the first example of a material to have this phenomenon clearly related to three distinct magnetic phases, namely FM, AFM and SG. At 2 K La1.5Ca0.5CoIrO6 exhibit a negative shift Oe. In order to verify this effect we have measured with the initial in the opposite direction. As can be observed on Fig. 5(b), the curve exhibits a positive shift Oe. The shift in the opposite direction is an expected behavior of a EB system, hence a clear evidence that this result is intrinsic of the material. The fact that is different depending on the direction of the initial magnetization process is an indicative that the internal plays an important role in the pinning of the spins.
La1.5Ca0.5CoIrO6 presents FM and SG phases incorporated to an AFM matrix. Due to its predominant AFM phase, it does not saturate even at a large field of 9 T. As will be discussed next, the ZEB effect here observed results from the a delicate exchange interaction on the interfaces of the AFM/SG phases to the minor FM phase. Hence, for large enough applied fields the pinned spins at the interface may flip to the field direction, reducing the effect. This is actually what is observed for fields larger than 4 T. For instance, for a maximum applied field () of 9 T the EB effect is reduced to =40 Oe. In order to evidence the FM contribution to the curves, the AFM contribution was subtracted from the loops. The linear curve representing the AFM phase was obtained from the fit of the loops at high fields, which was extrapolated to the whole field range and then subtracted from the loop. The resulting curve obtained for K is displayed in Fig. 5(c). It is almost symmetric in respect to the axis and displays the same as that obtained from the original curve. It must be mentioned that the resulting curves contemplate both the contributions of the FM and SG phases, i.e., it is not possible to separate these phases on the curves.
Despite the ZEB being an effect only recently reported, the conventional exchange-bias (CEB) is a well known phenomenon encountered in systems containing interfaces between distinct magnetic phases, being most likely found in FM-AFM systems. But a shift of the magnetization hysteresis loops along the field axis can be also observed in situations not related to EB effect. In a conventional FM material, if a minor loop is measured, i.e., an with the maximum applied field not large enough to the system achieve the magnetic saturation, it can exhibit a shift along the field axis similar to that observed in EB systems. This is in general related to the incomplete magnetic reversion of the system [56, 57]. However, differently than observed in EB materials, these minor loops also exhibit a large shift along the magnetization axis, and in general the loops are not closed at large fields [58, 59]. As Fig. 5 shows, of La1.5Ca0.5CoIrO6 is a closed loop with a very small shift along the vertical axis due to the pinned spins, as expected. It is a indicative that ZEB reported here is not due to a minor loop hysteresis. In order to reinforce the difference between the curves here observed from those obtained from minor loops, we compare in the Supplemental Material the results here described with that obtained from true minor loops [30].
The evolution of and with are displayed on Fig. 6(a). One can observe that the ZEB effect can only be achieved below . Moreover, it rapidly decreases with the enhancement of the thermal energy. Usually, a decrease in the magnetic unidirectional anisotropy (UA) is associated with an increase of the coercivity [10]. Hence, the low- anomaly observed for on inset of Fig. 6(a) is another expected feature of EB systems.

Different mechanisms are invoked to explain the ZEB for distinct materials. For instance, for Ni-Mn-In it is proposed that the UA is formed at the interface between different magnetic phases during the initial magnetization process of curves [54]. On the other hand, for BiFeO3-Bi2Fe4O4 it is proposed that glassy moment at the interface between FM-AFM phases causes the EB effect [55]. Despite the distinct mechanisms claimed to be the responsible for the ZEB effect on each compound, they all have in common the RSG behavior. Here we conjecture that the internal molecular field plays an important role on the ZEB effect. We propose the following mechanism to explain the ZEB effect on La1.5Ca0.5CoIrO6. The internal field due to the FM phase have its impact on AFM and SG phases. It affects the correlation length of the SG clusters, favoring the freezing of the glassy spins in the same direction, resulting in a spontaneous UA. The ZEB is enhanced by during the initial magnetization process of the loop. The field induces the increase of the internal interaction of FM domains, leading to the growth of the spin clusters. After the removal of , the spins at the grain interfaces are pinned, resulting in a stable magnetic phase with UA at low-. As increases the pinned spins can easier flip to the field direction due to the enhanced thermal energy. This leads to the reduction of and the correlated increase of observed on Fig. 6(a).
The same scenario can explain the system’s remanent magnetization, , where and are the positive and negative values of the magnetization at zero field. Fig. 6(b) displays the evolution with . On going from low to high-, first there is an increase of due to the thermally activated movement of the spins to the field direction. Then going to higher- there is the continuous decrease of until it vanishes at the paramagnetic sate. It is important to observe that despite the fact the FM phase orders at K, the ZEB effect only occurs below . This, together with the fact that at low- and initially increase while decreases on increasing , are other evidences that the ZEB observed is strongly related to the RSG state and is not due to some minor hysteresis loop of the FM phase.

As addressed above, a significant evidence that the observed ZEB effect on La1.5Ca0.5CoIrO6 is not due to some experimental artifact is the fact that the loops shift to opposite directions depending on the initial applied field be positive or negative. If there were remanent current on the magnet due to an trapped flux or any other reason, both shifts should be expected to be in the same direction. This inversion of depending on the initial field value is also observed when the CEB effect is measured, i.e., when the isothermal curve is measured after the system being field cooled. Fig. 7(a) displays the loop with T, after the sample being cooled in the presence of T. The AFM contribution is also displayed, and the inset shows the deconvoluted curve, i.e., the resulting curve when the AFM one is subtracted. On Fig. 7(b) is shown a magnified view of the 2 K loops after the sample being cooled with T. Differently than for the ZEB curves, for CEB the two curves are nearly symmetrically displaced with respect to the magnetization axis. Here the T cooling field is strong enough to flip the spontaneous magnetization, and the effect of the internal field becomes negligible.
Fig. 7(c) shows the temperature dependence of and . The CEB evolution is similar to ZEB. Above the becomes negligible. It shows the importance of the SG phase to the EB observed on La1.5Ca0.5CoIrO6. It can be also observed that the EB effect is greatly enhanced when the system is field cooled. At 2 K one have Oe. On the FC procedure, the pinning of the SG spins is favored already from above down to low-, and these spins get freezed on the field direction.

In EB systems, repeating the loop may lead to relaxation of uncompensated spin configuration at the interface. Consequently, depends on the number of consecutive hysteresis loops measured. This property is called training effect. For La1.5Ca0.5CoIrO6 this behavior was investigated in both ZEB and CEB cases. For CEB, 7 consecutive loops were measured at 2 K, after cooling the sample in the presence of T. Fig. 8 shows a detailed view of the 7 loops close to the axis. The arrow indicates a systematic evolution of the curves. The dependence of on the number of repeating cycles () is shown on inset. As can be observed, decreases monotonically with the increase in , indicating spin rearrangement at the interface. The dependence of can be fit to a model considering the contribution of both the frozen spins and the uncompensated rotatable spins at the interface [55, 60]
| (6) |
where and denote the frozen and rotatable spin components respectively. Eq. 6 fits the data very well, for Oe, Oe, , Oe, . The fact indicates the importance of the SG phase to the EB effect, and suggests that the rotatable spins rearrange faster than the frozen ones. For the ZEB mode, it was observed only a very small decrease of from first to second loop, thereafter the system exhibits only negligible variation. This indicates that after the first cycle, the frozen and uncompensated spins became quite stable at the interfaces.
IV Conclusions and Outlook
In conclusion, we have shown that La1.5Ca0.5CoIrO6 is a RSG-like material, in which there are two magnetic orderings of the AFM and FM phases of Co ions at K and K, respectively, and a SG-like transition at K. The frequency dependence of obtained from ’ac follows the power law of the dynamical scaling theory. Regarding the ac measurements with applied fields, the system transits from conventional spin glass to cluster glass with increasing . The coexistence of conventional and glassy magnetic states leads to an exotic magnetic behavior in the ZFC -dependence of magnetization curve, in which the system can undergo three magnetic reversals. Magnetization as a function of suggest a ZEB effect at low-, related to the FM-AFM-SG interfaces. When the sample is cooled in the presence of an applied magnetic field, the EB effect is enhanced. XPS, XANES, XMCD and electronic structure calculations results corroborate our argument that the magnetization reversals and the EB effect can be both understood in terms of the same underlying mechanism, i.e., are consequences of the Ir magnetic frustration caused by the competing interactions with its neighboring Co ions. To verify these and other conjectures discussed in the text, other techniques such as neutron scattering, torque magnetometry and electronic spin resonance are necessary.
Acknowledgements.
This work was supported by CNPq, FAPERJ, FAPESP and CAPES (Brazil). We thank E. Granado for the helpful discussions. F. Stavale thanks the Surface and Nanostructures Multiuser Lab at CBPF and the MPG partnergroup programm. LNLS is acknowledged for concession of beam time.References
- [1] J. Knolle, G.-W. Chern, D. L. Kovrizhin, R. Moessner, and N. B. Perkins, Phys. Rev. Lett. 113, 187201 (2014).
- [2] K. Binder and A. P. Young, Rev. Mod. Phys. 58, 801 (1986).
- [3] J. A. Mydosh, Spin Glasses: An Experimental Introduction (Taylor & Francis, London, 1993).
- [4] D. K. Singh and Y. S. Lee, Phys. Rev. Lett. 109, 247201 (2012).
- [5] J. E. Greedan, J. Mater. Chem. 11, 37 (2001).
- [6] J. M. De Teresa et al., Phys. Rev. Lett. 76, 18 (1996).
- [7] A. K. Kundu, P. Nordblad, and C. N. R. Rao, Phys. Rev. B 72, 144423 (2005).
- [8] Q. Xu et al., Nature Sci. Rep 5, 9093 (2015).
- [9] D. Niebieskikwiat and M. B. Salamon, Phys. Rev. B 72, 174422 (2005).
- [10] J. Nogués and I. K. Schuller, J. Magn. Magn. Mater. 192, 203 (1999).
- [11] M. Ali, P. Adie, C. H. Marrows, D. Greig, B. Hickey, and R. L. Stamps, Nature Mater. 6, 70 (2007).
- [12] M. Gruyters, Phys. Rev. Lett. 95, 077204 (2005).
- [13] L. T. Coutrim et al., J. Solid State Chem. 221, 373 (2015).
- [14] A. Kolchinskaya et al., Phys. Rev. B 85, 224422 (2012).
- [15] J. C. Cezar et al., J. Synchrotron Radiat. 17, 93 (2010).
- [16] B. Ravel and M. Newville, J. Synchrotron Radiat. 12, 537 (2005).
- [17] P. Blaha, K. Schwarz, G. K. H. Madsen, D. Kvasnicka, and J. Luitz, WIEN2k, An Augmented Plane Wave + Local Orbitals Program for Calculating Crystal Properties (Karlheinz Schwarz, Techn. Universitat Wien, Austria), 2001.
- [18] S. C. Petitto, E. M. Marsh, G. A. Carson, and M. A. Langell, J. Mol. Catal. A: Chem. 281, 49 (2008).
- [19] J. van Elp et al., Phys. Rev. B 44, 6090 (1991).
- [20] V. M. Jimenez, A. Fernandez, J. P. Espinos, and A. R. Gonzalez-Elipe, J. Electron. Spectrosc. Relat. Phenom. 71, 61 (1995).
- [21] M. Hassel and H.-J. Freund, Surf. Sci. Spectra 4, 273 (1996).
- [22] C. A. F. Vaz, D. Prabhakaran, E. I. Altman, and V. E. Henrich, Phys. Rev. B 80, 155457 (2009).
- [23] C. R. Brundle, T. J. Chuang, and D. W. Rice, Surface Sci. 60, 286 (1976).
- [24] R. P. Gupta and S. K. Sen, Phys. Rev. B 12, 1 (1975).
- [25] T. Ivanova, A. Naumkin, A. Sidorov, I. Eremenko and M. Kiskin, J. Electron. Spectrosc. Relat. Phenom. 156-158, 200 (2007).
- [26] M. C. Biesinger et al., Appl. Surface Sci. 257, 2717 (2011).
- [27] B. Raveau and Md. Motin Seikh, Cobalt Oxides: From Crystal Chemistry to Physics (Wiley-VCH, Weinheim, 2012).
- [28] T. C. Koethe, Ph.D. thesis, Universität zu Köln, 2007.
- [29] D. Niebieskikwiat et al., Phys. Rev. B 62, 5 (2000).
- [30] See Supplemental Material below for details of the magnetometry results, x-ray near edge structure (XANES), x-ray magnetic circular dichroism (XMCD) and electronic structure calculations, which includes Refs. [31-37].
- [31] T. Dey et al., Phys. Rev. B 93, 014434 (2016).
- [32] J. Stöhr and H. König, Phys. Rev. Lett. 75, 3748 (1995).
- [33] B. T. Thole, P. Carra, F. Sette, and G. van der Laan, Phys. Rev. Lett. 68, 1943 (1992).
- [34] P. Carra, B. T. Thole, M. Altarelli, and X. Wang, Phys. Rev. Lett. 70, 694 (1993).
- [35] C. T. Chen et al., Phys. Rev. Lett. 75, 152 (1995).
- [36] J. P. Perdew et al., Phys. Rev. Lett. 100, 136406 (2008).
- [37] I. D. Seymour, A. Chroneos, J. A. Kilner, and R. W. Grimes, Phys. Chem. Chem. Phys. 13, 15305 (2011).
- [38] M. Dlouhá et al., J. Magn. Magn. Mater. 322, 1189 (2010).
- [39] P. D. Battle, J. G. Gore, R. C. Hollyman, and A. V. Powell, J. Alloys and Comp. 218, 110 (1995).
- [40] J. B. Goodenough, Magnetism and Chemical Bond (Interscience, New York, 1963).
- [41] Housung Seo, Agham Posadas and Alexander A. Demkov, Phys. Rev. B 86, 014430 (2012).
- [42] Sun-Woo Kim et al., Phys. Rev. Lett. 115, 096401 (2015).
- [43] Md. Motin Seikh et al., Chem. Mater. 20, 231 (2008).
- [44] H. Singh, H. Ghosh, T. V. Chandrasekhar Rao, A. K. Sinha, and P. Rajput, J. Appl. Phys. 116, 214106 (2014).
- [45] V. K. Anand, D. T. Adroja, and A. D. Hillier, Phys. Rev. B 85, 014418 (2012).
- [46] J. Souletie and J.L. Tholence, Phys. Rev. B 32, 516(R) (1985).
- [47] P. C. Hohenberg and B. I. Halperin, Rev. Mod. Phys. 49, 3 (1977).
- [48] A. Malinowski et al., Phys. Rev. B 84, 024409 (2011).
- [49] J. R. L. Almeida and D. J. Thouless, J. Phys. A 11, 983 (1978).
- [50] V. K. Anand, D. T. Adroja, A. D. Hillier, W. Kockelmann, A. Fraile, and A. M. Strydom, J. Phys.: Cond. Matter 23, 276001 (2011).
- [51] S. Mukherjee, R. Ranganathan, P. S. Anilkumar, and P. A. Joy, Phys. Rev. B 54, 9267 (1996).
- [52] K. De, M. Patra, S. Majumdar, and S. Giri, J. Phys.: Cond. Matter 40, 7614 (2007).
- [53] A. K. Nayak et al., Phys. Rev. Lett. 110, 127204 (2013).
- [54] B. M. Wang et al., Phys. Rev. Lett. 106, 077203 (2011).
- [55] T. Maity, S. Goswami, D. Bhattacharya, and S. Roy, Phys. Rev. Lett. 110, 107201 (2013).
- [56] J. J. Becker, IEEE Trans. Mag. MAG-12, 6 (1976).
- [57] O. Benda, J. Bydzoviský, P. Krivosík, and E. Usák, J. Magn. Magn. Mater. 215, 644 (2000).
- [58] L. Pi, S. Zhang, S. Tan, and Y. Zhanga, App. Phys. Lett. 88, 102502 (2006).
- [59] L. Klein, App. Phys. Lett. 89, 036101 (2006).
- [60] S. K. Mishra, F. Radu, H. A. Durr, and W. Eberhardt, Phys. Rev. Lett. 102, 177208 (2009).
Supplementary Material: “Compensation temperatures and exchange bias in La1.5Ca0.5CoIrO6”
X-ray near edge structure (XANES)
Room temperature x-ray near edge structure (XANES) measurements were performed in the dispersive x-ray absorption (DXAS) beam line at the Brazilian Synchrotron Light Laboratory (LNLS) [1]. The edge step normalization of the data was performed after a linear pre-edge subtraction and the regression of a quadratic polynomial beyond the edge, using the software ATHENA [2].
The normalized Co -edge XANES spectrum of La2CoIrO6 and La1.5Ca0.5CoIrO6 are given in Fig. 1. The references LaCoO3 and CoO XANES spectrum are also shown for comparison. Interestingly, our results indicate the presence of Co3+ already at the parent compound, which was also observed on the XPS. The small shift to higher energies obseved for La1.5Ca0.5CoIrO6 suggests an increase in the proportion of Co3+ due to Ca2+ substitution on La3+ site.

The normalized Ir -edge XANES spectrum of La2CoIrO6 and La1.5Ca0.5CoIrO6 are given in Fig. 2. Our XANES measurements indicate no appreciable change in the Ir valence by calcium doping. This is in agreement with the magnetometry results and to the XPS spectra at Ir 4 region (not shown). However, it can be observed a small variation on the wavelength intensity from La2CoIrO6 to La1.5Ca0.5CoIrO6. Although our results indicate a majority of Ir4+, the possible valence mixing in Ir sublattice can not be discarded. Especially if we assume the oxygen content to be nearly stoichiometric, it should be expected a few percentage of Ir5+ ions. Recent reports indicate long-range magnetic order in Ir5+-based double-perovskites [3], hence it could contribute to the magnetic behavior observed for La1.5Ca0.5CoIrO6.

X-ray magnetic circular dichroism (XMCD)
X-ray magnetic circular dichroism (XMCD) measurements at the Ir edges were performed in the DXAS beam line at LNLS [1], with a calculated degree of circular polarization of %. A rotative permanent magnet applied 0.9 T at the sample, both parallel and antiparallel to the x-ray beam direction.
In Figs. 3 and 4 we present the XANES and XMCD spectra of La2CoIrO6 at the Ir and edges, respectively, at 60 K. By applying the well known sum rules which relates the integrated XAS and XMCD signals to polycrystalline samples (neglecting the magnetic dipole contribution [4]) we could extract the spin and orbital moments [5].


For La2CoIrO6 we obtain for the Ir moments an orbital magnetic moment and a spin magnetic moment , thus resulting in a total magnetic moment per Ir and . These values are very close to the derived by Kolchinskaya et al. [6].
Fig. 5 shows the XANES and XMCD spectra of La1.5Ca0.5CoIrO6 at the Ir edge at 60 K. No XMCD signal was observed for edge, thus it was considered to be zero. Following the same procedure done for La2CoIrO6, we obtain for the Ir moments and , thus per Ir and . This very small value in respect to the expected moment for a confirms that the Ir4+ ions are frustrated due to the AFM coupling of its Co2+ neighbors.

Magnetometry
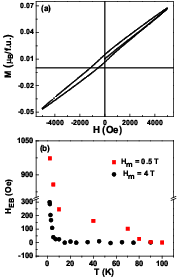
As discussed in the main text, a shift in the magnetization as a function of applied field can be observed in conventional FM/FIM materials if a minor loop is measured, i.e., an curve with the maximum applied field () not large enough to the system achieve the magnetic saturation. These minor loops are usually highly asymmetric along both the field and magnetization axis. In order to further evidence that the EB observed for La1.5Ca0.5CoIrO6 is not related to a minor loop effect, we measured minor loops with T at several temperatures. Fig. 6(a) shows the minor loop measured at 5 K. As can be observed, the curve is highly asymmetric, exhibiting a large shift along the axis. This is completely different from the curve for T, which shows no appreciable asymmetry along the magnetization axis. Fig 6(b) shows the -dependence of for both the loops with T and T, for comparison. For the 4 T loops the vanishes below while for the 0.5 T loops the shift persists above and only goes to zero on the paramagnetic state. If the observed for the T loops were due to a minor loop effect, it should be expected to persist up to K, in resemblance to the T curve. This remarkable difference between the curves indicate that the observed for the T loop is an exchange biased phenomena which is intrinsically related to the RSG state.
Here is important to discuss the concept of zero magnetic field for the experimental apparatus used. In order to minimize the remanent magnetization on the magnet, the sample was always taken to the paramagnetic state from one measurement to another, and the magnetic field was sent to zero on the oscillating mode. But this does not warrant a precise zero field. To further confirm the results here described we have also heated up to room- and shut down the magnet, in order to ensure that there was no trapped flux on the magnet, and then performed ZFC measurements. For the checking loops the sample exhibit the same EB effect, indicating that the unidirectional anisotropy and ZEB here described are intrinsic of the material and not due to some experimental artifact.
Electronic structure calculations
The band structure calculations were performed using the WIEN2k software package [7]. The FM and AFM cases were calculated with and without spin-orbit coupling on the Ir 5 levels. The spin-orbit effect on 3 levels is less important and was not included for the Co atoms. The exchange and correlation potential used was the PBEsol implementation of the GGA [8]. The wave function of the valence electrons was expanded using more than 193000 plane waves. The self consistent potential was obtained sampling 343 points in the Brillouin zone. The convergence criteria were set to 10-5 eV on the total energy and 10-3 on the electronic charges.

| E (eV) | () | () | (/f.u.) | |
|---|---|---|---|---|
| Paramagnetic | 0 | 0 | 0 | 0 |
| FM | -0.86 | 2.5 | 0.6 | 4.30 |
| FM+SOC | -6.46 | 2.4 | 0.3 | 3.48 |
| AFM | -0.93 | 2.4 | 0.6 | 0.07 |
| AFM+SOC | -6.48 | 2.4 | 0.3 | 0.06 |
Table 1 gives the energies and magnetic moments of the La1.5Ca0.5CoIrO6 compound in the PM, FM and AFM phases. The FM and AFM structures present lower total energies than the paramagnetic case. This shows that the magnetic interactions are very important in this material. Further, the FM and AFM energies decrease when spin-orbit coupling is included. Moreover, the magnetic moment of the Ir 5 electrons shrink to half by the spin-orbit interaction. The AFM ordering is the most stable structure, although the FM arrangement is relatively close in energy. This indicates that the magnetic interactions present a large degree of frustration, and helps to explain the observed spin glass behavior in this material. Considering the 70%/30% of Co2+/Co3+ and the 9% of ASD experimentally observed, and assuming the magnetic moments of the AFM and FM phases of Table 1, the system’s magnetization can be calculated as /f.u, which is very close to the low- experimental values, /f.u..
Figure 7 presents the total and partial densities of states for AFM La1.5Ca0.5CoIrO6. All contributions are split into the majority and minority spin states and the zero energy corresponds to the Fermi level. Only the contributions of the spin up transition-metal ion and their ligands are shown (the spin down contribution are just complementary and do not add much to the discussion). The La 4 states are extremely intense and were clipped to better visualize the other contributions. The Co 3 and Ir 5 states are split by the approximately crystal field into the and structures. The O 2 band appears strongly mixed with the metal states throughout the valence band, revealing a large covalent contribution to the bonding in this compound. This is especially true for the Ir 5 states which show an even larger mixing due to the larger spatial extent of 5 levels. The majority Co 3 and Ir 5 states present a minimum at the Fermi level, which resemble that observed in half-metallic magnetic materials. Finally, the La 4, La 5 and Ca 3 states appear at much higher energies, exhibiting a mostly ionic contribution to the electronic structure.
The anti-site formation was also calculated, with a supercell with 80 inequivalent atomic sites. This gives an anti-site concentration of about 12, in line with the estimated 9 concentration. The difference in total energy between the disordered and perfect lattice was about 1.1 eV. This is similar to the 0.94 eV result obtained for anti-site formation in the related LnBaCoO5.5 double-perovskite [9].
References
- [1] J. C. Cezar et al., J. Synchrotron Radiat. 17, 93 (2010).
- [2] B. Ravel and M. Newville, J. Synchrotron Radiat. 12, 537 (2005).
- [3] T. Dey et al., Phys. Rev. B 93, 014434 (2016).
- [4] J. Stöhr and H. König, Phys. Rev. Lett. 75, 3748 (1995).
- [5] B. T. Thole, P. Carra, F. Sette, and G. van der Laan, Phys. Rev. Lett. 68, 1943 (1992); P. Carra, B. T. Thole, M. Altarelli, and X. Wang, Phys. Rev. Lett. 70, 694 (1993); C. T. Chen et al., Phys. Rev. Lett. 75, 152 (1995).
- [6] A. Kolchinskaya, P. Komissinskiy, M. B. Yazdi, M. Vafaee, D. Mikhailova, N. Narayanan, H. Ehrenberg, F. Wilhelm, A. Rogalev, and L. Alff, Phys. Rev. B 85, 224422 (2012).
- [7] P. Blaha, K. Schwarz, G. K. H. Madsen, D. Kvasnicka, and J. Luitz, WIEN2k, An Augmented Plane Wave + Local Orbitals Program for Calculating Crystal Properties (Karlheinz Schwarz, Techn. Universitat Wien, Austria), 2001.
- [8] J. P. Perdew, A. Ruzsinszky, G. I. Csonka, O. A. Vydrov, G. E. Scuseria, L. A. Constantin, X. Zhou, and K Burke, Phys. Rev. Lett. 100, 136406 (2008).
- [9] I. D. Seymour, A. Chroneos, J. A. Kilner, and R. W. Grimes, Phys. Chem. Chem. Phys. 13, 15305 (2011).