Detection of emission lines from DLAs towards the QSO J2358+0149 Thanks: Based on observations carried out at the European Southern Observatory (ESO) under programme ID 293.A-5020(A) (P.I. Noterdaeme) using X-Shooter spectrograph located on Unit Telescope 3 (UT3, Melipal) of the Very Large Telescope (VLT) at the Paranal Observatory, Chile.
Abstract
Using VLT/X-shooter we searched for emission line galaxies associated to four damped Lyman- systems (DLAs) and one sub-DLA at 2.733.25 towards QSO J2358+0149. We detect [O iii] emission from a “low-cool” DLA at = 2.9791 (having log (H i) = , [Zn/H] = ) at an impact parameter of, kpc. The associated galaxy is compact with a dynamical mass of M⊙, very high excitation ([O iii]/[O ii] and [O iii]/[H] both greater than 10), 12+[O/H]8.5 and moderate star formation rate (SFR M⊙ yr-1). Such properties are typically seen in the low- extreme blue compact dwarf galaxies. The kinematics of the gas is inconsistent with that of an extended disk and the gas is part of either a large scale wind or cold accretion. We detect Ly emission from the = 3.2477 DLA (having log (H i)=21.120.10 and [Zn/H]=). The Ly emission is redshifted with respect to the metal absorption lines by 320 km s-1, consistent with the location of the red hump expected in radiative transport models. We derive SFR0.2-1.7 M⊙ yr-1 and Ly escape fraction of 10 per cent. No other emission line is detected from this system. Because the DLA has a small velocity separation from the quasar (500 km s-1) and the DLA emission is located within a small projected distance ( kpc), we also explore the possibility that the Ly emission is being induced by the QSO itself. QSO induced Ly fluorescence is possible if the DLA is within a physical separation of 340 kpc to the QSO. Detection of stellar continuum light and/or the oxygen emission lines would disfavor this possibility. We do not detect any emission line from the remaining three systems.
Keywords:
quasars: active – quasars: absorption lines – quasars: individual: SDSS J235854.4+014955.5 – ISM: lines and bands1 Introduction
Damped Ly systems (DLAs with ), seen in the spectra of bright background sources like QSOs, in principle trace galaxies based on their projected H igas cross-section and thereby providing a luminosity independent probe of high- galaxies (Wolfe et al., 2005, see). Thanks to large spectroscopic surveys, we now have a very good statistical sample of DLAs in the redshift range (Prochaska et al., 2005; Noterdaeme et al., 2009; Noterdaeme et al., 2012b). DLAs at these redshifts contain 80% of the neutral gas and the cosmic density of H i gas in DLAs (i.e. ) shows an increasing trend at , while within statistical uncertainties evolving very mildly at At the data does not show a clear trend either due to small number statistics or, especially when spectral resolution is low, from systematics due to blending with Ly forest (Péroux et al., 2003; Guimarães et al., 2009; Songaila & Cowie, 2010; Zafar et al., 2013; Crighton et al., 2015).
Based on novel broad-band color selection and narrow-band imaging techniques, galaxies are detected up to and the star formation rate density of galaxies is mapped up to (Madau & Dickinson, 2014, see). There is a strong increase in the UV luminosity density by 0.8 to 1 dex between and followed by a decrease towards higher for . High spatial resolution deep imaging studies show, galaxies at have sizes typically a factor 3 smaller compared to their local counterparts of similar luminosity (Trujillo et al., 2006, e.g.,).
The observed number density of DLAs requires that the total H i cross-section must be much larger than the optical extent of galaxies currently detected in emission, indicating wide spread of H i around these galaxies (either in extended discs or in flows) or that a significant contribution to the gas cross-section comes from the population of faint galaxies below the detection limit of large surveys. It is believed that the redshift evolution of the star formation rate density in the universe is driven by cold inflows (Kereš et al., 2005; Erb et al., 2006; Ocvirk et al., 2008; Dekel et al., 2009, see for example,) and probably controlled by the large scale outflows that are ubiquitously found among the high redshift Lyman Break Galaxies (Pettini & Bowen, 2001; Shapley et al., 2003; Veilleux et al., 2005, LBGs,). These processes may control the physical conditions, chemical composition and kinematics of the extended gas distribution around galaxies (the so called circumgalactic medium) that are probed by absorption line studies.
| PA | Observing date | DIMM seeing | Air mass | Exposure time(s) | ||
|---|---|---|---|---|---|---|
| (deg) | dd/mm/year | (arcsec) | UVB | VIS | NIR | |
| 0 | 02-07-2014 | 0.9 | 1.14 | 22900 | 22800 | 22880 |
| 04-08-2014 | 1.0 | 1.20 | 22900 | 22800 | 22880 | |
| 01-07-2014 | 0.8 | 1.20 | 12900 | 12800 | 12880 | |
+ Slit widths of 1.2, 0.8 and 1.3 arcsec were used for UBV, VIS and NIR spectrographs of the X-shooter, respectively.
Purely based on the high resolution spectroscopic studies of DLAs we know that: (i) at a given , the average metallicity of DLAs is typically less than those inferred for galaxies from their nebular emission, (ii) metallicity in DLAs shows clear redshift evolution but with a slope shallower than what one would have expected purely based on the galaxy evolution (Som et al., 2013; Rafelski et al., 2014) (iii) the volume filling factor of cold gas (inferred through tracers like H2 and 21-cm absorption) is lower than that seen in the local interstellar medium (Petitjean et al., 2000; Ledoux et al., 2003; Noterdaeme et al., 2008; Srianand et al., 2012; Kanekar et al., 2014, ISM,) and (iv) DLAs show clear correlation between the velocity width of the low-ion absorption and the metallicity akin to the mass-metallicity relation seen in galaxies (Ledoux et al., 2006). Møller et al. (2013) explained the slow metallicity evolution as a consequence of the lack of strong evolution in the zero-point of the mass-metallicity relation of high- DLA galaxies. Wolfe et al. (2008) based on the cooling rate derived using C ii∗ absorption suggested the existence of “low-cool” and “high-cool” population of DLAs. They argued that both populations need local sources to satisfy the heating requirements (Srianand et al., 2005, see however,). The rare detections of faint, extended objects in the Hubble Ultra Deep Field is incompatible with all heating coming from in situ star formation in “high-cool” DLAs and suggests that they may be originating from extended regions of LBGs (Wolfe & Chen, 2006). All this, while suggesting that the DLAs are somehow related to the star forming regions, also suggest that they need not always be related to the gas in the stellar disk of galaxies.
Therefore, identifying galaxies and correlating galaxy properties derived using continuum and nebular emission lines to the properties of the associated DLAs derived from the high resolution spectra of QSO is very important. There have been several attempts to detected galaxies associated to high- DLAs. However, searches aimed at directly detecting associated galaxies either in the continuum emission or in the nebular line emission have mostly resulted in non-detections (Bunker et al., 1999; Kulkarni et al., 2000; Lowenthal et al., 1995; Christensen et al., 2009; Fumagalli et al., 2015, as well as several unpublished works.) with very few cases being spectroscopically confirmed by the detection of Ly and/or other emission lines (Møller et al., 2002; Møller et al., 2004; Fynbo et al., 2010; Noterdaeme et al., 2012a; Fynbo et al., 2013; Krogager et al., 2013; Bouché et al., 2013; Hartoog et al., 2015). These systems are used to obtain different correlations between properties derived from absorption lines towards quasars and emission lines from the associated galaxies. Krogager et al. (2012) found a possible anti-correlation between (H i) and impact parameter (see their Fig. 3) similar to the one seen at low- based on H i emission maps (Zwaan et al., 2005, see Fig. 15 of). A possible correlation is also seen between the metallicity of the DLAs and the impact parameter. These correlations are shown to be consistent with a scenario where the metallicity-size relation is driven by starburst induced feed back processes. Christensen et al. (2014) measured stellar masses of these DLA host galaxies. These are found to be consistent with the expected values based on mass-metallicity relations. As these interesting correlations are based on a handful of known systems studied in detail, it is important to increase the number of galaxies associated with DLAs.
Information on average star formation in DLA galaxies can in principle be derived using Ly stacking methods (Rahmani et al., 2010; Noterdaeme et al., 2014). However, complexities involved in the radiative transport of Ly photons may hinder our interpretation in the absence of independent escape fraction measurements.
One possible way to enhance the efficiency of searching for DLA galaxies is to target QSO sightlines with multiple DLAs in the optical near-IR regions. By scanning the full sample of QSO spectra from the SDSS-III Baryonic Oscillation Spectroscopic Survey (BOSS) - Data Release 13 (Pâris et al., 2014) we have identified a QSO sightline having 5 systems with Ly showing damping wings along the line of sight. In this paper, we present analysis of these five intervening DLA systems at = 2.7377, 2.9791, 3.1095, 3.1333 and 3.2477 towards the SDSS J235854.4+014955.5 (hereafter refer to as J2358+0149). In particular, we report detection of [O iii] and Ly emission associated with DLAs at = 2.9791 and 3.2477 respectively. In Section 2, we provide details of the VLT/X-shooter observations, data reduction and systemic redshift measurements of the QSO. In Section 3 we present the analysis of the intervening absorption systems and a discussion on chemical abundances and dust depletions. We discuss, in Section 4 and 5, the emission properties of the DLA galaxies. The summary and conclusions are presented in Section 6. In this paper we use a standard CDM cosmology with , , and .
2 Data and details of X-shooter observations:
Spectra of J2358+0149 were obtained with X-shooter (Vernet et al., 2011) at the European Southern Observatory (ESO) Very Large Telescope (VLT) in service mode under Director’s Discretionary Time (PI: Noterdaeme). Our observations consist of 5 observation blocks (OBs) for a total science exposure time of 14500 s in the ultra-violet-blue (UVB), 14000 s in the visible (VIS) and 14400 s in the near-infrared (NIR) arm respectively. Each OB was performed using one nodding cycle (AB) with a nod throw of 4". NIR exposures were split into 480 s DITs (detector integration times). In order to be able to use the triangulation technique to get the galaxy impact parameter with respect to the QSO line of sight using emission line centroids, we have arranged the 5 OBs in the following way: two at position angles of 0∘ (North of East), two with PA=60∘ and one at position . Apart from the differences in the position angle, other settings used in all OBs were identical. The observations were performed under good seeing (0.8-1.0 arcsec) conditions. Detailed observational log is provided in Table 1.
We reduced the X-shooter spectra using the ESO pipeline (Goldoni et al., 2006, version 2.5.2;). We performed flat-fielding, order tracing, rectification and initial wavelength and flux calibration. For sky-subtraction, stacking of individual exposures, bad-pixel masking and cosmic ray rejection, we applied our own software and followed the procedure described in detail in Krühler et al. (2015). Very briefly, we combined the individual, sky-subtracted exposures taken in a single position angle with a weighted average, where the weight function was derived from the signal-to-noise ratio of the QSO spectrum. Bad pixel and cosmic rays were detected using a Laplacian edge detection filter and masked in the final stack. Error spectra, initially derived through the ESO pipeline, were propagated accordingly.
The X-shooter spectrum covers the wavelength range from 300 nm to 2.5 m at the intermediate spectral resolution (R6000 to 7000), thereby allowing an accurate measurement of the systemic redshift of the QSO and simultaneous search for the Ly emission in the blue and standard optical nebular lines like [O ii], [O iii] and H in the NIR from the DLAs.

In the optical UV spectrum of the QSO the Ly + N v emission lines are severely absorbed by the associated DLA absorption at = 3.2477. The [C iii], Si iv and C iv emission lines are also week, broad and asymmetric compared to that of the QSO composite spectrum. Based on C iv and Si iv emission lines we get the QSO redshift of = 3.235. We also do not detect strong [O iii] emission from the QSO though there is a weak feature coinciding with the H emission. The only prominent broad emission line that is symmetric is Mg ii line that we detect in the near-IR spectrum (see Fig 1). We fit the Mg ii profile with a Gaussian and estimated the emission redshift to be = 3.2550.001. In what follows, we use = 3.255 for all practical purposes.

3 Brief description of metals in individual systems
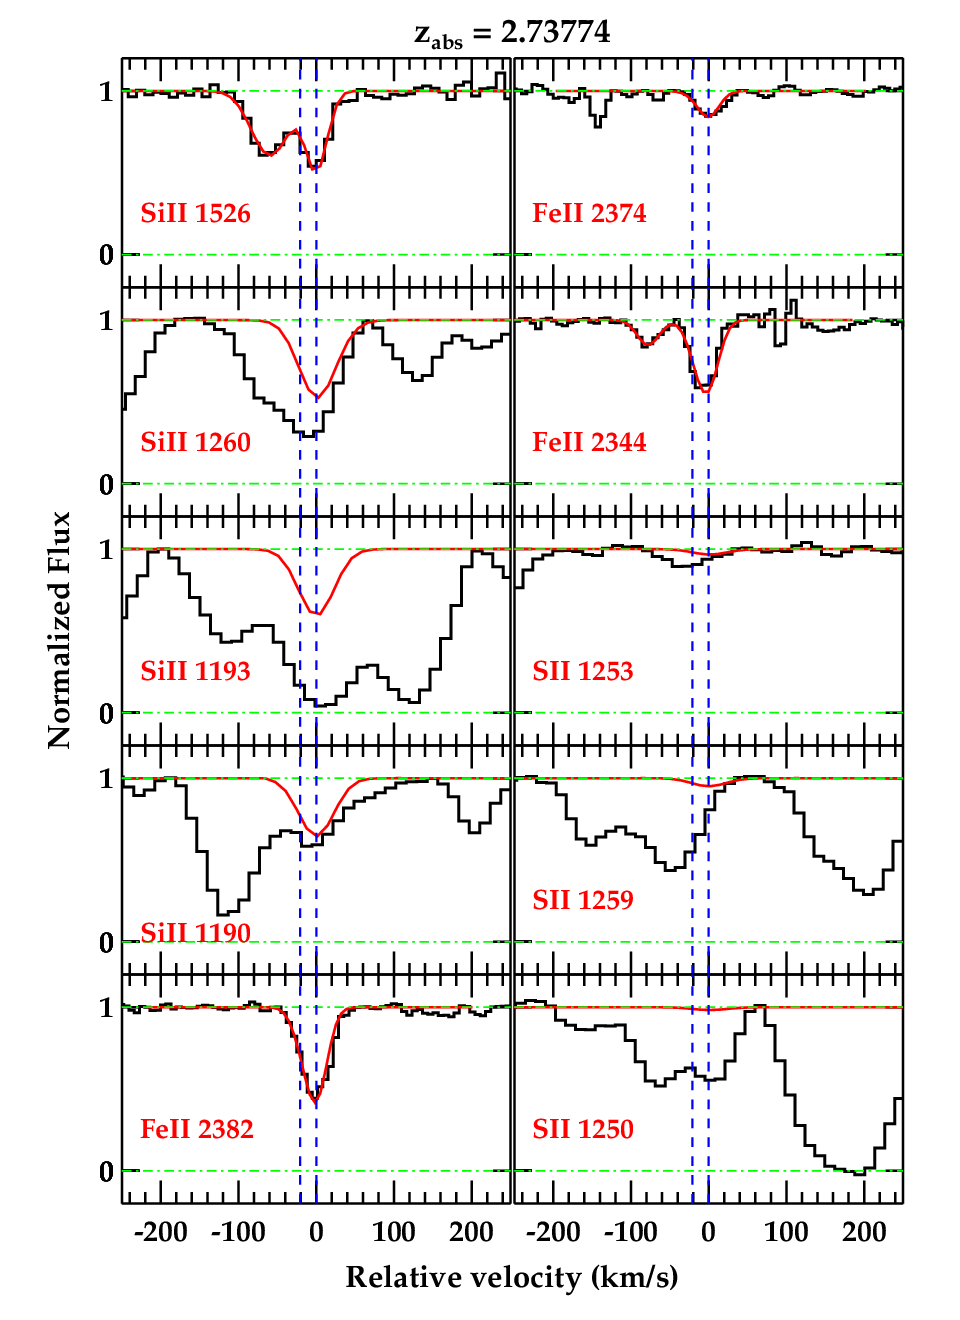
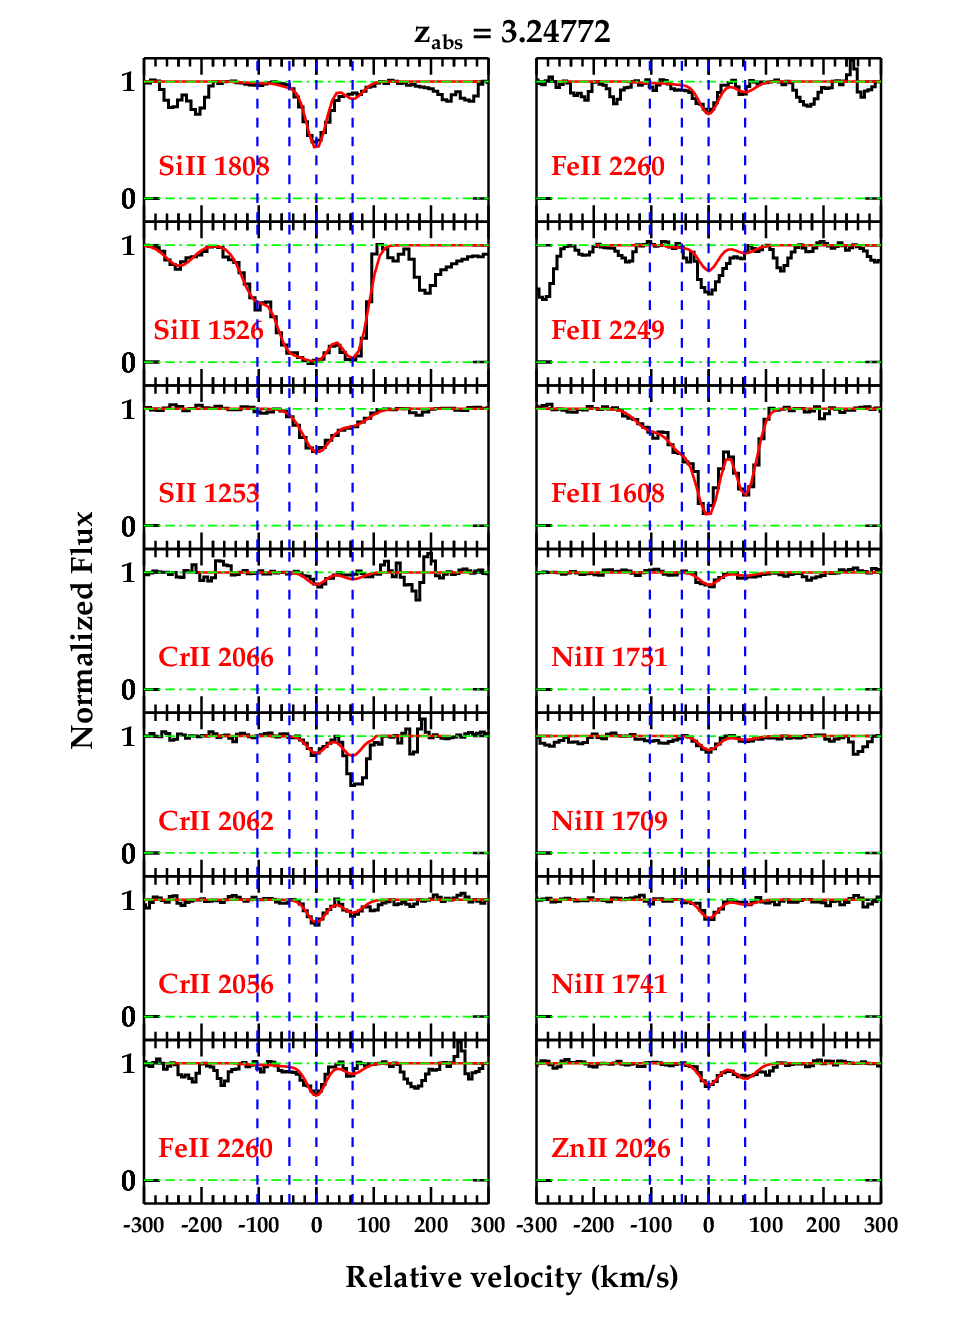
Along the J2358+0149 sightline, we detect five absorption systems with Ly absorption showing damping wings : one sub-DLA (at = 2.73773) and four DLAs (at = 2.97919, 3.10956, 3.13333 and 3.24772). We estimate the column densities of H i and metal ions using the Voigt profile fitting code vpfit11 1 http://www.ast.cam.ac.uk/~rfc/vpfit.html version 10.0. The Voigt profile fits to the Ly absorption lines are shown in Fig 2. In the case of metal lines, while fitting the profiles22 2 As the seeing during our observations was better than the slit width used, the actual resolution achieved is slightly better than the normal value. Therefore, we adjusted the instrumental profile by fitting the narrow telluric absorption lines. The measured resolution is and in the visible and UVB respectively. We use these values to generate instrumental profiles while fitting the absorption lines. Note this effect is not important in the case of extended line emission from galaxies. we keep the and -parameter for each component to be same for all the species (i.e. species are assumed to be tied to each other and the absorption profile is dominated by non-thermal motions). Due to the intermediate resolution of the X-shooter spectrum, hidden saturation in the narrow lines can hinder our metallicity measurements. Therefore, as far as possible we discuss the metallicities of species that were measured using several lines having a wide range of oscillator strengths. In particular this is true for Fe ii and Si ii. Voigt profile fits overlayed on the data for all the 5 systems are presented in the Appendix (see Fig. 8-12). We also summarize the results of Voigt profile fitting of individual components in tables given in the Appendix (see tables 5-9). The set of transitions used to derive these fits are provided when we discuss individual systems below. The total column densities of different species obtained are summarized in Table 2. The metallicity33 3 [Z/H] (Z/H)(Z/H)⊙ of individual ions detected (without applying ionization corrections) in these five systems are summarized in Table 3. We provide a short summary of each system in this section. For all discussion on metallicity we use solar relative abundances of the metals taken from Asplund et al. (2009).
| log (cm-2) | |||||||
|---|---|---|---|---|---|---|---|
| H i | Si ii1 | S ii | Fe ii | Ni ii | Cr ii | Zn ii | |
| 2.73774 | |||||||
| 2.97919 | |||||||
| 3.10957 | |||||||
| 3.13333 | |||||||
| 3.24772 | |||||||
1 The quoted column density can be affected by the presence of hidden saturation components if they have < 4 km s-1. See text.
| [Si/H] | [S/H] | [Fe/H] | [Ni/H] | [Cr/H] | [Zn/H] | |
|---|---|---|---|---|---|---|
| 2.73774 | ||||||
| 2.97919 | ||||||
| 3.10957 | ||||||
| 3.13333 | ||||||
| 3.24772 |
3.1 The sub-DLA at = 2.7377
The Voigt profile fit to the damped Ly absorption gives log (H i) = 20.070.05 (see Fig. 2). In addition to the Ly, absorption lines from Si ii, S ii, Fe ii and Mg ii lines are detected. At the resolution of our spectrum these lines are unresolved. We measure rest equivalent width () of 0.50 and 0.40 Å for the Mg ii doublets. The expected position of C ii absorption falls in the Ly absorption of the = 2.9791 system. Therefore, we could not have a handle on the gas cooling rate for this system. To get a better constraint on the column density measurements, we perform Voigt profile fits of Si ii 1526 and Fe ii 2382,2374,2344. The best fit Voigt profiles for this system is shown in Fig. 8 and measured column densities are shown in Table. 2. A 3 upper limit to the column density is measured for blended S ii transitions in this system. The metallicity of the gas based on Si ii absorption is [Si/H] = . The measured upper limit on sulphur metallicity based on S ii (i.e. ) are consistent with this metallicity (see Table 3). Based on the observed Fe ii column density we derive [Fe/H] = . Even though the mean metallicity of Fe suggests a possible under abundance, the errors are too large to draw any firm conclusion. We do not detect H2 from this system. Given the low metallicity and low (H i) measured in this system, non-detection of H2 is not at all surprising (Petitjean et al., 2006). This system does not show a strong C iv absorption (with (C iv 1548) Å). However, it is interesting to note that the nearest Ly absorption system with a velocity separation of km s-1 (i.e. at = 2.7259, the line seen at 4530 Å in Fig. 2) shows a strong C iv (with (C iv 1548) Å) and Si iv absorption. In our 2D spectrum we do not detect any associated emission line galaxy at all three position angles within the impact parameter probed (i.e. kpc).
3.2 The DLA at = 2.9791
This is the system with the highest H i column density along the line of sight to J2358+0149. The Voigt profile fit to the Ly line gives log (H i) = (see Fig. 2). This is close to the limiting column density (log (H i) = ) used by Noterdaeme et al. (2014) to define extremely strong DLAs (ESDLAs). In this system, absorption lines of C ii, Si ii, Cr ii, Fe ii, Ni ii and Zn ii along with C ii∗ are detected. Even at the spectral resolution of the X-shooter most of the absorption lines are saturated. In the NIR spectrum we detect very strong Mg ii (with 2.6 Å and 2.2 Å for the doublet) Fe ii 2600 (with Å) and Mg i (with Å) lines. Thus purely based on Mg ii absorption strength this system is in the lower end of “ultra-strong” Mg ii systems. Such absorbers show very large velocity spread and are thought to be associated either with supernova driven winds (Nestor et al., 2011, see for example,) or cold gas embedded in intragroup media (Gauthier, 2013). Using the JHU-SDSS catalog (Zhu & Ménard, 2013) of Mg ii absorbers we find that only 0.5% of the Mg ii absorbers at 2.0 have such large equivalent widths for Mg ii and Fe ii. Thus based on observed (H i) and equivalent widths of Mg ii and Fe ii the present system seems to be a rare system among the QSO absorption line systems.
As expected the absorption line from singly ionized species spread over km s-1 whereas C iv absorption spread over 400 km s-1(see Fig. 5). Using the definition of Ledoux et al. (2006), we measure 44 4 Using the moderate resolution spectrum can bias the derived values. However, for the spectral resolution of the X-shooter, this effect is expected to be small for the value we find here (Arabsalmani et al., 2015, see Fig. 1 of). of 168, 141 and 144 km s-1 for Fe ii 1608, Si ii 1808 and C iv 1548 respectively. Only of high- DLAs show such a large velocity spread of low ion absorption lines (Noterdaeme et al., 2008, see Fig. 9 of). The velocity spread similar to the one we see for C iv is also very rare in DLAs (Fox et al., 2007, see Fig. 2 of) and in intervening Ly forest absorbers (Muzahid et al., 2012, see Fig. 11 of). We will discuss the implications of the large velocity width in detail in Section 4.
The Voigt profile fits to the absorption lines were performed using Si ii 1526,1808, Fe ii 1608,2249,2260, Cr ii 2062, Ni ii 1709, Zn ii 2026 and C ii∗ 1335.7 simultaneously with five components. The contribution of the blends Cr ii 2026 and Mg i 2026 in Zn ii 2026 has to be taken care of while fitting. As we do not have independent constraints on Mg i column densities, uncertainties in the derived Zn ii column density may be higher than the statistical error we quote. The derived parameters are presented in Table 2 and the fit is shown in Fig. 9. We measure [Zn/H] = and [Si/H] = . This is consistent with a low metallicity gas without relative enhancement of -elements with respect to the Fe co-production elements. As can be seen from Fig. 9, the absorption profile is well fitted with 5 components with a reduced . However, from Table 6 we notice that the main component has a large -value. In order to check the possible hidden narrow saturated component in this velocity range, we fitted the absorption profile by fixing the parameter in the range 3-8 km s-1 as typically derived for metal lines observed at high-resolution. Values lower than this are usually associated with H2 components (Ledoux et al., 2003; Srianand et al., 2005). The derived column densities are consistent (i.e. at most 0.1 dex higher) with our best fit values in the case of Cr ii, Zn ii, Fe ii and Ni ii as we have good constraints from weak lines that have residual fluxes consistent with non-saturation even at these -values. However, in the case of Si ii for = 3 km s-1 we could accommodate a factor of two higher column density in a hidden saturated component compared to our best fitted value. Therefore, our Si ii absorption is susceptible to undetected hidden saturation and high resolution spectrum is needed to get an accurate column density.
The dust content in this absorber can be determined from the depletion factors of metals detected compared to zinc: , and . The small depletion seen in this very high H i column density absorber is consistent with the lack of strong reddening signatures in the QSO continuum. We do not detect the absorption from C i, Ti ii, Na i and Ca ii. The expected position of fine-structure lines of O i falls in the red wing of the DLA at = 3.2477. We do not detect fine-structure lines of Si ii also. We differ a detailed discussions on C ii∗ cooling rate to Section 4.
It has been suggested that H2 may be more frequently detected in ESDLAs compared to the normal DLAs (Noterdaeme et al., 2015a; Noterdaeme et al., 2015b, see). We do not detect H2 in any of the Voigt profile component of the low ions. We place a 3 upper limit on log (H2, J=0) 15.54 (3) and for log (H2,J=1)15.70 (3) for a line having a typical width of the narrowest line detected in the Ly forest. We detect an associated galaxy through a strong [O iii] emission line. While the BOSS spectrum of the QSO does show an emission feature in the middle of the Ly absorption we do not detect any Ly emission in our X-shooter spectrum. Detailed analysis of the galaxy is presented in Section 4.
3.3 The DLA at = 3.1095
We measure for this system. At the X-shooter’s resolution the absorption is mostly concentrated in one component. Absorption from Ar i, N i, O i, C ii, Si ii, Fe ii, Mg ii and Mg i are observed in this system. From the NIR spectrum we measure the equivalent widths of Mg ii ( 1.00 and 0.88 Å for the doublet), Fe ii 2600 ( 0.58 Å) and Mg i ( 0.18 Å). We performed Voigt profile fits with two components for N i 1199.5, O i 971,976,1039, Ar i 1048, C ii 1334, Si ii 1526,1808 and Fe ii 1608,2344,2374 transitions. It is possible that our column density estimations are affected by unresolved saturation in the strong resonance transitions like C ii. The best fit Voigt profile to the ions is shown in Fig. 10. We derive [Si/H]=, [O/H]=, [N/H]=, [Ar/H]= and [Fe/H]=. The large variations in the metallicity measurements may be a consequence of hidden line saturation (the main component is narrow and requires low -value as can be seen in Table 10) and one needs to be cautious in interpreting them. The metallicity measurements are consistent with very little or no depletion of Fe. As typically seen in other DLAs we also notice [N/O] being much below the primary line (Petitjean et al., 2008; Cooke et al., 2011; Dutta et al., 2014, see,). The measured abundance pattern makes this system an interesting target for metallicity measurements with high resolution spectroscopy. We do not detect any emission line galaxy associated to this DLA.
3.4 The DLA at = 3.1333
The measured in this system just about satisfies the definition of a DLA. Absorption from C ii, Si ii, Fe ii and O i are observed in this system. The Mg ii (0.49 and 0.44 Å for the doublet) and Fe ii 2600 (0.27 Å) lines are relatively weak compared to the other systems. The column density and -parameter measurements of the observed ions are derived from C ii 1036, Si ii 1526,1260, Fe ii 2382,2374,2344 and O i 1039. The Voigt profile fit to the metals and measured column densities are shown in Fig. 11 and Table 2. The derived [Si/H]= is higher than that of the other DLAs discussed above. We also find [Fe/Si]=. As column densities of Fe ii and Si ii were obtained using several transitions, this low value of Fe could reflect dust depletion. Due to the low measured (H i) we expect this absorber to produce little extinction even if there is dust depletion at the level inferred above. Like the = 3.1095 system the measured O i column density (i.e. (O i)=14.930.26) suggests a lower [O/H]= compared to that inferred from the Si measurements. As in the case of the previous system the -value for the main component is low (see Table 11) and hidden saturation could affect our metallicity measurement, it will be interesting to measure these abundances with high resolution spectra.
3.5 The DLA at = 3.2477
The measured of this DLA is very close to the QSO redshift, and the measured velocity, km s-1, with respect to the QSO is consistent with the system being a proximate DLA (Ellison et al., 2010, pDLA,). We measure by fitting the DLA profile. In this system, we detect absorption from C ii, S ii, Si ii, Fe ii, Mg ii, Mg i, Cr ii, Ni ii and Zn ii. The equivalent width of Mg ii absorption ( and 4.0 Å for the doublet) is much higher than what we have seen for the = 2.9791 DLA. However Mg i absorption is relatively weaker (i.e. (Mg i)0.27 Å) compared to that measured in the other systems. This may imply an extended velocity structure in the present system compared to the = 2.9791 DLA.
Absorption profiles of strong low-ion transitions like Si ii 1526 and Al ii 1670 spread over km s-1, while those of relatively weak low-ion transitions like Fe ii 1608 spread over 250 km s-1 (see Fig. 7) has = 149 km s-1. Unlike in the case of the = 2.9791 DLA, the high ionization phase probed by the C iv absorption is not wider than that of the low-ions. However, the C iv absorption profile is distinctly different from those of the low-ions and spread over 250 km s-1. Despite the pDLA being very close to the QSO we do not detect N v or O vi absorption associated to the C iv absorption (Petitjean et al., 1994, as often seen in the associated absorbers in).
Detection of absorption from the excited fine-structure levels of C ii, Si ii and O i, in the associated absorption systems, can be used to infer the distance of the absorber from the QSO (Srianand & Petitjean, 2000; Fathivavsari et al., 2015, see for example,). Due to the large velocity spread, C ii∗ 1335 from the strong components are blended with C ii 1334 from the velocity components in the red. Similarly, the expected wavelength range of O i∗ 1304 and O ii∗ 1306 absorption falls with the profile of Si ii 1304 absorption. High resolution spectra are needed to measure the column densities of these species. However, the expected wavelength range of Si ii∗ 1533 falls in the blending free region. We do not detect any clear absorption line. For the main component we get log (Si ii∗) (3).
Multi-component Voigt profile fit is performed using Si ii 1808,1526, S ii 1253, Fe ii 1608,2249,2260, Cr ii 2066, Ni ii 1741,1709,1751 and Zn ii 2026 transitions and is shown in Fig. 11. Both the C ii 1334,1036 transitions are heavily saturated and hence were not included while fitting.
The column density of Zn ii 2026 has negligible contribution from Cr ii 2026 and Mg i 2026 lines. The metallicity for this DLA is . Within measurement uncertainties, this is consistent with [Si/H] = and [S/H] = . Therefore, for this systems also we do not find any indication of enhanced -element abundance compared to the Fe co-production elements. We tested the effect of possible hidden saturation as explained in Sect. 3.2. Similar to the = 2.9791, we find that the column densities of Zn ii, Cr ii, Fe ii and Ni ii are not dependent on the assumed -values. However, for Si ii, the presence of possible hidden saturation could increase the observed column density by upto 1 dex if km s-1. While high-resolution is required to accurately measure (Si ii), a one dex higher value would lead to a [Si/Zn] ratio much above the Solar value, which is unlikely.
The dust content in this DLA can be determined from the depletion factors of iron, nickel, chromium, silicon compared to zinc. We measure, [Cr/Zn] = , [Ni/Zn] = and [Fe/Zn] = . The moderate depletion noted here is consistent with what is seen in the halo gas in our galaxy. We also measure the dust to gas ratio and iron column density in dust of log . Systems having metallicity, and as measured in the present case are known to have a high probability for H2 detections (Petitjean et al., 2006; Noterdaeme et al., 2008, see). However we do not detect H2 in any of the low-ion component and we place the limiting column densities of log (5) and log (5) for the strongest low-ion component. We detect Ly emission associated to this DLA. However, no other emission line is clearly detected. We discuss this in detail in section 5.
4 Properties of the galaxy associated to the = 2.9791 DLA

| Line | Flux | Luminosity |
|---|---|---|
| () | () | |
| Ly | 0.64a | |
| O ii3727 | ||
| H4862 | ||
| O iii4960 | ||
| O iii5008 |
a Obtained assuming Ly line spread as expected in the static medium (see text for details). b Using the line width identical to that of O iii.
We detect [O iii] 4960, 5008 emission in the spectrum obtained with the slit aligned at a position angle (PA) = 0∘ for the DLA at = 2.97919 (See Fig. 3). The emission is seen at a projected separation of arc sec from the QSO trace that corresponds to an impact parameter of kpc. The fact that the emission is not seen in spectra taken with slit oriented in other two position angles is consistent with the extent of the emitting region being smaller than 13 kpc in the East-West direction. The emission is unresolved in the spatial axis suggesting that the galaxy is compact with a size of kpc. We do not detect other emission lines like Ly, H and [O ii] 3727 at the spatial location where the [O iii] emission is detected. We derive the [O iii] line flux by fitting Gaussians to the observed line profiles (see bottom panel of Fig. 3).
In the case of other non-detected emission lines, we derive the 3 upper limits by assuming the line width to be similar to that of the [O iii] line. As the Ly emission can be much wider than the rest of the lines, due to radiative transport effects, we follow a different procedure to get its limiting flux. As can be seen in Fig. 4, no significant flux is detected along the expected trace of the emission line galaxy. If we assume the gas to be a static slab, then the Ly profile will have double humps separated by 1200 (respectively 526) km s-1 if we assume the gas temperature to be 104 K (respectively for 100 K) for the measured (H i) (Dijkstra, 2014, using eq. 21 of). We integrated the flux within 600 km s-1 to the redshift of the [O iii] emission along the spectral axis and 2.5 pixels in the spatial axis centered around the expected location of the trace from the [O iii] emission. This gives the 3 flux limit of erg cm-2 s-1.
Table 4 lists the derived fluxes and corresponding luminosities of these lines. The values given are obtained without applying any dust correction or correction for slit losses. Both these will make the intrinsic luminosity of the [O iii] line higher than what we infer. Till now [O iii] emission is detected in 7 high- (i.e. 1.9) DLAs (Fynbo et al., 2013, see Table 6 of). The observed [O iii] luminosity in the present case is close to the median value observed among other DLAs. The main difference is that the present system has the highest and lowest metallicity among the high- DLAs with the detection of [O iii] emission. The total [O iii] luminosity is 0.3 L∗ as per the fit to the H +[O iii] luminosity function given by Khostovan et al. (2015) for galaxies.
4.1 Emitting and absorbing gas kinematics


The single component Gaussian fit to the [O iii] lines gives a deconvolved FWHM of 110 km s-1 and a velocity dispersion of km s-1. We can use this to estimate the dynamical mass of the galaxy within the [O iii] line emitting region. For a given optical size () of the galaxy one can estimate the dynamical mass () using the relation (Maseda et al., 2014, see). As we do not have the photometric measurement of , we use two values for estimating the range in the dynamical mass. First, we consider kpc as inferred based on the fact that the emission is unresolved in the spatial direction along the slit. This gives . At , typical size of LBGs are smaller than 4.5 kpc limit we have found. If we assume the typical kpc (as found by Shibuya et al., 2015, for example) measured for the LBGs at these redshifts we get . The inferred dynamical mass is similar to what has been seen in the extreme emission line galaxies at high- by Maseda et al. (2013).
Assuming a simple dark matter density profile (isothermal profile) and normalizing the density at the optical radius to the mean density within the optical radius ( = 1 or 4.5 kpc as considered above), we find the total mass within 12 kpc to be . This will mean a circular velocity of 105121 km s-1 at 12 kpc. In Fig. 5 we compare the emission line profile from the galaxy to the absorption profile measured along the QSO sight line. It is clear that almost all the low-ion absorption are redshifted with respect to the systemic redshift of the galaxy defined by the centroid of the [O iii] emission lines (i.e. = 2.9784). Specifically, individual Voigt profile components used to fit the low ion absorption have redshifted velocities of -32, 4.2, 60, 132.6 and 171.1 km s-1. In addition to these components C iv absorption has components at 60 and 160 km s-1. Considerable absorption of low and high ions originate outside the circular velocity we inferred above. Therefore, it is most unlikely that the absorption originates from an extended co-rotating disk.
It is possible that the absorbing gas may originate either from the large scale infall or outflow as usually suggested for the “ultra-strong” Mg ii absorbers (Gauthier & Chen, 2012; Bouché et al., 2012; Kacprzak et al., 2012; Bouché et al., 2013). In these cases, galaxy rotational velocity, orientation of the galaxy with respect to the QSO sight line are used in addition to the absorption kinematics to draw conclusions on the nature of the gas flow. In the absence of the galaxy image it will be difficult to draw firm conclusions on the nature of the gas flow in the present case.
In addition, the spatially unresolved [O iii] emission we detect may originate from a star forming clump that may be from a region away from the centre of a massive quiescent galaxy like the one found by Zanella et al. (2015). Therefore, it is of utmost importance to have deep imaging to get further insights into the nature of this galaxy.
4.2 Star formation rate
As we detect only [O iii] lines we use the upper limits on [O ii] and H to infer the upper limit on the star formation rate. We will use standard relationships used in the literature assuming Salpeter IMF in this study. The calibration between [O iii] luminosity and SFR (derived from other tracers) is recently established in the case of high- LBGs (Suzuki et al., 2015, see for example,) and GRB host galaxies (Krühler et al., 2015). If we use these relationships we get 6.6SFR (M⊙ yr-1). From the 3 limit on the [O ii] luminosity we derive a star formation rate (SFR) of M⊙ yr-1 using the relationship given by Kennicutt (1998). Similarly if we use the standard Balmer ratio of 2.8 and the relationship between H luminosity and SFR given by Kennicutt (1998) we derive SFR 3.8 M⊙ yr-1 for the 3 upper limit on the H luminosity. The wide range in SFR derived above reflects the fact that ionized gas in the present case is highly excited compared to what is typically seen. We discuss this in detail in the next section.
We can also estimate the upper limit on SFR in the DLA galaxy using the inferred upper limit on the Ly line flux assuming that the Ly photons mainly originate from the H ii regions around massive stars and case B recombination (Osterbrock & Ferland, 2006). The Ly luminosity (LLyα) is then related to the SFR () by,
| (1) |
where = 10.2 eV, and are, respectively, the energy of a Ly photon, the escape fraction of Lyman continuum photons and the number of ionizing photons released per baryon of star formation. We use and that is appropriate for the measured metallicity of the DLA (Samui et al., 2007, from Table 1 of). Thus the observed Ly luminosity gives an upper limit on the star formation rate, .
The non-detection of stellar continuum in the visible part of the spectrum places a constraint on the flux at the rest frame 1500 Å of the galaxy. However the implied limit on the star formation rate is not stringent (i.e. ). All this suggests that the DLA galaxy is forming stars at moderate rate. The strong [O iii] emission seen in this system may be related to the high excitation in the ionized gas. We discuss this in detail in the following section.
4.3 High [O iii]/[O ii] ratio and metallicity
The most interesting aspect of the present system is the very large value (i.e. ) of the [O iii]/[O ii] and [O iii]/[H] ratios. It is well documented now that galaxies tend to have elevated [O iii]/[O ii] ratio compared to local star forming galaxies (Steidel et al., 2014; Masters et al., 2014, see for example,). However, galaxies with this ratio greater than 10 are rare.
In the local universe, such high ratios (in the range 10-50) are seen in ‘extreme blue compact dwarf galaxies (BCDs)’. It has also been pointed out that these extreme BCDs are compact, have low metallicity and high specific star formation as found in high- LBGs. High excitations seen in low- BCDs and high- galaxies may be attributed to many possibilities such as low metallicity, high ionization parameter, hard ionizing radiation field and/or the presence of a density-bound H ii regions (Stasińska et al., 2015).
Narrow velocity width of the [O iii] line probably rules out the possibility of excitation due to a hidden AGN. Also the absence of [O ii] line rules out the strong [O iii]/[H] being due to elevated oxygen abundance. Recently it was suggested that systems with elevated [O iii]/[O ii] ratio may have large Lyman continuum (LyC) escape fraction if the gas is optically thin (i.e. matter bound H ii regions). Such galaxies will also show strong Ly emission as it’s escape fraction is also enhanced due to optical depth being low (Jaskot & Oey, 2014; de Barros et al., 2016, see for example,). Indeed, in the = 3.2 Lyman continuum leaking galaxy studied by de Barros et al. (2016) the observed and ratios are consistent with our galaxy. However, Ly emission is clearly detected with . Our observations rule out such a ratio by more than 7 level. Therefore, it is most unlikely that the elevated [O iii] luminosities seen in the present case may be due to matter bound line emitting nebula.
Stanway et al. (2014) have argued that the high [O iii]/H ratio can be explained through the ageing of a rapidly formed stellar population. The probability of detection of galaxies with high [O iii]/H depends on the time-scale over which such elevated ratios are maintained in the star bursting region. They showed that the inclusion of binary evolution in the stellar synthesis code enhances this duration up to few 100 Myrs. It is interesting that even in their model one needs high densities and low metallicity in the ISM to get such large [O iii]/H ratios. In this scenario the present system could have gone through a recent star burst activity with a relatively metal poor ageing stellar population surrounded by a dense interstellar medium.
Using the IZI (Inferring the gas phase metallicity (Z) and ionization parameter of the ionized nebula) code described in Blanc et al. (2015) and assuming the photoionization model results of Levesque et al. (2010) we derive constraints on the nebular metallicity (i.e. 12+[O/H] 8.5), ionization parameter (i.e. log q8.14 and log U). Such large ionization parameters are inferred in 25% of the galaxies studied by Masters et al. (2014). The upper limit on metallicity is consistent with the metallicity we derive for the DLA along the QSO line of sight. While we need to detect other nebular lines with deep spectroscopic observations to draw firm conclusions on the physical conditions in this DLA galaxy, all indications are suggesting the galaxy to be compact, moderately star forming and having low metallicity and high specific star formation rate.
4.4 C ii∗ cooling rate:
Associated C ii∗ 1335 absorption is clearly detected in this DLA (see Fig. 5). Using Voigt profile fits we obtain (C ii∗) = 13.640.07. This together with the total (H i) measured gives a cooling rate ergs s-1 H-1. Wolfe et al. (2008) have proposed a bimodal distribution in DLA population based on [C ii] cooling rate : “low-cool” DLAs with and “high-cool” DLAs with (where ). The cooling rate inferred for the present DLA belongs to the “low-cool” population. The metallicity and cooling rate inferred in the present case is close to that of the = 2.5397 system toward J1004+0018 studied by Dutta et al. (2014). We can use the model results presented in their Fig. 14 to interpret C ii∗ observations for the present system. The observed ratio, (C ii∗)/(Si ii) = and the cooling rate can be explained with a radiation field similar to Galactic mean UV field and a hydrogen density of 1 cm-3. Therefore, the absorbing gas (if part of a cold neutral medium) is seeing excess radiation either from the galaxy or from the ongoing in situ star formation.
Following Wolfe et al. (2008) we can write,
| (2) |
where, , and are dust to gas ratio, grain heating efficiency and local background radiation field intensity respectively. When we use the maximum dust efficiency (i.e. 2%) in the cold neutral medium found by Weingartner & Draine (2001) we get erg s-2 cm-2 Hz-1. If we further use equation 3 of Wolfe et al. (2008) we get the in-situ surface star formation rate, M⊙ yr-1 kpc-2. Although very small, our present observations can not rule out such a low SFR along the QSO sightline. Alternatively if the gas is not part of the stellar disk (as it is most likely) then the photo-heating can come from the galaxy light and in particular the [O iii] emitting region. Such a scenario has been proposed to explain the physical conditions in low- quasar-galaxy pairs (Dutta et al., 2015, see for example,).
However, if absorbing gas detected along the QSO sight line is part of an infalling or outflowing gas, then C ii∗ may be originating from a warm or partially ionized gas as suggested by Srianand et al. (2005) in the case of H2 bearing DLAs. If that is the case then we will not have much handle on the star formation rate from the C ii∗ cooling rate. This again suggests that purely based on the C ii∗ detection alone we will not be able to conclude that the absorbing gas is part of the cold ISM.
5 Ly emission from the DLA at = 3.2477

In the combined 1D spectrum we see some residual flux at the bottom of the Ly line of = 3.2477 DLA (see bottom panel in Fig. 6). In the top panel of Fig 6 we plot the 2D-Gaussian smoothed (with a FWHM of 5 pixels along the spatial direction and 3 pixels along the observed wavelength) combined 2D spectrum obtained with slits aligned at three different position angles. The overlayed contours are at the flux levels 2, 4, 6, 8, 10, 12, 14 Å-1. Excess flux is clearly seen in the wavelength range where we found residuals in the 1D spectrum. It is also clear from the images that most of the residual flux found is close to the trace suggesting that the Ly emitting source is very close to our line of sight to the QSO. In order to estimate the significance of the Ly emission we considered 9 apertures as shown by boxes in Fig. 6. Each aperture is 6 Å wide in the observed wavelength and 1.75 arc sec in the spatial direction. As expected the integrated flux () is maximum for the middle aperture and is 6 times higher than the average flux [i.e. ] of the remaining 8 apertures. As can be seen from the figure the peak emission is arc sec away from the center of the QSO trace.
In order to understand the possible spatial separation between the Ly emission and the QSO we repeated the above exercise on the 2D spectra obtained at different slit orientations. In the case of spectra obtained with position angles (PA) 0∘ and -60∘ we detect maximum flux in the middle aperture with the mean flux of the other 8 apertures less by about a factor of 3. We do not detect significant excess emission in the middle aperture in the case of PA = 60∘. But the flux errors are large and flux measured in other two position angles are consistent within 1.5 for the non-detection. In the case of PA = 0∘ the peak emission is at 0.5 arc sec below the QSO trace. In the case of PA = -60∘ the emission is concentrated in two blobs one above and one below the trace (with the off-set of 0.6 arc sec). This suggests that the Ly emission is extended and off-centred with respect to the QSO position. While we need a better S/N spectrum to perform triangulation the present data suggests that the emitting region is within 5 kpc of the QSO line of sight.
It is well known that, due to complex radiative transport, the profile of the Ly emission will not be a simple Gaussian. However, for simplicity we fit the Ly line in the 1D spectrum with a single Gaussian. The fit is also shown in the bottom panel of Fig. 6. The centroid of the Gaussian gives = 3.25120.0004 and the integrated Ly flux is (5.040.90). This confirms the emission at the 5 level. This corresponds to a luminosity of (4.50.8). Instead of fitting the Gaussian, if we simply measure the total flux in the bottom of the Ly absorption trough, we find the total flux to be (7.21.3) and the corresponding luminosity is . Finley et al. (2013) have found a strong Ly emission in 25% of the pDLAs with (H i)21.3. Their analysis favor these DLAs being associated with the host galaxies of the QSOs and probably not completely covering the Ly from the narrow line regions (NLR). The Ly flux measured in the present case is nearly 35 times less than the average flux measured by Finley et al. (2013) and probably do not belong to the pDLA population identified by them.
The Ly emission is roughly 280 km s-1 blue shifted with respect to the QSO based on the redshift of the QSO measured from the Mg ii emission line peak. However, the Ly emission is redshifted by about 320 km s-1 with respect to the strongest absorption component. For the observed value of (H i) for this system, if we assume the DLA to be a static medium having a kinetic temperature of 104 K then we expect the Ly emission to have a double hump with the peak in the red wing shifted by about 375 km s-1 (Dijkstra, 2014, see). This is roughly consistent with the shift we notice above between the redshift of the Ly emission and metal absorption lines. It is also interesting to note that the peak Ly emission occurs just outside the maximum velocity of the low ions (see Fig. 7) consistent with what one would have expected based on the Ly line transport.
In a simple radiative transport model, this can be understood in terms of scattering from an expanding (i.e. outflowing) H i shell. However the actual radiative transport may be a bit more complex when the medium is not static and has dust. In addition, the Ly emission could come either from the star forming regions in the DLA or from the fluorescence induced by the QSO UV flux if the absorber is very close to the QSO. We discuss both the possibilities.

5.1 Star formation rate
First we consider the possibility that the observed Ly emission originates from an intervening galaxy. In that case, we estimate the average SFR in the DLA, , using the prescription described in Section 4.2. The range comes from the luminosities estimated using the simple integration and the single component Gaussian fit to the Ly emission. Only a small fraction of Ly generated in the galaxy escapes the galaxy and some fraction of this emerging Ly photons are also absorbed by the IGM. Therefore, the above derived star formation rate without making any corrections for the radiative transport should be considered as a lower limit.
We detect neither [O ii] nor [O iii] emission. As the expected position of H coincides with the H emission from the QSO it is difficult to estimate the H luminosity associated to the DLA. From the rms in the expected position of the [O ii] line in the QSO continuum we obtain a 3 upper limit on the [O ii] luminosity of 1.2 erg s-1. If we use the relationship given by Kennicutt (1998) this translates to an upper limit in the star formation rate of 1.7 . This implies that the Ly escape fraction is more than 10% if we use the Ly luminosity based on Gaussian fits or % if we use the integrated Ly luminosity. Inclusion of corrections for dust extinction and the Ly opacity of the IGM will further increase this lower limit.
The lower limit we find here is higher than the mean measured value (i.e. ) in the high- LBGs (Hayes et al., 2010). However, such high values of are also seen in a couple of high- DLAs [i.e. in the case of = 2.35 DLA towards Q 2222-0946 (Fynbo et al., 2010) and in the case of = 2.21 DLA towards Q1135-0010 (Noterdaeme et al., 2012a)]. However, unlike the present case the inferred SFR based on the emission lines detected in the NIR in these cases are very high (i.e. M⊙ yr-1).
5.2 Fluorescent Ly emission induced by the quasar
The fluorescent Ly emission induced by the QSO is a viable alternative, in particular if the escape fraction of Ly is very small. We explore this possibility here.
To start with, we note that the size and surface brightness of the Ly emission seen are both less than what is typically seen in the case of radio-loud QSOs at similar redshifts (Roche et al., 2014, see for example,).This suggests that the origin of Ly emission in the present case may be very different from the extended Ly seen around radio galaxies. We also note that, based on the surface brightness of the Ly emission, lack of N v absorption and fine-structure lines of Si ii, this DLA is not similar to the one studied by Fathivavsari et al. (2015), where the DLA is thought to be dense, compact and close to the QSO covering the broad as well as narrow emission line region only partially (Finley et al., 2013, see also,). Therefore, it is most likely that we are not seeing the extended NLR of the host galaxy.
For the set of cosmological parameters assumed in this work, if we consider the redshift difference between the DLA and the QSO to be due to spatial separation then we expect the DLA to be 1.8 Mpc away from the QSO. As some part of the redshift difference may come from the peculiar velocities the actual separation can be slightly different.
From our flux calibrated spectrum and SDSS spectrum we infer the flux at 912 Å in the rest frame of the QSO to be 2.3 erg cm-2 s-1 Å-1. Assuming the UV spectrum of the QSO to be a power-law, , we estimate the H i photoionization rate as a function of distance in Mpc, , as . From the recent computations of UV-background using updated QSO and galaxy emissivities (Khaire & Srianand, 2015b; Khaire & Srianand, 2015a, see), we estimate the hydrogen photoionization rate due to the background to be . The two rates are equal for . Therefore, in the absence of in situ star formation, the DLA will receive at least 5 times more ionizing photons from the QSO compared to that from the background. Therefore, at face value the observed Ly originating from fluorescence is a realistic possibility.
The fluorescence induced Ly emission around radio-quiet QSOs have been reported in a few cases (Adelberger et al., 2006; Francis & McDonnell, 2006; Cantalupo et al., 2012; Cantalupo et al., 2014, see for example,). Typically one looks for: (i) large Ly line equivalent width mainly due to the absence of a strong continuum, (ii) profiles showing double humps and (iii) large surface brightness, to identify the candidate fluorescence Ly emitters. As the Ly emission is very close to the QSO trace, it is very difficult to measure the equivalent width in the present case. We do observe that the Ly emission peak is shifted with respect to the metal line absorption from the DLA. However this alone will not confirm the fluorescence as such a profile is also expected from the radiative transport even in the case of Ly induced by the embedded stars.
Following Shull et al. (2014), we can write the integrated unidirectional flux of the H iionizing photons, . We estimate photons for the meta-galactic UV background at . If we assume a one arcsec2 optically thick slab of H i gas in photoionization equilibrium with this background then we get a surface brightness, erg s-1 cm-2 arcsec-2, if the disk is seen face-on. Otherwise there will be a dilution factor that is a ratio of projected area along the line of sight to the actual area. Here, is the surface brightness expected purely due to the UV background radiation.
The observed surface brightness of the Ly emission in the present case is 2.9 erg s-1 cm-2 arcsec-2. In general, the surface brightness induced by the QSO fluorescence can be written as , where the factor is just . In the present case, for the face on condition, we find 142 and the cloud has to be at a distance of 340 kpc from the QSO. Therefore, the Ly emission seen in the present case can be produced by the QSO fluorescence if the gas is at 340 kpc from the QSO. However, the exact value will depend on the assumed geometry of the absorbing gas and the projected area towards the QSO and along the line-of-sight. Spatially resolved detection of associated stellar light, better mapping of the Ly emission and detection of other emission lines with deeper spectroscopic observations will allow us to test the fluorescence scenario more thoroughly.
6 Summary and discussions
Using long-slit spectroscopic observation of J2358+0149 (= 3.255), obtained in three different position angle with VLT-X-shooter, we have searched for emission lines originating from four DLAs and one sub-DLA in the redshift range 2.733.25. In this work we have presented the column density, metallicity and depletion measurements for all the 5 systems. We reported the detection of emission lines associated with two DLAs having, , with low ion absorption lines showing large velocity widths (i.e. km s-1for the Fe ii 1608 line). We do not detect any emission in the remaining three systems that have low (H i) and narrow metal line widths.
In the case of = 2.9791 ESDLA, that also satisfies the definition of “ultra-strong” Mg ii-systems, we detect [O iii] 4960,5008 emission at a projected separation of 11.90.8 kpc from the QSO sight line. The absorbing gas has a metallicity of [Zn/H] = and moderate dust depletion (i.e. [Zn/Fe] = ). The absence of [O ii] and H emission suggests that the galaxy is a high-excitation galaxy, similar to the “extreme blue compact dwarf” galaxies seen at the low-, undergoing a moderate star formation (SFR ). The large, [O iii]/[O ii]10 and [O iii]/H 10 ratios seen, are very rare even among high- LBGs that usually show elevated ratios compared to their low- counterparts. Based on the absence of He ii, C iv, Ly and Mg ii emission we feel the hidden AGN contribution to the excitation is least likely. We also do not favor the matter bound ionized region scenario as one would expect a strong Ly emission in this case. Considerable progress can be made if one can detect other emission lines and image the galaxy in the continuum light using deep observations. This will allow us to measure the metallicity and ionization parameter of the nebula and constrain the nature of the star formation in this galaxy. In addition, one will be able to understand the origin of the large velocity spread seen in the absorption lines in terms of cold accretion or large scale outflows. This will allow us to build a consistent model of this system.
In the case of = 3.2477 proximate DLA we detect extended and diffuse Ly emission in the DLA trough. The DLA has a metallicity of [Zn/H] = and moderate depletion [Zn/Fe] =. As in the previous case the metal line absorption has a very large spread and observed Mg ii equivalent widths are consistent with the system being called an “ultra-strong” Mg ii-system. The peak of the Ly emission is redshifted by about 330 km s-1 with respect to the strongest low-ion absorption component. This is consistent with what is expected from the simple radiative transport models with gas outflow. As the absorber is very close to the systemic redshift of the QSO we have two viable scenarios for the origin of Ly emission: from in situ star formation in the DLA galaxy or Ly fluorescence induced by the QSO. In the former case we use the Ly luminosity to estimate the star formation rate in the range 0.170.23 M⊙ yr-1 assuming . Based on the lack of [O ii] emission line we derive SFR M⊙ yr-1 and . The latter is higher than what is typically measured in high- LBGs (Hayes et al., 2010) but consistent with what is seen in the case of =2.207 DLA towards SDSS J113520.39-001053.56 (Noterdaeme et al., 2012a). We show that the Ly fluorescence, caused by the QSO, can also reproduce the observed Ly emission, provided the absorbing gas lies no more than 340 kpc from the QSO. While the exact physical situation in the present case may not be similar to what is seen in the radio-loud QSOs or in the compact proximate DLAs that do not cover the narrow line emission regions, present data does not rule out the fluorescence scenario. Detecting or placing a deep limit on the continuum emission is important to choose between the two viable alternatives discussed here. High resolution spectra of the QSO is also needed to get accurate metallicity and gas kinematics based on the absorption lines.
7 Acknowledgment
TH wishes to thank IUCAA for hospitality. We thank Sussana Vergani for her help in preparing the observational blocks.We thank the anonymous referee for useful comments.
References
- Adelberger et al. (2006) Adelberger K. L., Steidel C. C., Kollmeier J. A., Reddy N. A., 2006, ApJ, 637, 74
- Arabsalmani et al. (2015) Arabsalmani M., Møller P., Fynbo J. P. U., Christensen L., Freudling W., Savaglio S., Zafar T., 2015, MNRAS, 446, 990
- Asplund et al. (2009) Asplund M., Grevesse N., Sauval A. J., Scott P., 2009, ARA&A, 47, 481
- Blanc et al. (2015) Blanc G. A., Kewley L., Vogt F. P. A., Dopita M. A., 2015, ApJ, 798, 99
- Bouché et al. (2012) Bouché N., Hohensee W., Vargas R., Kacprzak G. G., Martin C. L., Cooke J., Churchill C. W., 2012, MNRAS, 426, 801
- Bouché et al. (2013) Bouché N., Murphy M. T., Kacprzak G. G., Péroux C., Contini T., Martin C. L., Dessauges-Zavadsky M., 2013, Science, 341, 50
- Bunker et al. (1999) Bunker A. J., Warren S. J., Clements D. L., Williger G. M., Hewett P. C., 1999, MNRAS, 309, 875
- Cantalupo et al. (2012) Cantalupo S., Lilly S. J., Haehnelt M. G., 2012, MNRAS, 425, 1992
- Cantalupo et al. (2014) Cantalupo S., Arrigoni-Battaia F., Prochaska J. X., Hennawi J. F., Madau P., 2014, Nature, 506, 63
- Christensen et al. (2009) Christensen L., Noterdaeme P., Petitjean P., Ledoux C., Fynbo J. P. U., 2009, A&A, 505, 1007
- Christensen et al. (2014) Christensen L., Møller P., Fynbo J. P. U., Zafar T., 2014, MNRAS, 445, 225
- Cooke et al. (2011) Cooke R., Pettini M., Steidel C. C., Rudie G. C., Nissen P. E., 2011, MNRAS, 417, 1534
- Crighton et al. (2015) Crighton N. H. M., et al., 2015, MNRAS, 452, 217
- Dekel et al. (2009) Dekel A., et al., 2009, Nature, 457, 451
- Dijkstra (2014) Dijkstra M., 2014, PASA, 31, 40
- Dutta et al. (2014) Dutta R., Srianand R., Rahmani H., Petitjean P., Noterdaeme P., Ledoux C., 2014, MNRAS, 440, 307
- Dutta et al. (2015) Dutta R., Srianand R., Muzahid S., Gupta N., Momjian E., Charlton J., 2015, MNRAS, 448, 3718
- Ellison et al. (2010) Ellison S. L., Prochaska J. X., Hennawi J., Lopez S., Usher C., Wolfe A. M., Russell D. M., Benn C. R., 2010, MNRAS, 406, 1435
- Erb et al. (2006) Erb D. K., Steidel C. C., Shapley A. E., Pettini M., Reddy N. A., Adelberger K. L., 2006, ApJ, 646, 107
- Fathivavsari et al. (2015) Fathivavsari H., Petitjean P., Noterdaeme P., Pâris I., Finley H., López S., Srianand R., Sánchez P., 2015, MNRAS, 454, 876
- Finley et al. (2013) Finley H., et al., 2013, A&A, 558, A111
- Fox et al. (2007) Fox A. J., Ledoux C., Petitjean P., Srianand R., 2007, A&A, 473, 791
- Francis & McDonnell (2006) Francis P. J., McDonnell S., 2006, MNRAS, 370, 1372
- Fumagalli et al. (2015) Fumagalli M., O’Meara J. M., Prochaska J. X., Rafelski M., Kanekar N., 2015, MNRAS, 446, 3178
- Fynbo et al. (2010) Fynbo J. P. U., et al., 2010, MNRAS, 408, 2128
- Fynbo et al. (2013) Fynbo J. P. U., et al., 2013, MNRAS, 436, 361
- Gauthier (2013) Gauthier J.-R., 2013, MNRAS, 432, 1444
- Gauthier & Chen (2012) Gauthier J.-R., Chen H.-W., 2012, MNRAS, 424, 1952
- Goldoni et al. (2006) Goldoni P., Royer F., François P., Horrobin M., Blanc G., Vernet J., Modigliani A., Larsen J., 2006, in SPIE Conf. Ser.. , doi:10.1117/12.669986
- Guimarães et al. (2009) Guimarães R., Petitjean P., de Carvalho R. R., Djorgovski S. G., Noterdaeme P., Castro S., Poppe P. C. D. R., Aghaee A., 2009, A&A, 508, 133
- Hartoog et al. (2015) Hartoog O. E., Fynbo J. P. U., Kaper L., De Cia A., Bagdonaite J., 2015, MNRAS, 447, 2738
- Hayes et al. (2010) Hayes M., et al., 2010, Nature, 464, 562
- Jaskot & Oey (2014) Jaskot A. E., Oey M. S., 2014, ApJ, 791, L19
- Kacprzak et al. (2012) Kacprzak G. G., Churchill C. W., Nielsen N. M., 2012, ApJ, 760, L7
- Kanekar et al. (2014) Kanekar N., et al., 2014, MNRAS, 438, 2131
- Kennicutt (1998) Kennicutt Jr. R. C., 1998, ARA&A, 36, 189
- Kereš et al. (2005) Kereš D., Katz N., Weinberg D. H., Davé R., 2005, MNRAS, 363, 2
- Khaire & Srianand (2015a) Khaire V., Srianand R., 2015a, MNRAS, 451, L30
- Khaire & Srianand (2015b) Khaire V., Srianand R., 2015b, ApJ, 805, 33
- Khostovan et al. (2015) Khostovan A. A., Sobral D., Mobasher B., Best P. N., Smail I., Stott J. P., Hemmati S., Nayyeri H., 2015, MNRAS, 452, 3948
- Krogager et al. (2012) Krogager J.-K., Fynbo J. P. U., Møller P., Ledoux C., Noterdaeme P., Christensen L., Milvang-Jensen B., Sparre M., 2012, MNRAS, 424, L1
- Krogager et al. (2013) Krogager J.-K., et al., 2013, MNRAS, 433, 3091
- Krühler et al. (2015) Krühler T., et al., 2015, A&A, 581, A125
- Kulkarni et al. (2000) Kulkarni V. P., Hill J. M., Schneider G., Weymann R. J., Storrie-Lombardi L. J., Rieke M. J., Thompson R. I., Jannuzi B. T., 2000, ApJ, 536, 36
- Ledoux et al. (2003) Ledoux C., Petitjean P., Srianand R., 2003, MNRAS, 346, 209
- Ledoux et al. (2006) Ledoux C., Petitjean P., Fynbo J. P. U., Møller P., Srianand R., 2006, A&A, 457, 71
- Levesque et al. (2010) Levesque E. M., Kewley L. J., Larson K. L., 2010, AJ, 139, 712
- Lowenthal et al. (1995) Lowenthal J. D., Hogan C. J., Green R. F., Woodgate B., Caulet A., Brown L., Bechtold J., 1995, ApJ, 451, 484
- Madau & Dickinson (2014) Madau P., Dickinson M., 2014, ARA&A, 52, 415
- Maseda et al. (2013) Maseda M. V., et al., 2013, ApJ, 778, L22
- Maseda et al. (2014) Maseda M. V., et al., 2014, ApJ, 791, 17
- Masters et al. (2014) Masters D., et al., 2014, ApJ, 785, 153
- Møller et al. (2002) Møller P., Warren S. J., Fall S. M., Fynbo J. U., Jakobsen P., 2002, ApJ, 574, 51
- Møller et al. (2004) Møller P., Fynbo J. P. U., Fall S. M., 2004, A&A, 422, L33
- Møller et al. (2013) Møller P., Fynbo J. P. U., Ledoux C., Nilsson K. K., 2013, MNRAS, 430, 2680
- Muzahid et al. (2012) Muzahid S., Srianand R., Bergeron J., Petitjean P., 2012, MNRAS, 421, 446
- Nestor et al. (2011) Nestor D. B., Johnson B. D., Wild V., Ménard B., Turnshek D. A., Rao S., Pettini M., 2011, MNRAS, 412, 1559
- Noterdaeme et al. (2008) Noterdaeme P., Ledoux C., Petitjean P., Srianand R., 2008, A&A, 481, 327
- Noterdaeme et al. (2009) Noterdaeme P., Petitjean P., Ledoux C., Srianand R., 2009, A&A, 505, 1087
- Noterdaeme et al. (2012a) Noterdaeme P., et al., 2012a, A&A, 540, A63
- Noterdaeme et al. (2012b) Noterdaeme P., et al., 2012b, A&A, 547, L1
- Noterdaeme et al. (2014) Noterdaeme P., Petitjean P., Pâris I., Cai Z., Finley H., Ge J., Pieri M. M., York D. G., 2014, A&A, 566, A24
- Noterdaeme et al. (2015a) Noterdaeme P., Srianand R., Rahmani H., Petitjean P., Pâris I., Ledoux C., Gupta N., López S., 2015a, A&A, 577, A24
- Noterdaeme et al. (2015b) Noterdaeme P., Petitjean P., Srianand R., 2015b, A&A, 578, L5
- Ocvirk et al. (2008) Ocvirk P., Pichon C., Teyssier R., 2008, MNRAS, 390, 1326
- Osterbrock & Ferland (2006) Osterbrock D. E., Ferland G. J., 2006, Astrophysics of gaseous nebulae and active galactic nuclei
- Pâris et al. (2014) Pâris I., et al., 2014, A&A, 563, A54
- Péroux et al. (2003) Péroux C., McMahon R. G., Storrie-Lombardi L. J., Irwin M. J., 2003, MNRAS, 346, 1103
- Petitjean et al. (1994) Petitjean P., Rauch M., Carswell R. F., 1994, A&A, 291, 29
- Petitjean et al. (2000) Petitjean P., Srianand R., Ledoux C., 2000, A&A, 364, L26
- Petitjean et al. (2006) Petitjean P., Ledoux C., Noterdaeme P., Srianand R., 2006, A&A, 456, L9
- Petitjean et al. (2008) Petitjean P., Ledoux C., Srianand R., 2008, A&A, 480, 349
- Pettini & Bowen (2001) Pettini M., Bowen D. V., 2001, ApJ, 560, 41
- Prochaska et al. (2005) Prochaska J. X., Herbert-Fort S., Wolfe A. M., 2005, ApJ, 635, 123
- Rafelski et al. (2014) Rafelski M., Neeleman M., Fumagalli M., Wolfe A. M., Prochaska J. X., 2014, ApJ, 782, L29
- Rahmani et al. (2010) Rahmani H., Srianand R., Noterdaeme P., Petitjean P., 2010, MNRAS, 409, L59
- Roche et al. (2014) Roche N., Humphrey A., Binette L., 2014, MNRAS, 443, 3795
- Samui et al. (2007) Samui S., Srianand R., Subramanian K., 2007, MNRAS, 377, 285
- Shapley et al. (2003) Shapley A. E., Steidel C. C., Pettini M., Adelberger K. L., 2003, ApJ, 588, 65
- Shibuya et al. (2015) Shibuya T., Ouchi M., Harikane Y., 2015, ApJS, 219, 15
- Shull et al. (2014) Shull J. M., Danforth C. W., Tilton E. M., 2014, ApJ, 796, 49
- Som et al. (2013) Som D., Kulkarni V. P., Meiring J., York D. G., Péroux C., Khare P., Lauroesch J. T., 2013, MNRAS, 435, 1469
- Songaila & Cowie (2010) Songaila A., Cowie L. L., 2010, ApJ, 721, 1448
- Srianand & Petitjean (2000) Srianand R., Petitjean P., 2000, A&A, 357, 414
- Srianand et al. (2005) Srianand R., Petitjean P., Ledoux C., Ferland G., Shaw G., 2005, MNRAS, 362, 549
- Srianand et al. (2012) Srianand R., Gupta N., Petitjean P., Noterdaeme P., Ledoux C., Salter C. J., Saikia D. J., 2012, MNRAS, 421, 651
- Stanway et al. (2014) Stanway E. R., Eldridge J. J., Greis S. M. L., Davies L. J. M., Wilkins S. M., Bremer M. N., 2014, MNRAS, 444, 3466
- Stasińska et al. (2015) Stasińska G., Izotov Y., Morisset C., Guseva N., 2015, A&A, 576, A83
- Steidel et al. (2014) Steidel C. C., et al., 2014, ApJ, 795, 165
- Suzuki et al. (2015) Suzuki T. L., et al., 2015, preprint, (arXiv:1505.02410)
- Trujillo et al. (2006) Trujillo I., et al., 2006, ApJ, 650, 18
- Veilleux et al. (2005) Veilleux S., Cecil G., Bland-Hawthorn J., 2005, ARA&A, 43, 769
- Vernet et al. (2011) Vernet J., et al., 2011, A&A, 536, A105
- Weingartner & Draine (2001) Weingartner J. C., Draine B. T., 2001, ApJS, 134, 263
- Wolfe & Chen (2006) Wolfe A. M., Chen H.-W., 2006, ApJ, 652, 981
- Wolfe et al. (2005) Wolfe A. M., Gawiser E., Prochaska J. X., 2005, ARA&A, 43, 861
- Wolfe et al. (2008) Wolfe A. M., Prochaska J. X., Jorgenson R. A., Rafelski M., 2008, ApJ, 681, 881
- Zafar et al. (2013) Zafar T., Péroux C., Popping A., Milliard B., Deharveng J.-M., Frank S., 2013, A&A, 556, A141
- Zanella et al. (2015) Zanella A., et al., 2015, Nature, 521, 54
- Zhu & Ménard (2013) Zhu G., Ménard B., 2013, ApJ, 770, 130
- Zwaan et al. (2005) Zwaan M. A., van der Hulst J. M., Briggs F. H., Verheijen M. A. W., Ryan-Weber E. V., 2005, MNRAS, 364, 1467
- de Barros et al. (2016) de Barros S., et al., 2016, A&A, 585, A51
Appendix A Voigt profile fits to the metal lines:


| Species | (cm-2) | (km s-1) | |
|---|---|---|---|
| 2.737478 | Fe ii | ||
| 2.737737 | Fe ii | ||
| Si ii | |||
| S ii |
| Species | (cm-2) | (km s-1) | |
|---|---|---|---|
| 2.978455 | Si ii | ||
| Fe ii | |||
| 2.977978 | Si ii | ||
| Fe ii | |||
| 2.979195 | Si ii | ||
| Fe ii | |||
| Zn ii | |||
| Cr ii | |||
| Ni ii | |||
| C ii∗ | |||
| 2.980159 | Si ii | ||
| Fe ii | |||
| Zn ii | |||
| Cr ii | |||
| Ni ii | |||
| C ii∗ | |||
| 2.980669 | Si ii | ||
| Fe ii |
| Species | (cm-2) | (km s-1) | |
|---|---|---|---|
| 3.109576 | O i | ||
| Si ii | |||
| Fe ii | |||
| N i | |||
| Ar i | |||
| C ii | |||
| 3.109672 | O i | ||
| Si ii | |||
| Fe ii | |||
| Ar i | |||
| C ii |
| Species | (cm-2) | (km s-1) | |
|---|---|---|---|
| 3.133331 | Fe ii | ||
| Si ii | |||
| C ii | |||
| O i | |||
| 3.133491 | Fe ii | ||
| Si ii | |||
| C ii | |||
| O i |
| Species | (cm-2) | (km s-1) | |
|---|---|---|---|
| 3.246272 | Fe ii | ||
| Si ii | |||
| 3.247061 | Fe ii | ||
| Si ii | |||
| 3.247724 | Fe ii | ||
| Si ii | |||
| S ii | |||
| Cr ii | |||
| Ni ii | |||
| Zn ii | |||
| 3.248624 | Fe ii | ||
| Si ii | |||
| S ii | |||
| Cr ii | |||
| Ni ii | |||
| Zn ii |