Collimation and asymmetry of the hot blast wave from the recurrent nova V745 ScoNote: To appear in the Astrophysical Journal
Abstract
The recurrent symbiotic nova V745 Sco exploded on 2014 February 6 and was observed on February 22 and 23 by the Chandra X-ray Observatory Transmission Grating Spectrometers. By that time the supersoft source phase had already ended and Chandra spectra are consistent with emission from a hot, shock-heated circumstellar medium with temperatures exceeding K. X-ray line profiles are more sharply peaked than expected for a spherically-symmetric blast wave, with a full width at zero intensity of approximately 2400 km s-1, a full width at half maximum of km s-1 and an average net blueshift of km s-1. The red wings of lines are increasingly absorbed toward longer wavelengths by material within the remnant. We conclude that the blast wave was sculpted by an aspherical circumstellar medium in which an equatorial density enhancement plays a role, as in earlier symbiotic nova explosions. Expansion of the dominant X-ray emitting material is aligned close to the plane of the sky and most consistent with an orbit seen close to face-on. Comparison of an analytical blast wave model with the X-ray spectra, Swift observations and near-infrared line widths indicates the explosion energy was approximately erg, and confirms an ejected mass of approximately . The total mass lost is an order of magnitude lower than the accreted mass required to have initiated the explosion, indicating the white dwarf is gaining mass and is a supernova Type 1a progenitor candidate.
Keywords:
shock waves — stars: individual (V745 Sco) — novae, cataclysmic variables — X-rays: binaries — X-rays:starsI INTRODUCTION
V745 Sco is a member of the exclusive class of cataclysmic variables known as recurrent symbiotic novae. Symbiotic novae are close binaries in which a white dwarf orbits within the wind or extended atmosphere of an evolved companion. Accretion onto the white dwarf from the ambient wind, or through Roche Lobe overflow from a disk, leads to a build-up of matter that reaches sufficient temperature and density to initiate a thermonuclear runaway [80, TNR;]. Recurrent novae (RNe) are cases of generally more massive white dwarfs with accretion rates approaching that required for steady surface nuclear burning [82, 79, 54, 73, 93, see, e.g.,] that engender outbursts at quasi-regular intervals of only a few years. There are only 10 RNe presently known in the Milky Way and most have evolved binary companions [70, see].
Nova explosions in symbiotic systems such as V745 Sco have been likened to mini versions of Type II supernovae [9]. A blast wave propagates through the ambient circumstellar material and red giant wind in much the same way as a core-collapse supernova blast propagates through the wind of its massive progenitor. The main difference lies in the explosion energy and ejected mass: recurrent novae (a sub-class of classical novae) are typically about times less energetic and expel – times less mass. Consequently, the blast evolves on much shorter timescales than a supernova—weeks instead of millennia [9]—and this evolution can, at least in principle, be observed in considerable detail. The scarcity of known RNe renders each outburst a valuable opportunity to study the progenitor system, the nature of the explosion and its complex interaction with its circumstellar environment.
A considerable body of evidence now points to significant structure and asymmetry in nova blast waves. Hutchings [34] discussed spectroscopic line profiles for three different nova events and deduced deviations from spherical symmetry in the ejecta distributions. VLA radio observations of the 1985 outburst of RS Oph by Hjellming et al. [33] provided some hints of deviation from sphericity that were later confirmed with VLBI observations by Taylor et al. [85]. A bipolar morphology was also indicated by both radio and optical imaging of the 2006 RS Oph outburst [56, 8, 77, 66], while Drake et al. [24] found the signature of a collimated blast in high-resolution Chandra X-ray spectra that provided a direct probe of the shock-heated plasma. Detailed multi-dimensional hydrodynamic simulations have confirmed that collimation and asymmetry arise from interaction of the explosion with circumstellar material—either an accretion disk, a companion wind, or both [90, 59, 22, 58, 62]. Ness et al. [53] also found evidence that high-inclination novae in the super-soft source (SSS) phase exhibit more soft X-ray emission lines than low-inclination systems; the lines are likely due to reprocessing by obscuration and aspherical ejecta.
The Chandra high-resolution X-ray spectrometers were deployed to observe the 2014 V745 Sco explosion and investigate the nature of the blast wave and super-soft source. As we relate below, the SSS faded so quickly that it had disappeared by the time our observations could be made. Exquisite X-ray spectra of the blast wave were obtained, however. Here, we analyze the unique constraints on the blast wave conditions and geometry afforded by the Chandra data, complemented by monitoring observations made by Swift and near-infrared Paschen line widths culled from the literature.
II V745 Sco
V745 Sco was discovered in outburst at visual magnitude 9 by Rod Stubbings at Tetoora Road Observatory, Victoria, Australia on 2014 February 6.694 UT [88]. Only two previous outbursts, in 1937 and 1989, had been recorded for this nova [25, e.g.,], although the 50 year inter-outburst interval compared with the 25 year interval separating the 1989 and 2014 outbursts support the conjecture of Schaefer [70] that an outburst was missed in the 1960s and that another would be due close to 2013. It is a very “fast” nova, evolving and fading by two and three visual magnitudes in only 6.2 and 9 days, respectively [6].
The explosion triggered observing campaigns over the entire electromagnetic spectrum, including radio [68, 36], infrared [6], optical [5, 47] X-ray [48, 7, 61, 23], hard X-ray [64, 57] and -ray [17, 18] wavelengths. Page et al. [61] present a detailed summary of the various observations.
There are several noteworthy aspects of the event from the perspective of the work presented here. Foremost are the Fermi LAT and -ray detections on 2014 February 6 and 7 (days 1 and 2 of the outburst) by Cheung et al. [17]—the review of Cheung et al. [18] notes that V745 Sco is only the sixth nova to have been detected in -rays. The rise on day 3 and fall on day 10 of the SSS phase [60, 61] was remarkably fast and among the shortest ever observed. NuSTAR observations detected X-ray emission up to 20 keV and indicated the presence of a hot plasma with an average temperature of 2.7 keV [57]. Greatly broadened optical and infrared line profiles indicating expansion velocities of more than 4000 km s-1 were observed by Anupama et al. [5] and Banerjee et al. [6], reminiscent of the 1989 outburst [25, 92, 89].
Relatively little is known about the V745 Sco stellar system because it lies toward the crowded Galactic bulge region. Duerbeck [25] classified the red giant companion as M6 III based on TiO bands, while Harrison et al. [32] inferred a spectral type of M4 III based on CO absorption features. Schaefer [70] derived an orbital period of days using optical photometry, and a distance of kpc. The period has been refuted by Mróz et al. [47], who failed to find evidence for a binary period in extensive Optical Gravitational Lensing Experiment (OGLE) data. They note that the quiescence variability of the red giant is characterized by semi-regular pulsations with periods of 136.5 and 77.4 days.
III OBSERVATIONS
V745 Sco was observed by the Chandra X-ray Observatory [91] Low Energy (LETG; Brinkman et al. 12) and High Energy (HETG; Canizares et al. 14) transmission grating spectrometers on UT 2014 February 22, and 23, with net exposure times of 45 and 39 ks, respectively. The LETG observations employed the High Resolution Camera Spectroscopy array (HRC-S) and comprised two segments of approximately 32 ks and 13 ks with start times separated by about 20 hours. The HETG observation, using the Advanced CCD Imaging Spectrometer spectroscopic detector (ACIS-S), followed on the heels of the latter. Chandra observations are illustrated in the context of the evolving X-ray light obtained by the Swift observatory [61] in Figure 1. Details of the Chandra observations are reported in Table 1.
| ObsID | Instrument | Day11Day of outburst at observation start, based on an assumed explosion initiation on the discovery date of 2014-2-06.694 UT (JD 2456695.194). | Exp. (s) | ||
|---|---|---|---|---|---|
| 15738 | LETG+HRC-S | 15.8 | 2014-02-22 12:30:19 | 2014-02-22 21:49:01 | 32236 |
| 16595 | LETG+HRC-S | 16.7 | 2014-02-23 10:20:13 | 2014-02-23 14:17:32 | 12937 |
| 15737 | HETG+ACIS-S | 16.9 | 2014-02-23 14:17:32 | 2014-02-24 02:02:51 | 39457 |
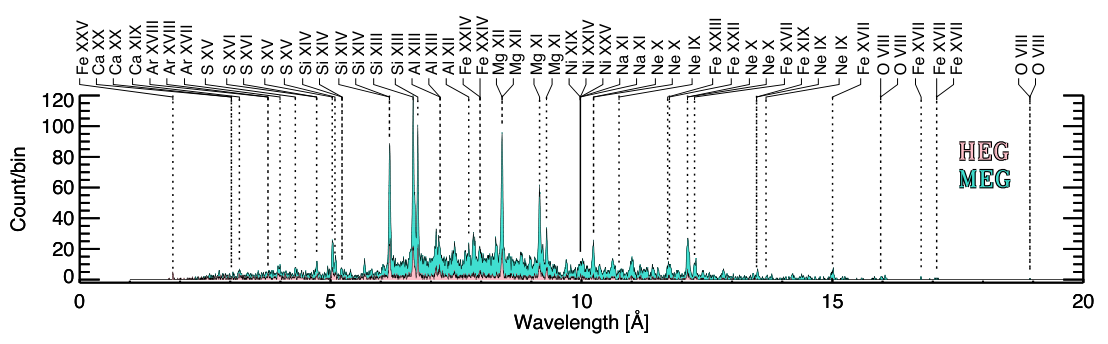
Data were processed using standard procedures11 1 http://cxc.harvard.edu/ciao/threads and Chandra calibration database version 4.6.8. The extracted HETG spectra with prominent spectral lines identified are illustrated in Figure 2.
Swift initiated observations of V745 Sco 3.7 hr after the optical discovery, using the X- ray Telescope (XRT; Burrows et al. 13) and UV/Optical Telescope (UVOT; Roming et al. 67). Data were obtained several times a day on most of the first 28 days of the outburst, and regular observations were continued at a lower cadence until the end of 2014 September. A full description of the Swift campaign, data processing and analysis has been presented by Page et al. [61]. We concentrate here on the first 40 days of observations of the blast wave emission; the reader is referred to Page et al. [61] for an analysis of the SSS phase.
IV ANALYSIS
Analysis of the Chandra spectra involved two separate approaches: a model parameter estimation method to examine the condition of the shocked material in the blast wave, and an analysis of spectral line profiles in order to investigate possible constraints on the nature and geometry of the explosion.
IV.1 Characterizing the shocked gas using model parameter estimation
IV.1.1 General approach
Parameter estimation was performed using the Sherpa fitting engine within the Chandra Interactive Analysis of Observations (CIAO; Fruscione et al. 26) software framework version 4.7. The Chandra spectra in Figure 2 show bright emission lines of cosmically-abundant elements on top of a broad continuum and bear a remarkable resemblance to those obtained of the 2006 RS Oph explosion [24, 52]. Indeed, based on the available information noted in Section II, V745 Sco is likely to be a very similar system to RS Oph. Blast wave X-ray spectra of symbiotic novae are expected to originate from the diffuse shock-heated secondary star wind, and the RS Oph blast wave proved to be well-described by optically-thin, collision-dominated plasma emission [11, 51, 24, 52]. We therefore proceeded to model the V754 Sco spectra using thermal plasma radiative loss models. As a baseline, Astrophysical Plasma Emission Code (APEC22 2 http://www.atomdb.org/) models were adopted with their default (and traditional) “solar” abundances of Anders & Grevesse [4].
Since high-resolution Chandra HETG spectra, those of V745 Sco being no exception, often comprise many bins with few counts, minimization of model deviations from the data employed the Cash statistic (Cash 16; we denote the reduced form here by ), which is valid in the Poisson regime of low numbers of counts in which approaches, relying on Gaussian uncertainties, are inapplicable. This allows the data to be analyzed without further grouping of neighboring bins, and at full spectral resolution. The HETG High Energy Grating (HEG) spectrum was fit over the range 1.5–16 Å, while fits to the Medium Energy Grating (MEG) spectrum were restricted to 2–20 Å. Both HEG and MEG spectra were fit simultaneously.
The deployment of the LETG+HRC-S sought to capture the SSS emission, which was expected to dominate the X-ray signal longward of 20 Å or so. The startling rapidity with which V745 Sco evolved meant that the SSS had already faded by the time the deployment was made. Nevertheless, the LETG data are still capable of providing an independent measure of the blast wave conditions, albeit with lower precision than the HETG observations.
LETG+HRC-S spectra are subject to higher levels of background than the HETG+ACIS-S combination, largely owing to the anti-coincidence shield being non-functional on-orbit. Parameter estimation for LETGS spectra fitting both source and background simultaneously encountered software problems. Consequently, we employed background subtraction and binning of the data to a minimum of 10 counts per bin, combined with the Gehrels [30] modification to the statistic as a goodness of fit measure. The higher background level and lower quantum efficiency of the HRC-S compared with ACIS-S, combined with the lower spectral resolution of the LETG in the wavelength range of interest, meant that the LETG data provided less stringent constraints on model parameters.
Banerjee et al. [6] discussed the evolution of the width of the Pa line over the first two weeks of the outburst, showing that on day 15 the full-width at half-maximum intensity (FWHM) still exceeded 1000 km s-1. The resolving power (FWHM) of the HEG is about 1000 at 12 Å, corresponding to 300 km s-1. The blast wave HETG spectra are therefore likely to be significantly broadened, as were those of the recurrent nova RS Oph [24]. Velocity broadening, as well as a net “redshift”, were therefore also included as free parameters.
Representative parameter estimation results together with (68.3%) confidence bounds are listed for HETG and LETG data in Tables 2 and 3, respectively. Uncertainties are based only on the statistical properties of the model and data comparisons and do not include errors resulting from instrument calibration or spectral model input data.
In order of increasing complexity, data were first matched to an absorbed isothermal model and later to more complex models that included multiple temperature plasma components and variable element abundances. In the absorbed isothermal model, the abundances of cosmically-abundant elements were allowed to vary together as a global metallicity. Absorption was first treated as a simple, single interstellar medium component represented by the column density of neutral hydrogen proxy, , and H and He ionization fractions of 0.1 and 0.01, respectively. This provides a gross and simple characterization of the bulk of the emission, although the fit was relatively poor in terms of reduced fit statistic (). Subsequent models with multiple temperature plasma components and variable element abundances also included a more realistic treatment of absorption.
IV.1.2 Absorption model
Spectral line profiles betray the presence of significant self-absorption: red wings are weakened with respect to their blue counterparts (see Section IV.3 below for further discussion). Such self-absorption was first seen in the Chandra HETG spectrum of the RS Ophiuchi blast wave [24] and arises because the red wings correspond to emission from receding plasma, located on the far side of the blast. This emission is absorbed by material within the blast wave, in addition to the interstellar medium. A single representative absorbing column density results in too much attenuation at longer wavelengths that obliterates model predictions of the weak, but still present, hydrogen-like O emission near 19 Å, even in more complex multi-thermal models (described below), and similarly renders predictions of transitions such as the prominent Fe XVII 15 Å line much weaker than observed. A more complete and accurate description of the absorption of the HETG spectrum would involve integration over the material in the line of sight to all parts of both the approaching and receding shocked plasma.
Detailed hydrodynamic simulations of the RS Oph blast [59, 90] revealed a very complex shock and ejecta structure collimated and deflected by the accretion disk and other circumstellar material, and a highly asymmetric distribution of X-ray emission. In the absence of detailed information on the V745 Sco blast wave morphology, there are few constraints on a compound absorption model. We therefore adopted a simple covering fraction varying as a power-law distribution of the column density following Norton et al. [55] and Done & Magdziarz [21], as implemented in the pwab model within Sherpa. Such an absorption model has an effective transmittance as a function of energy, , given by
| (1) |
where is the absorption cross-section as a function of energy and is a constant depending on the power-law index and the minimum and maximum column densities considered ( and ), such that the total covering fraction as a function of column density, , is normalized to 1 (see Done & Magdziarz 21 Eqn. 1).
Test fits revealed little sensitivity in terms of model fit quality to the exact minimum and maximum absorbing columns. Model fits using a single absorbing column retrieved best-fit neutral hydrogen column densities in the general range –cm-2. This is slightly higher than expected from the trend by Page et al. [61] based on observations over the first three days, suggesting that the decrease in absorption had leveled off before day 16. Values of the limiting columns in the complex absorber were based on an isothermal model fit to the data in which the limits were allowed to vary. This trial resulted in lower and upper confidence limits of and cm-2. These also straddle the range of values found from single absorber fits, and fixed values of and cm-2 were adopted in subsequent model parameter estimation.
IV.1.3 Chemical composition
The most prominent spectral lines in the HEG, MEG and short wavelength end of the LEG spectra originate from the H-like and He-like ions of the abundant metals O, Ne, Mg, Al, Si, S, Ar and Fe. In order to investigate possible deviations from a solar abundance mixture, isothermal, two-temperature and three-temperature fits were performed in which the relative abundances of these elements were allowed to vary independently. Exceptions were the abundances of Ca and Ni, which were tied to that of Fe, while the S abundance was tied to that of Ar. These abundance ties reduced the number of free model parameters for quantities that do not play an important role in the data. An isothermal model with these constraints fitted to the HEG and MEG spectra had a reduced statistic of , while a similar model fit to LEG data had .
Adding further plasma components with normalizations and temperatures free to vary, but with abundances tied between components such that one set was common to all, further improved the HETG fit to with two components and with three. Subsequent additional components resulted in only very marginal improvement in fit quality. In the case of the LETG spectrum, with a reduced statistic close to unity, fits were already statistically acceptable and adding further thermal components only resulted in marginal gains in fit quality. For a three-temperature, variable abundance model, the best-fit yielded . The best-fit three-temperature models are compared with the full fitted range of the LEG, HEG and MEG observations, binned as a visual aid to highlight deviations between model and data, in Figure 3, and with the H-like and He-like profiles of Si and Mg unbinned and at full resolution in Figure 4.
While the abundance results are suggestive of a mild metal paucity with respect to solar values, and in this respect are in good agreement with the assessment of Orio et al. [57] based on NuSTAR and Swift observations, we caution against their strict interpretation. The true abundance uncertainties can be significantly larger than the purely statistical errors owing to uncertainties and deficiencies in the plasma model, as well as in the instrument calibration (see also the discussion of the chemical composition of the RS Oph blast wave emission by Ness et al. 52). Moreover, as we note in Section IV.1.4 below, a multi-thermal solar metallicity model is not inconsistent with the data.
| Model | Parameter11Parameter units are: temperature, , in keV; emission measure , , in cm-3, where is the distance to the source; hydrogen column in cm-2; redshift expressed in the usual ratio of velocity to that of the speed of light, ; broadening velocity in km s-1. Abundances are expressed as a fraction of the solar abundances of Anders & Grevesse [4]; for element X this is equivalent to in traditional spectroscopic notation. | Best-fit value22Uncertainties correspond to (68.3%) confidence bounds. | ||
|---|---|---|---|---|
| (7.92 | ||||
| Single-temperature, | 1.135 | 0.006 | ||
| variable metallicity. | 0.46 | 0.01 | ||
| Degs. of freedom: 9395 | Redshift | ( | ||
| Red. statistic: 1.33 | Velocity | 518 | 11 | |
| 0.0775 | 0.0014 | |||
| 0.13 | ||||
| 0.603 | ||||
| 0.0328 | ||||
| 4.1 | ||||
| 0.0070 | ||||
| Three-temperature, | 1.21 | |||
| variable abundances. | 0.0390 | |||
| Degs. freedom: 9385 | O | 0.25 | ||
| Red. statistic: 1.01 | Ne | 0.64 | ||
| Mg | 0.62 | |||
| Al | 0.75 | 0.09 | ||
| Si | 0.65 | |||
| S | 0.66 | 0.04 | ||
| Fe | 0.26 | |||
| Redshift | ( | |||
| Velocity | 502 | 10 | ||
| 0.55 | ||||
| 0 | ||||
| 0.0217 | ||||
| 0.0204 | ||||
| Eight-temperature,33The eight temperatures are denoted by the subscripts to the emission measure in units of . In units of keV they are: 0.22, 0.34, 0.54, 0.86, 1.37, 2.16, 3.43, and 5.44 keV. | 0.0282 | |||
| variable metallicity | 0.0237 | |||
| Degs. freedom: 9393 | 0 | |||
| Red. statistic: 1.02 | 0 | |||
| 0.00287 | ||||
| 0.64 | ||||
| Redshift | ||||
| Velocity | 519 | |||
| Model | Parameter11Parameter units are the same as those in Table 2. | Best-fit value22Uncertainties correspond to (68.3%) confidence bounds. | ||
|---|---|---|---|---|
| (8.74 | ||||
| Single-temperature, | 0.89 | |||
| variable metallicity. | 0.1127 | |||
| Degs. of freedom: 725 | 0.35 | |||
| Red. statistic: 1.00 | Redshift | 0.0002 | ||
| Velocity | 852 | 78 | ||
| 0.73 | ||||
| 0.034 | ||||
| 1.31 | ||||
| 0.041 | ||||
| Three temperature, | 5.44 | |||
| variable abundances. | 0.0008 | |||
| Degs. freedom: 718 | O | 0.27 | ||
| Red. statistic: 1.01 | Ne | 0.69 | ||
| Mg | 0.61 | |||
| Al | 1.10 | |||
| Si | 0.64 | |||
| S | 0.47 | |||
| Fe | 0.26 | |||
| Redshift | 0.0002 | |||
| Velocity | 808 | 88 | ||
| 0.65 | ||||
| 0.005 | ||||
| 0.012 | ||||
| 0.011 | ||||
| Eight-temperature,33The eight temperatures are denoted by the subscripts to the emission measure in units of . In units of keV they are: 0.22, 0.34, 0.54, 0.86, 1.37, 2.16, 3.43, and 5.44 keV. | 0.0308 | |||
| variable metallicity | 0.0213 | |||
| Degs. freedom: 722 | 0.0047 | |||
| Red. statistic: 0.70 | 0 | |||
| 0 | ||||
| 0.74 | ||||
| Redshift | ||||
| Velocity | 895 | |||
IV.1.4 Temperature distribution
To probe the distribution of plasma temperature in the blast wave, an eight-temperature model was adopted, covering the temperature range 0.21–5.44 keV (–7.8) in bins evenly distributed in logarithmic temperature. As Tables 2 and 3 testify, the three-temperature fits, in which abundances were allowed to vary, did not indicate drastic deviations from a solar abundance mixture, except for a mild paucity of metals, at 30–70% of the solar values. For the multi-thermal model, therefore, only the global metallicity was allowed to vary. While the formal uncertainty on the model metallicity appeared to preclude the solar value, test fits with the metallicity fixed at [M/H] were found to result in only a very marginal increase in the test statistic, from to 1.03.
The best-fit emission measures as a function of temperature from the multi-thermal model are illustrated in Figure 5, together with the single-temperature fit results for comparison. Several of the eight temperature bins were found not to have a significant emission measure and only upper limits could be derived.
Cooling flow models, in which the emission measure distribution follows the inverse of the radiative loss function [49], where also investigated. Such models would be expected to give a reasonable description of the X-ray spectrum for a one-dimensional steady-state, radiatively-cooled shock, where the gas is heated to a single initial temperature. In the case of V745 Sco, and as we discuss later in Sections V and VI.1, the blast wave decelerates significantly, cools by adiabatic expansion as well as radiatively, and is likely to be more complicated than a one-dimensional model. Unfortunately, cooling flow models as currently available in fitting engines also do not provide for ready inclusion of velocity broadening of spectral lines. Nevertheless, we applied the xsvmcflow model within Sherpa, adopting the same abundance fitting strategy as employed for the three-temperature models described in Section IV.1.3. In addition to the abundances, the free parameters were maximum temperature, minimum temperature, normalization and redshift. While a superficially reasonable fit was obtained, the reduced statistic was formally unacceptable. The best-fit minimum and maximum temperatures were 0.27 and 2.14 keV, respectively, and best-fit abundances were fairly uniformly close to , with the exception of Fe, for which was obtained. While the poor statistical fit precludes reliable inference from the model, the temperature range found is very similar to the range of temperatures over which the emission measure was found to be significant from the eight-temperature model.
IV.2 Velocity shift and broadening
Fits of all models to HETG spectra, regardless of complexity, pointed to velocity broadening corresponding to a Gaussian width of approximately 510 km s-1 and a redshift of -0.00056—actually a blueshift corresponding to km s-1. Placing full weight on the three-temperature variable abundance and eight-temperature variable metallicity results, we find a velocity FWHM= km s-1, in good agreement with the Banerjee et al. [6] H I line profile results.
Unshifted and unbroadened profiles of H-like Mg and Si are also illustrated for reference in Figure 4. Owing to lower resolving power, LETG spectra carry less velocity information. At face value, both the best-fit broadening and blueshift obtained from the LETG data are significantly larger than found from the HETG. However, the HRC-S detector is known to suffer from low-level dispersion non-linearities33 3 http://cxc.harvard.edu/proposer/POG/ that render fine Doppler shift analysis questionable; we therefore do not consider the LETG velocity results further.
IV.2.1 He-like Ions
The so-called “triplets” of helium-like ions are well-known as density and temperature diagnostics for plasmas in collisional equilibrium (Gabriel & Jordan 29; see also Porquet et al. 63 for a recent review). Based on the shock velocity evolution estimated by Banerjee et al. [6, see also Section V below], the shock radius is expected to be roughly 15 AU, and the shocked circumstellar medium should have a density not much higher than cm-3. This is orders of magnitude below the lower limits of density sensitivity of the He-like Ne, Mg and Si lines, which are a few , , and cm-3, respectively [63, see, e.g.,].
The observed forbidden and intercombination lines illustrated in Figure 4 are reasonably consistent with the predicted low density limit intensities, consistent with the estimated shocked circumstellar medium density expectations noted above. At higher densities above the low density limit of sensitivity, the metastable upper level of the forbidden line is collisionally excited to at a sufficient rate to increase the intercombination line strength at the expense of the forbidden line. Similarly, the levels can be excited radiatively in the presence of a strong UV radiation field, which is lacking in the post-SSS phase of V745 Sco. We do note, though, a tendency for the forbidden line to appear slightly under-predicted by the model. The shocked circumstellar medium in the V745 Sco blast wave is in a cooling state and therefore expected to be a recombining plasma. Since this process favors the larger statistical weight of the triplet over the singlet levels during recombination cascades, the forbidden line can be enhanced relative to its strength in the pure collisional equilibrium state.
IV.3 Inference from spectral line profiles
The spectral line profiles of V745 Sco bear superficial resemblance to the profiles observed for the blast wave of the recurrent nova RS Oph (see Drake et al. 24), with an increasing apparent blueshift of line centroids going from shorter to longer wavelengths. This pattern is a signature of intrinsic absorption within the remnant that eats away the far side emission producing the red-shifted portion of the line. The effect is most striking for the H-like O VIII doublet at 18.97 Å. While the signal-to-noise ratio of this line is very low, with only a handful of photon counts, nearly all of these counts lie to the blue of the expected line centroid.
The pointed shape of spectral lines, combined with the net blueshift, even for profiles at short wavelengths relatively unaffected by the differential intrinsic absorption, indicates a highly collimated, rather than spherically-symmetric, blast. Figure 6 illustrates the profiles of the Ly transitions in H-like Si, Mg, Ne and O compared with idealized model emission profiles. The latter correspond to emission from an expanding thin spherical shell, for which we can vary the expansion velocity, the ranges of latitude that contribute to the emission, the inclination of the reference axis of the shell to the plane of the sky, and the absorbing column within the shell. These model emission profiles were convolved with the best-fit eight-temperature emission model described in Section 3 and with the instrumental profiles of the HEG and MEG grating spectrometers before scaling to match the observed peak profiles for comparison.
Square, pedestal-like spectral line profiles are sometimes observed in connection with nova explosions; such profiles result from a quasi-spherical expansion of emitting material. Line profiles of V745 Sco correspond to a full width at zero intensity (FWZI) of approximately 2400 km s-1, corresponding to a maximum expansion velocity of the X-ray emitting gas of km s-1. The observed line shapes are much more peaked than those from spherical shell-like emission with such an expansion velocity. The net blueshift, even in Si XIV that suffers minimal intrinsic absorption, is also conspicuous.
Different configurations of spherical shell sections with km s-1 were also qualitatively compared with the observed line profiles. Lacking a detailed spatial and physical emission model, no attempt was made to obtain best-fit model parameters: the profiles merely serve to demonstrate that a collimated blast model can provide a reasonable match to the data, even though they fail to match them in detail. Both ring-like (emission restricted to an equatorial belt below a specified latitude, ) and cap-like (emission restricted to one pole, above a specified ) models were found to produce profiles similar to those observed. Both require dominant emission from material expanding predominantly in the plane of the sky. In the case of ring-like emission, a match was found for an emitting region of with a system inclination (i.e. the axis of the ring inclined at relative to the sky plane). Alternatively, a spherical cap with and was also found to provide a good qualitative profile match. Two sets of line profiles corresponding to this latter model are illustrated in Figure 6; one includes the effect of intrinsic absorption within the spherical cavity while the other is unabsorbed. An equivalent neutral hydrogen column density of cm-2 within the cavity was found to provide a reasonable match to the differential absorption across the different line profiles, with, perhaps, the exception of the poorly-detected O VIII line.
IV.4 Swift XRT Observations
Swift XRT observations were analyzed following the procedure outlined by Page et al. [61]. We are mainly interested in using the Swift data to follow the temperature of the blast wave as a function of time. Model parameter estimation was undertaken using the XSPEC fitting engine, applying isothermal APEC models attenuated by a variable absorption component representing the circumstellar environment combined with a fixed interstellar absorption corresponding to a neutral hydrogen column density of cm-2. A metallicity of 0.51 times the solar abundances of Anders & Grevesse [4] was adopted, following Orio et al. [57]. Unfortunately, during the SSS phase there was insufficient signal at higher energies above that of the SSS signal with which to constrain the plasma temperature; consequently there is a gap in the Swift temperatures between days 4-12. We discuss the best-fit temperatures in Section V, below.
V ANALYTICAL BLAST WAVE MODEL
In order to glean further insights into the explosion parameters, we follow the blast evolution using an analytic model developed for supernova remnants (SNRs) by Laming & Hwang [40] and Hwang & Laming [35]. This approach implements self-similar models with an assumed ejecta density distribution comprising a uniform density core surrounded by a power-law outer envelope. The forward and reverse shock velocities are calculated as a function of time.
Assuming no differential absorption across the nova remnant, the FWHM of emission lines should be , where is the shock velocity. The thermal width of shocked ions is approximately , which is added in quadrature with , the difference in bulk velocity between the front and back portions of the shock. We take a circumstellar medium consistent with that adopted by Banerjee et al. [6], with density profile a.m.u. cm-3, where is the radial distance in parsecs. This corresponds to a pre-nova mass loss rate of about yr-1 with a terminal wind speed of km s-1. Again following Banerjee et al. [6], we take an ejected mass of , and assume an outer envelope power law index of for the ejecta [40, see]. The ejected mass combined with the early Pa line widths of about 5000 km s-1 implies an initial expansion velocity of approximately 3000 km s-1 and an explosion energy of the order of erg; we take these parameters as our reference case. Further, we explore a model with an ejected mass of , one with an explosion energy ergs, and one with a density profile, in addition to exploratory calculations with a uniform circumstellar density and yet higher ejected masses.
V.1 Comparison with Near-Infrared Line Widths
Figure 7 reproduces the data presented in Figure 3 of Banerjee et al. [6], who observed the profile of the H I Paschen emission line ( to ) between one and sixteen days after outburst. The profile is seen to be composed of broad and narrow components. The broad component, which we interpret as coming from the forward shock, declines from about 5000 km s-1 FWHM at early times to about 1500 km s-1 by day 16. The narrow component, interpreted here as coming from the reverse shock, is approximately constant with a value of about 700 km s-1. We also show four sets of curves corresponding to the different models described above. Each set comprises the curves corresponding to reverse and forward shocks. Unfortunately, no measurement uncertainties are quoted in Banerjee et al. [6]. The scatter in the measurements about smooth trends indicates that these are of the order of 10%.
None of the models are able to reproduce the exact trends of both broad and narrow line components throughout the time interval studied. In all models, the reverse shock is propagating through the ejecta core with an approximately constant velocity, as is reflected by the constant line width of the shocked ejecta shown in Figure 7. Curves corresponding to the reference case, with an explosion energy of ergs and ejected mass , give the better match to the narrow component, and also match the broad component line widths after day 8. Earlier in the evolution, near day 1, the radius of the shock wave is similar to the putative separation of the binary components in V745 Sco, and the difference in the center of the density profile due to the wind from the companion, and the center of the explosion on the white dwarf (assumed zero in the model), should be expected to lead to inaccuracies.
The model with a circumstellar density profile also provides a reasonable match to the observed broad component line widths, with small overestimates at days 1 and 2. A constant density profile greatly overestimates the line widths at early times and was not considered further. The problem with these profiles is that they lead to reverse shock speeds that are too high and the predicted narrow component widths are too broad. With , this can be fixed by adopting a very steep outer ejecta envelope, for example, although such a dependence is difficult to justify. For a constant density medium, it is just not possible to obtain a reverse shock that matches the observations.
Larger ejecta masses in the model were also examined, but these produced smaller line widths at early times, and worse agreement with observations.
V.2 Comparison with X-ray Observations
We compare the electron temperatures of the analytical models as a function of time with X-ray observations in Figure 8. There are two striking features of these comparisons. Firstly, the early-time Swift temperatures are an order of magnitude higher than predicted by any of our models—no reasonable combination of model parameters can be chosen to reach such high initial temperatures. These temperatures are also inconsistent with the early-time broad component line widths of Banerjee et al. [6]. Secondly, the later-time trend of temperature with time is extremely well-matched both by a Sedov decay law (see below) and by our models when a circumstellar density profile is adopted.
A maximum electron temperature of about K is reached in the reference erg model on days 16–17. This is lower by about a factor of 2 than the observed trend in the Swift temperatures. The Chandra temperatures are significantly lower than those derived using Swift data, highlighting the instrument-dependent systematic uncertainty involved in assigning an average temperature to what is more of a continuous distribution of temperatures. The reference model modified with an explosion energy of ergs slightly over-predicts the observed line widths in Figure 7 but provides an excellent match to the Swift temperatures.
A Sedov-type blast (instantaneous release of energy at a point; Sedov 72) into a density gradient leads to the shock wave radius, , expansion law with time . For an inverse square density law, and the shock velocity decreases as . The temperature therefore evolves with time as . This relation is also illustrated in Figure 8 and provides an excellent match to the observed temperature evolution.
The difficulties in matching simultaneously both observed spectral line widths and plasma temperatures using what are fairly simple one-dimensional models points to complicating factors in the blast that are not included in the models. We discuss these below in Section VI. Nevertheless, we consider the general agreement between our reference and erg energy models and the optical and X-ray data as confirmation that both the explosion energy of 1– erg and ejecta mass of are roughly correct.
The assessment of the shocked gas emission measure and temperature afforded by the high-quality Chandra spectra provides an additional test of our blast wave model. The best-fit single temperature plasma model from the HETG spectral analysis, which we deem more accurate than the LETG-derived parameters for the reasons noted in Section IV.1, has a temperature keV and emission measure cm-3. The uncertain distance to V745 Sco poses a potential problem for comparisons. Mróz et al. [47] discount the distance of 7.8 kpc derived by Schaefer [70] because their extensive OGLE photometry rule out the period Schaefer [70] used to constrain the red giant radius. While this is a reasonable conclusion, Schaefer [70] note that several earlier studies place the star in the Galactic Bulge giant population. Since it is unlikely that it lies behind the bulge, and the consensus distance to the Galactic center has long since converged at approximately 8 kpc [65, e.g.], 7.8 kpc remains a reasonable distance and for consistency with earlier studies we adopt it here. We then find an emission measure of cm-3.
The blast wave model density is a.m.u. cm, so the total swept up mass is
| (2) |
which gives . For the two models illustrated in Figure 7, the forward shock radius at day 17 and the time of the Chandra HETG observations is and (12.4 and 17.9 AU) for the two models, with the larger radius corresponding to the more energetic explosion. The swept up mass is then and a.m.u. The emission measure is for strong shock conditions (assuming post-shock compression by a factor of four and that the shock structure is not significantly modified by particle acceleration; Tatischeff & Hernanz 84; see also Section VI.2). The density at is and cm-3 so the emission measure is and cm-3, with the lower value coming from the higher energy model. Given the remaining uncertainties in the distance, and the fact that we are comparing a spherically-symmetric model to what we have demonstrated to be a non-spherical blast wave, we consider the predicted and observed emission measures to be in good agreement. The theoretical overestimate of the emission measure is plausibly due to our neglect of shocked plasma cooling out of the relevant temperature range.
NuSTAR observed the V745 Sco blast 10 days after discovery [57]—approximately a week before the Chandra campaign reported here. Orio et al. [57] estimated a plasma temperature keV based on the NuSTAR data alone, which is significantly higher than the value keV we obtain from isothermal fits to the HETG spectra, and is also higher than later Swift temperatures. While we find multi-thermal fits do reveal evidence for the presence of significantly hotter plasma—our three-temperature variable abundance fits resulted in only a weak hot temperature component of keV—the indication is that the bulk of the X-ray emitting plasma was significantly cooler on day 17 than on day 10.
The shocked gas cools by radiation and adiabatic expansion, with our blast wave model indicating the shocked gas cooled in about a day at post-outburst times of a day or so. The radiative cooling time is
| (3) |
where is the radiative loss per unit emission measure. We have calculated the expected radiative loss using the CHIANTI atomic database version 7.1.3 [20, 41] as implemented in the PINTofALE44 4 PINTofALE is freely available at http://hea-www.harvard.edu/PINTofALE IDL-based software suite [37] and find erg cm3 s-1 for a plasma at K with a metallicity =0.46, so that the radiative cooling time is . The adiabatic expansion cooling time is approximately , and both radiative and adiabatic cooling times increase with time as the shock radius increases and the velocity and density decrease. The adiabatic cooling time is then approximately s for a shock velocity of km s-1 around day 17. The circumstellar density is , which, for the average of our models, amounts to cm-3. Applying strong shock jump conditions as above in Equation 2, the post-shock gas density will be four times this, so that the radiative cooling time is s—the same as the adiabatic cooling time for a combined cooling time of about 12 days.
Since radiative cooling for plasma at K depends primarily on the density, the circumstellar density law and the Sedov radius dependence on time can be combined to find that the radiative cooling time scales with time as ; similarly the adiabatic cooling time scales as , such that at very late times adiabatic cooling will dominate. The NuSTAR observations occurred close to a week before the Chandra observations when the cooling time would have been about 6 days. The shocked medium observed by NuSTAR would then have cooled significantly by the time of the Chandra observations, consistent with our finding of lower temperatures from those data.
The multi-thermal eight-temperature model revealed the presence of plasma at temperatures all the way from to K. The lower temperatures result from the cooling of plasma that was shock-heated several days earlier in the history of the blast.
VI DISCUSSION
VI.1 Collimation and Asymmetry
Chandra high resolution spectroscopy of the V745 Sco explosion reveals clear evidence of a collimated blast. Line profiles are both much more pointed than the square-shaped, boxy profiles expected from a spherically-symmetric blast, and significantly blue-shifted. The FWZI of approximately 1200 km s-1 is to be compared with the smaller net blueshift of 165 km s-1; this latter figure is likely slightly biased toward larger blue shift by the differential absorption discussed in Section IV.3, although we point to Figure 4 as an illustration that this does also seem appropriate for the relatively unabsorbed Si and Mg H-like and He-like resonance lines. Combined, these characteristics point to emission from material expanding preferentially in a direction close to the plane of the sky.
As noted in Section I, there is a growing body of evidence pointing to collimation and asymmetry of nova explosions, a topic that might be considered as beginning with the detailed discussion of spectral line profiles of novae by Hutchings [34]. In addition to the radio and HST images of RS Oph [33, 85, 56, 8, 69, 77]—the most studied nova blast wave to date—observations of other novae have shown similar characteristics. Examples include infrared interferometry of V1663 Aql revealing asymmetry [42], both radio and optical HST observations of light echoes revealing an asymmetric remnant of T Pyx outbursts [76] together with optical spectroscopy suggesting bipolarity in its 2011 outburst [86, 74], radio observations of V959 Mon [19, 43] revealing bipolar structure, optical, radio and X-ray imaging observations of asymmetry in the GK Per nova remnant [10, 83], and UV spectroscopic and IR interferometric evidence of a bipolar ejection in V339 Del [75, 71].
Consideration of the speed of flame propagation of a thermonuclear runaway on the white dwarf surface at the onset of a nova explosion by Fryxell & Woosley [27] indicated a surface crossing time of about a day. Recent multidimensional hydrodynamic simulations of the explosion initiation indicate that, even if ignition is point-like at the outset, flame propagation proceeds sufficiently rapidly that the explosion development is essentially spherically symmetric [15]. The shaping and collimation of nova explosions must then result from other processes.
Sokoloski et al. [77] favored an accretion-driven, jet-like scenario over shaping by circumstellar material as an explanation for highly collimated but transient features observed in mostly thermal radio emission after the 2006 RS Oph blast. We argue instead that bipolar structure is in general a result of the circumstellar environment. This would be expected to be less collimated than the features seen by Sokoloski et al. [77]. We speculate that the narrow jet-like appearance in that case might have been the result of shock-heating of slower-moving accretion-driven jet material.
Detailed three-dimensional hydrodynamic modeling of the explosion of the recurrent nova U Sco by Drake & Orlando [22] found that bipolar structure was effectively produced by the presence of an accretion disk that acts to focus the blast along the rotation axis of the binary. In symbiotic systems, accretion might proceed with or without a disk, and the explosion can be additionally shaped by the wind of the companion. The origin of the explosion is, of course, off-set from the origin of the wind by the binary separation. The blast then traverses a range of density gradients at early times, from increasing to decreasing with the inverse square of the distance in directions toward or away from the evolved companion, respectively. Since all nova progenitors either accrete through a disk or a dense wind, nova explosions should all be either asymmetric, collimated, or both.
The geometry of the interaction of a nova with a dense companion wind was discussed by, e.g., Girard & Willson [31], Drake et al. [24], Nelson et al. [50] and Martin & Dubus [45], and simulated in detail in three dimensions for the 2006 RS Oph explosion by Walder et al. [90] and Orlando et al. [59], and in two and three dimensions for the 2010 explosion of V407 Cyg by Orlando & Drake [58] and Pan et al. [62], respectively. From line widths observed in near-infrared spectra, beginning 1.3 days after outburst discovery, Banerjee et al. [6] found the blast wave to be already evolving through a Sedov-Taylor deceleration phase. The Sedov relations for blast wave evolution noted in Section V.2 above imply that the shock proceeds much more rapidly away from the companion star () than toward it (). Until the shock overtakes the evolved companion, its resulting shape in cross-section can resemble a cardioid whose cusp is aligned along the axis joining the explosion origin on the white dwarf and the evolved companion. The much faster expansion in the direction away from the evolved companion produces a one-sided lobe which under certain circumstances might be considered jet-like.
Orlando et al. [59] confirmed that the 2006 RS Oph blast required an additional orbital plane density enhancement that was deduced from models by Walder et al. [90]. Similar deductions were made for the V407 Cyg outburst (Orlando & Drake 58, Martin & Dubus 45, Pan et al. 62). It seems likely that the V745 Sco blast would have been characterized by a similar density enhancement and we would therefore expect a bipolar structure for the forward-moving shock. Predicting the morphology of the dominant X-ray emitting plasma is less straightforward: contributions can come from shocked circumstellar medium, the shocked equatorial density enhancement, and ejecta heated in the reverse shock. Orlando et al. [59] found X-ray emission from their best-fit RS Oph explosion model to be roughly equally divided between shocked circumstellar medium and shocked ejecta on day 13.9, with the equatorial density enhancement playing a large role. In the case of V407 Cyg, X-ray emission in the Orlando & Drake [58] model was dominated by circumstellar medium plasma behind the red giant that was heated by the converging shock focussed to some extent by the wind density gradient. Again, an equatorial density enhancement was required to fully understand the observed blast wave behavior.
Our three-dimensional schematic models matching the observed line profiles suggested two possible configurations: an equatorial ring-like structure, or a one-sided polar cap. The former requires a low-inclination and the latter a high inclination system. In the absence of more detailed information on the system orbital parameters, further inference is not possible. One clue as to the binary orbit configuration might lie in the difficulty in ascertaining the period from a considerable body of photometric data [70, 47]. As noted by Mróz et al. [47], this would favor a low inclination with the orbital plane close to that of the sky for which line-of-sight orbital photometric modulation would be small, and our “ring-like” configuration. Such an emission pattern might be produced by interaction of the blast with an equatorial density enhancement. Further speculation requires exploration using detailed hydrodynamic simulations.
The shock wave evolution will not only depend on the gas distribution, but also on the state of the gas into which the shock system is running. Some initial flash ionization of the circumstellar medium is likely to have occurred at the onset of the outburst, combined with further ionization from the SSS phase. The degree of ionization is likely to follow the density distribution to some extent, with the dense, equatorial material being self-shielded and less ionized than lower density material at higher latitudes. Such effects may provide a resolution to the problem that a single one-dimensional model cannot account for both the observed temperatures and the widths of the H Pa line simultaneously. The erg explosion provided the best match to the temperatures, but overestimated the H line width. A density enhancement covering part of the blast wave surface would allow postshock recombination to proceed more quickly, and would show up much brighter in H Pa emission than a shock running into uniform density. Additionally, if as has been argued previously, this equatorial density enhancement resides principally in the plane of the sky, no Doppler shift between the forward shocked H Pa and that from the reverse shock would be expected, in agreement with the observations of Banerjee et al. [6].
VI.2 Particle acceleration?
The deduction of Banerjee et al. [6] that the blast was already in the Sedov-Taylor phase only 1.3 days after discovery has important implications for the explosion parameters. The initial stage should be characterized by an episode of free spherical expansion until sufficient circumstellar material—a mass similar to that of the ejecta—has been swept up so as to begin to impede the blast. At face value, the very short free expansion phase points to the ejected mass either being particularly small, or the circumstellar environment being particularly dense, or both. One potential complication to this straightforward interpretation is the possibility of a significant energy sink in particle acceleration that Tatischeff & Hernanz [84] posed as an explanation for a short free expansion phase in the RS Oph outburst.
The most egregious disagreement between observed and model parameters lies in the initial blast wave temperatures that are an order of magnitude higher than predicted during the first few days. Tatischeff & Hernanz [84] have pointed out that particle acceleration through the first-order Fermi process can modify the shock behavior. In particular, energy can be lost to accelerated particles that lowers the observed plasma temperature compared with that expected from the shock speed, while the post-shock compression ratio can be enhanced.
The extremely high temperatures at early times might appear to be contrary to a significant particle acceleration energy sink, as does the agreement of the secular temperature trend with our blast wave models at later times. Nevertheless, the -ray detection of the initial blast phase of V745 Sco [18] indicates that significant particle acceleration did occur. The -rays are thought to be produced either from the decay of neutral pions that arise in energetic proton collisions within the shock acceleration region, analogous to similar processes in supernovae, or from inverse Compton scattering and bremsstrahlung due to accelerated electrons [1]. The unexpected -rays found in non-symbiotic classical novae likely originate in the interaction of the blast with the immediate circumstellar environment, such as the accretion disk, with a period of a few days required from the explosion onset to engender sufficient particle acceleration to induce an observable -ray flux [2]. The -ray detection in V745 Sco coincided with the nova onset, suggesting that conditions in the immediate vicinity (in the stellar wind, equatorial density enhancement or an accretion disk) were conducive to rapid particle acceleration. The extremely rapid drop in plasma temperature between days 4 and 10 might then be the result of energy lost to accelerated particle escape.
VI.3 White dwarf mass
An estimate of the ejected mass based on the swept-up mass depends on the red giant mass loss rate, , and wind speed, . As noted in Section V, Banerjee et al. [6] adopted yr-1 and km s-1, which, together with a shock moving at km s-1 and traversing 3 AU in 1.3 days, implies a swept up mass at that time of . Since the accreted mass required to initiate a TNR, , depends on the ratio [28, 78], and varies inversely with to a power of greater than unity for , is a very sensitive function of the white dwarf mass.
Mass is lost both in the initial explosion, and in the aftermath until the end of the SSS phase as nuclear burning on the white dwarf surface at Eddington and super-Eddington luminosities drives a massive optically-thick wind. The optically-thick wind models of Kato & Hachisu [39] for high-mass white dwarfs have mass loss rates of the order of g s-1 during the SSS phase. For V745 Sco, with a SSS phase lasting about 10 days, the total mass loss is . For a very brief interval prior to SSS onset, the mass loss rate can be higher still, such that it is not unreasonable to suppose that the mass lost in the initial explosion and subsequent wind are similar, .
We compare the mass estimated to have been lost in the V745 Sco outburst with the mass required to initiate TNR assuming a critical pressure of dyn [78] in Figure 9. We adopt an upper limit of , and the white dwarf mass-radius relation of Althaus et al. [3], together with that attributed to Eggleton as used by, e.g., Truran & Livio [87]. The required accreted mass for TNR, even for white dwarf masses approaching , is about an order of magnitude higher than our estimates. This points both to the white dwarf being very close to the Chandrasekhar limit and to an inevitable net gain of mass of the order of a few from each nova cycle. A similar conclusion regarding both the stellar mass and mass gain was deduced by Kato [38] based on light curve modeling of the 1989 outburst. Banerjee et al. [6] also point to the very high initial ejection velocity as supporting evidence that the ejected mass was relatively small and the white dwarf massive, while Page et al. [61] note that the remarkably short SSS phase also points to a very high white dwarf mass.
It is tempting to use the abundance results from the model parameter estimation described in Section IV.1.3 to place constraints on the composition of the underlying white dwarf. Nova ejecta can be significantly enhanced in white dwarf material as a result of convective dredge-up during the thermonuclear runway. This is betrayed by the presence of large enhancements in the spectra of classical nova explosion remnants in the “nebular phase” of C, N and O in the case of CO white dwarfs, and also Ne in the case of ONeMg white dwarfs [44, 81]. Mason [46] points out that [Ne/O] for ONeMg novae, implying Ne enhancements relative to O by as much as fifty times the solar value. At face value, the lack of obvious Ne enhancement in the V745 Sco Chandra spectra points to a CO white dwarf. However, unlike the case of classical novae with unevolved companions, the spectra of symbiotic novae like V745 Sco are complicated by the presence of the red giant wind. The spectra analyzed here are of the early-time shocked wind system in which the ejecta may or may not contribute significant emission. Without more detailed understanding of the blast wave and its evolution it is not possible to determine the relative contributions of the shocked circumstellar medium and shocked ejecta to the X-ray spectrum. Simulations of the RS Oph blast by Orlando et al. [59] indicated that ejecta could have contributed up to half of the observed line emission. Further inference for V745 Sco must await similar detailed simulations. In the absence of strong spectral features of Ne that would signal an ONeMg white dwarf, V745 Sco would be a Type 1a supernova (SN1a) progenitor candidate.
VII CONCLUSIONS
An analysis of Chandra HETG and LETG spectra of the recurrent symbiotic nova V745 Sco obtained between 16 and 17 days after outburst reveals a picture of a blast wave collimated by the circumstellar environment into which it expanded. X-ray line profiles appear more peaked and triangular than the square-shaped profiles produced by spherical expansion. Two schematic models match the observed shapes of the line profiles: expansion of a spherical cap at high inclination or of a ring-like structure at low inclination, such that motion is preferentially in a direction close to the plane of the sky. Two deviations from spherical symmetry in the circumstellar gas are likely to have played a role, as has been inferred for previous symbiotic novae: the off-set center of the blast within the density distribution of the red giant wind; and an equatorial density enhancement.
The X-ray lines are characterized by a FWZI km s-1, a FWHM km s-1, and a net blueshift of km s-1. Longer wavelength lines showed significant absorption by the central remnant in their red wings, with no photons detected in the O VIII resonance line near 19 Å red-ward of line center.
At the time of the observations, the mean shocked plasma temperature was approximately 13 million degrees K, though plasma temperatures contributing significantly to the X-ray spectra ranged from 3-40 million degrees K. Shocked plasma was cooling equally by radiative loss and adiabatic expansion, with a cooling time of the plasma at day 17 of approximately s, or 12 days.
Comparison of an analytical blast wave model with the X-ray spectra and near-infrared H I line widths of Banerjee et al. [6] suggests the explosion energy was of the order of 1– erg, and confirms the approximate ejected mass estimated by Banerjee et al. [6] of . Confronted with the accreted mass required for TNR being an order of magnitude larger than the mass lost, we confirm earlier suggestions [38, e.g.] that V745 Sco is gaining several in each nova cycle and is a likely SN1a progenitor.
References
- [1] Abdo, A. A., Ackermann, M., Ajello, M., et al. 2010, Science, 329, 817
- [2] Ackermann, M., Ajello, M., Albert, A., et al. 2014, Science, 345, 554
- [3] Althaus, L. G., García-Berro, E., Isern, J., & Córsico, A. H. 2005, A&A, 441, 689
- [4] Anders, E., & Grevesse, N. 1989, Geochim. Cosmochim. Acta, 53, 197
- [5] Anupama, G. C., Selvakumar, G., Moorthy, V., Velu, C., & Dinakaran, N. 2014, The Astronomer’s Telegram, 5871, 1
- [6] Banerjee, D. P. K., Joshi, V., Venkataraman, V., et al. 2014, ApJ, 785, L11
- [7] Beardmore, A. P., Osborne, J. P., & Page, K. L. 2014, The Astronomer’s Telegram, 5897, 1
- [8] Bode, M. F., Harman, D. J., O’Brien, T. J., et al. 2007, ApJ, 665, L63
- [9] Bode, M. F., & Kahn, F. D. 1985, MNRAS, 217, 205
- [10] Bode, M. F., O’Brien, T. J., & Simpson, M. 2004, ApJ, 600, L63
- [11] Bode, M. F., O’Brien, T. J., Osborne, J. P., et al. 2006, ApJ, 652, 629
- [12] Brinkman, B. C., Gunsing, T., Kaastra, J. S., et al. 2000, in Proc. SPIE Vol. 4012, p. 81-90, X-Ray Optics, Instruments, and Missions III, Joachim E. Truemper; Bernd Aschenbach; Eds., 81–90
- [13] Burrows, D. N., Hill, J. E., Nousek, J. A., et al. 2005, Space Sci. Rev., 120, 165
- [14] Canizares, C. R., Huenemoerder, D. P., Davis, D. S., et al. 2000, ApJ, 539, L41
- [15] Casanova, J., José, J., García-Berro, E., Shore, S. N., & Calder, A. C. 2011, Nature, 478, 490
- [16] Cash, W. 1979, ApJ, 228, 939
- [17] Cheung, C. C., Jean, P., & Shore, S. N. 2014, The Astronomer’s Telegram, 5879, 1
- [18] Cheung, C. C., Jean, P., Shore, S. N., Grove, J. E., & Leising, M. 2015, in ICRS, Vol. 880, The 34th International Cosmic Ray Conference
- [19] Chomiuk, L., Nelson, T., Mukai, K., et al. 2014, ApJ, 788, 130
- [20] Dere, K. P., Landi, E., Mason, H. E., Monsignori Fossi, B. C., & Young, P. R. 1997, A&AS, 125, 149
- [21] Done, C., & Magdziarz, P. 1998, MNRAS, 298, 737
- [22] Drake, J. J., & Orlando, S. 2010, ApJ, 720, L195
- [23] Drake, J. J., Starrfield, S., Osborne, J.-U. N. J. P., et al. 2014, The Astronomer’s Telegram, 5920, 1
- [24] Drake, J. J., Laming, J. M., Ness, J., et al. 2009, ApJ, 691, 418
- [25] Duerbeck, H. W. 1989, The Messenger, 58, 34
- [26] Fruscione, A., McDowell, J. C., Allen, G. E., et al. 2006, in Society of Photo-Optical Instrumentation Engineers (SPIE) Conference Series, Vol. 6270, Society of Photo-Optical Instrumentation Engineers (SPIE) Conference Series, 1
- [27] Fryxell, B. A., & Woosley, S. E. 1982, ApJ, 261, 332
- [28] Fujimoto, M. Y. 1982, ApJ, 257, 752
- [29] Gabriel, A. H., & Jordan, C. 1969, MNRAS, 145, 241
- [30] Gehrels, N. 1986, ApJ, 303, 336
- [31] Girard, T., & Willson, L. A. 1987, A&A, 183, 247
- [32] Harrison, T. E., Johnson, J. J., & Spyromilio, J. 1993, AJ, 105, 320
- [33] Hjellming, R. M., van Gorkom, J. H., Seaquist, E. R., et al. 1986, ApJ, 305, L71
- [34] Hutchings, J. B. 1972, MNRAS, 158, 177
- [35] Hwang, U., & Laming, J. M. 2012, ApJ, 746, 130
- [36] Kantharia, N. G., Dutta, P., Roy, N., et al. 2015, ArXiv e-prints, arXiv:1510.02203
- [37] Kashyap, V., & Drake, J. J. 2000, Bulletin of the Astronomical Society of India, 28, 475
- [38] Kato, M. 1999, PASJ, 51, 525
- [39] Kato, M., & Hachisu, I. 1994, ApJ, 437, 802
- [40] Laming, J. M., & Hwang, U. 2003, ApJ, 597, 347
- [41] Landi, E., Young, P. R., Dere, K. P., Del Zanna, G., & Mason, H. E. 2013, ApJ, 763, 86
- [42] Lane, B. F., Retter, A., Eisner, J. A., et al. 2007, ApJ, 669, 1150
- [43] Linford, J. D., Ribeiro, V. A. R. M., Chomiuk, L., et al. 2015, ApJ, 805, 136
- [44] Livio, M., & Truran, J. W. 1994, ApJ, 425, 797
- [45] Martin, P., & Dubus, G. 2013, A&A, 551, A37
- [46] Mason, E. 2011, A&A, 532, L11
- [47] Mróz, P., Poleski, R., Udalski, A., et al. 2014, MNRAS, 443, 784
- [48] Mukai, K., Page, K. L., Osborne, J. P., & Nelson, T. 2014, The Astronomer’s Telegram, 5862, 1
- [49] Mushotzky, R. F., & Szymkowiak, A. E. 1988, in NATO Advanced Science Institutes (ASI) Series C, Vol. 229, NATO Advanced Science Institutes (ASI) Series C, ed. A. C. Fabian, 53–62
- [50] Nelson, T., Donato, D., Mukai, K., Sokoloski, J., & Chomiuk, L. 2012, ApJ, 748, 43
- [51] Nelson, T., Orio, M., Cassinelli, J. P., et al. 2008, ApJ, 673, 1067
- [52] Ness, J., Drake, J. J., Starrfield, S., et al. 2009, AJ, 137, 3414
- [53] Ness, J.-U., Osborne, J. P., Henze, M., et al. 2013, A&A, 559, A50
- [54] Nomoto, K., Saio, H., Kato, M., & Hachisu, I. 2007, ApJ, 663, 1269
- [55] Norton, A. J., Watson, M. G., & King, A. R. 1991, in Lecture Notes in Physics, Berlin Springer Verlag, Vol. 385, Iron Line Diagnostics in X-ray Sources, ed. A. Treves, G. C. Perola, & L. Stella, 155
- [56] O’Brien, T. J., Bode, M. F., Porcas, R. W., et al. 2006, Nature, 442, 279
- [57] Orio, M., Rana, V., Page, K. L., Sokoloski, J., & Harrison, F. 2015, MNRAS, 448, L35
- [58] Orlando, S., & Drake, J. J. 2012, MNRAS, 419, 2329
- [59] Orlando, S., Drake, J. J., & Laming, J. M. 2009, A&A, 493, 1049
- [60] Page, K. L., Osborne, J. P., Beardmore, A. P., Mukai, K., & Starrfield, S. 2014, The Astronomer’s Telegram, 5877, 1
- [61] Page, K. L., Osborne, J. P., Kuin, N. P. M., et al. 2015, ArXiv e-prints, arXiv:1509.04004
- [62] Pan, K.-C., Ricker, P. M., & Taam, R. E. 2015, ApJ, 806, 27
- [63] Porquet, D., Dubau, J., & Grosso, N. 2010, Space Sci. Rev., 157, 103
- [64] Rana, V., Orio, M., Sokoloski, J., & Harrison, F. 2014, The Astronomer’s Telegram, 5913, 1
- [65] Reid, M. J. 1993, ARA&A, 31, 345
- [66] Ribeiro, V. A. R. M., Bode, M. F., Darnley, M. J., et al. 2009, ApJ, 703, 1955
- [67] Roming, P. W. A., Kennedy, T. E., Mason, K. O., et al. 2005, Space Sci. Rev., 120, 95
- [68] Rupen, M. P., Mioduszewski, A. J., Chomiuk, L., et al. 2014, The Astronomer’s Telegram, 5884, 1
- [69] Rupen, M. P., Mioduszewski, A. J., & Sokoloski, J. L. 2008, ApJ, 688, 559
- [70] Schaefer, B. E. 2010, VizieR Online Data Catalog, 218, 70275
- [71] Schaefer, G. H., Brummelaar, T. T., Gies, D. R., et al. 2014, Nature, 515, 234
- [72] Sedov, L. I. 1959, Similarity and Dimensional Methods in Mechanics (Similarity and Dimensional Methods in Mechanics, New York: Academic Press, 1959)
- [73] Shen, K. J., & Bildsten, L. 2007, ApJ, 660, 1444
- [74] Shore, S. N., Schwarz, G. J., De Gennaro Aquino, I., et al. 2013, A&A, 549, A140
- [75] Skopal, A., Drechsel, H., Tarasova, T., et al. 2014, A&A, 569, A112
- [76] Sokoloski, J. L., Crotts, A. P. S., Lawrence, S., & Uthas, H. 2013, ApJ, 770, L33
- [77] Sokoloski, J. L., Rupen, M. P., & Mioduszewski, A. J. 2008, ApJ, 685, L137
- [78] Starrfield, S. 1989, in Classical Novae, ed. M. F. Bode & A. Evans, 39–60
- [79] Starrfield, S., Sparks, W. M., & Shaviv, G. 1988, ApJ, 325, L35
- [80] Starrfield, S., Sparks, W. M., & Truran, J. W. 1974, ApJ, 192, 647
- [81] Starrfield, S., Truran, J. W., Wiescher, M. C., & Sparks, W. M. 1998, MNRAS, 296, 502
- [82] Sugimoto, D., & Miyaji, S. 1981, in IAU Symposium, Vol. 93, Fundamental Problems in the Theory of Stellar Evolution, ed. D. Sugimoto, D. Q. Lamb, & D. N. Schramm, 191–206
- [83] Takei, D., Drake, J. J., Yamaguchi, H., et al. 2015, ApJ, 801, 92
- [84] Tatischeff, V., & Hernanz, M. 2007, ApJ, 663, L101
- [85] Taylor, A. R., Davis, R. J., Porcas, R. W., & Bode, M. F. 1989, MNRAS, 237, 81
- [86] Tofflemire, B. M., Orio, M., Page, K. L., et al. 2013, ApJ, 779, 22
- [87] Truran, J. W., & Livio, M. 1986, ApJ, 308, 721
- [88] Waagen, E. O. 2014, AAVSO Alert Notice, 497, 1
- [89] Wagner, R. M., & Starrfield, S. G. 2014, The Astronomer’s Telegram, 5874, 1
- [90] Walder, R., Folini, D., & Shore, S. N. 2008, A&A, 484, L9
- [91] Weisskopf, M. C., Aldcroft, T. L., Bautz, M., et al. 2003, Experimental Astronomy, 16, 1
- [92] Williams, R. E., Hamuy, M., Phillips, M. M., et al. 2003, Journal of Astronomical Data, 9, 3
- [93] Wolf, W. M., Bildsten, L., Brooks, J., & Paxton, B. 2013, ApJ, 777, 136