Discovery of periodic and alternating flares of the methanol and water masers in G107.298+5.639
Abstract
Methanol and water vapour masers are signposts of early stages of high-mass star formation but it is generally thought that due to different excitation processes they probe distinct parts of stellar environments. Here we present observations of the intermediate-mass young stellar object G107.298+5.639, revealing for the first time that 34.4 d flares of the 6.7 GHz methanol maser emission alternate with flares of individual features of the 22 GHz water maser. High angular resolution data reveal that a few components of both maser species showing periodic behaviour coincide in position and velocity and all the periodic water maser components appear in the methanol maser region of size of 360 au. The maser flares could be caused by variations in the infrared radiation field induced by cyclic accretion instabilities in a circumstellar or protobinary disc. The observations do not support either the stellar pulsations or the seed photon flux variations as the underlying mechanisms of the periodicity in the source.
Keywords:
masers – stars: formation – ISM: clouds – radio lines: ISM – stars: individual: G107.298+5.6391 Introduction
The detection of periodic (29668 d) variations of the 6.7 GHz methanol maser emission was an intriguing result from monitoring observations of high-mass young stellar objects (HMYSOs; Goedhart, Gaylard & van der Walt 2003; Goedhart, Gaylard & van der Walt 2004; Goedhart et al. 2009; Goedhart et al. 2014;Araya et al. 2010; Szymczak et al. 2011; Fujisawa et al. 2014; Maswanganye et al. 2015; Maswanganye et al. 2016; Szymczak, Wolak & Bartkiewicz 2015). The 6.7 GHz light curves of 16 periodic sources detected so far (Maswanganye et al. 2016) are quite diverse from sinusoidal like to flaring with the relative amplitude of 0.230 (Fujisawa et al. 2014; Goedhart et al. 2014). For the few sources mapped so far, the periodic behaviour is seen in individual components of the spectrum arising from a region which is only 2050 per cent of the overall maser structure (Sanna et al. 2015; Szymczak et al. 2015).
Several models have proposed that the regular and periodic behaviour of the methanol masers are related to variations in the dust temperature or in the seed photon flux. The temperature of the dust grains can be modulated by (i) periodic accretion of material from the circumbinary disc onto a protostar or accretion disc (Araya et al., 2010), (ii) rotation of hot and dense material of the spiral shock wave in the central gap of the circumbinary accretion disc (Parfenov & Sobolev, 2014) or (iii) pulsation of a HMYSO (Inayoshi et al., 2013). The flux of seed photons can be periodically enhanced in (i) a colliding-wind binary (van der Walt, 2011) or (ii) an eclipsing binary (Maswanganye et al., 2015).
Since there is no clear observational evidence to support any of these scenarios we have undertaken a search for a HMYSO that shows periodic variations in the 6.7 GHz methanol and 22 GHz water maser lines. Theoretical models suggest that the density and temperature regimes in which these maser pumps operate do not overlap (e.g. Cragg, Sobolev & Godfrey 2005; Gray et al. 2015). However, there is observational evidence for velocity and position coincidence of individual features of both masers in a few sources (e.g. Sanna et al. 2010; Bartkiewicz et al. 2011). The pumping of 6.7 GHz methanol masers is dominated by radiative excitation, whereas that of 22 GHz water masers depends on collisions with molecular hydrogen (e.g. Cragg et al. 2005; Hollenbach, Elitzur & McKee 2013).
In this Letter, we announce the discovery of anti-correlated variations of the 6.7 GHz and 22 GHz masers towards G107.298+5.639 (G107 hereafter). The source is located in the L1204/S140 molecular region which contains the dark nebula and two H ii regions. It is a deeply embedded object driving a quadrupolar outflow, classified as an intermediate-mass protostar of 370L☉ (Sanchez-Monge et al. 2008; Sanchez-Monge et al. 2010) at the distance of 760 pc (Hirota et al. 2008). Recently, a periodic (34.6 d) flaring of the 6.7 GHz methanol maser has been reported (Fujisawa et al. 2014).
2 Observations
The observations presented here are part of the ongoing maser monitoring programme of HMYSO with the Torun 32-m radio telescope (Szymczak, Wolak & Bartkiewicz, 2014). G107 was monitored in the 6.7 GHz methanol and 22 GHz water lines from 2014 July to 2015 December and from 2015 July to 2015 December, respectively. The methanol observations were usually once per day but increased to approximately eight times per day during flares and decreased to once per week during quiescent intervals with two gaps of 8 and 16 d due to schedule constraints. The water observations were usually once per day with eight gaps of 45 d. The observational setup for the methanol transition observation was the same as reported in Szymczak et al. (2014) and resulted in a spectral resolution of 0.09 km s-1 with a typical rms noise level of 0.35 Jy before 2015 May and then 0.22 Jy. The methanol flux density calibration was accurate to less than 10 per cent.
The half-power beam width of the 32-m telescope at 22 GHz is 1.7 arcmin. We used two 4096-channel correlator parts with 8 MHz bandwidth each, which provided a velocity coverage from 46 to 8 km s-1 with respect to the local standard of rest and a resolution of 0.05 km s-1. The system temperature was from 50 to 250 K depending on weather conditions and elevation and the typical rms noise level was 1520 mK. The data were calibrated by the chopper wheel method and the temperature scale of the spectra was scale derived with an accuracy of about 30 per cent.
The target was observed at 6.7 GHz with the European VLBI Network (EVN11 1 The European VLBI Network is a joint facility of independent European, African, Asian, and North American radio astronomy institutes. Scientific results from data presented in this publication are derived from the following EVN project code: ES076.) on 2015 March 16 and usable data were obtained with the following antennas: Jodrell Bank, Effelsberg, Medicina, Onsala, Torun, Westerbork and Yebes. A phase-referencing scheme was applied using J2223+6249 as phase-calibrator with a switching cycle of 195 s+105 s (maser + phase-calibrator). The target was observed for a total of 4.9 h. The bandwidth was set to 4 MHz yielding 180 km s-1 velocity coverage. Data were correlated with 0.25 s integration time and 2048 spectral channels yielding a spectral resolution of 0.09 km s-1. The data reduction followed standard procedures for calibration of spectral line observations (e.g. Bartkiewicz, Szymczak & van Langevelde 2014), using the aips package. The source 3C454.3 was used as a delay, rate, and bandpass calibrator. The phase calibrator was imaged and a flux density of 147 mJy was obtained. Self-calibration was performed on the strongest maser component and the solutions were applied to the spectral line data. The images have a typical clean beam at full width half-maximum (FWHM) of 5.783.68 mas (PA = 782) and an rms noise level of 11.5 mJy beam-1 in emission free channels. The total astrometric uncertainty of the maser components was about 3 mas according to a procedure reported in Bartkiewicz et al. (2009).
3 Results
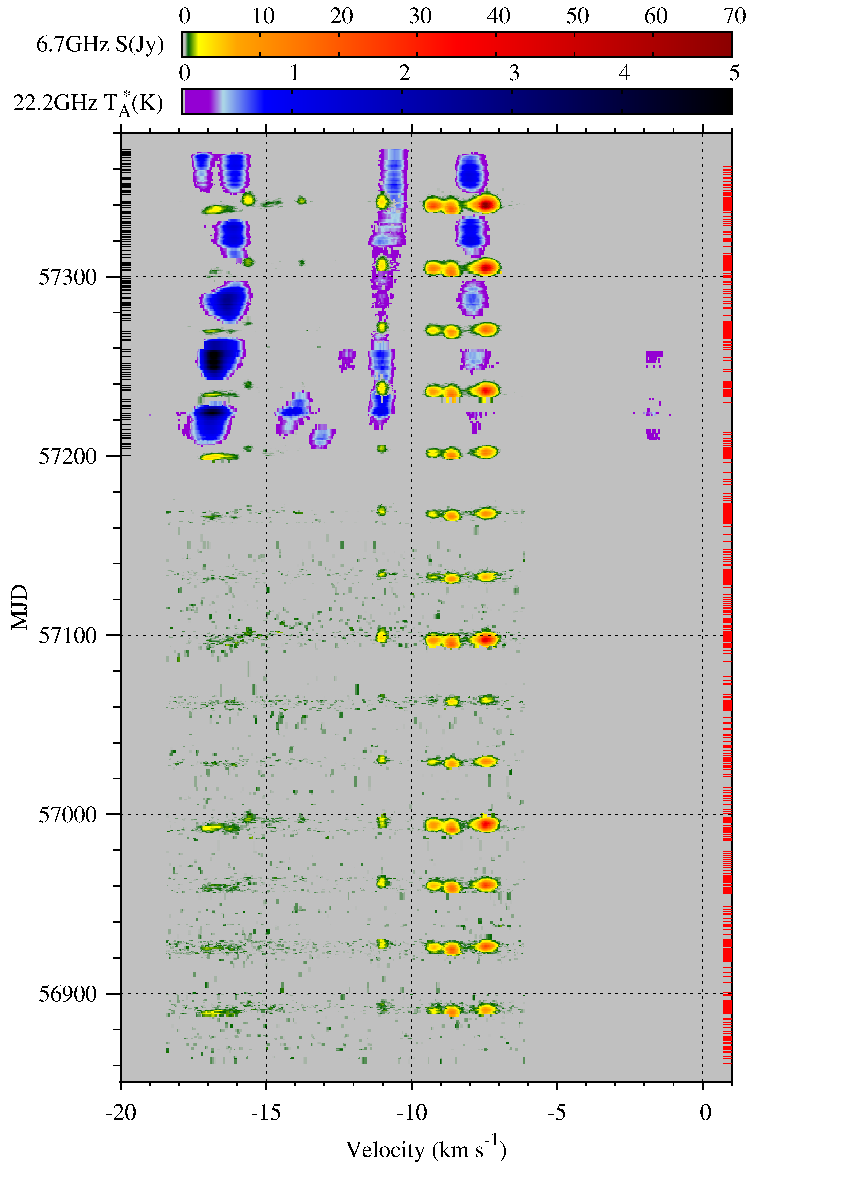
Fig. 1 shows the times series of the 6.7 and 22 GHz maser spectra. Four 6.7 GHz features in the velocity range from 11.1 to 7.0 km s-1 were detected in all 14 cycles, whereas a faint (3.5 Jy) emission of 24 features at velocities from 17.2 to 13.6 km s-1 was visible only in some cycles. We verified the periodicity using the Lomb-Scargle periodogram (Scargle 1982). A clear peak at 34.40.8 d is present in the periodograms of the features 7.4, 8.6 and 9.2 km s-1. This periodicity is quite consistent with that reported in Fujisawa et al. (2014). The intensity of the methanol line was extremely variable; the relative amplitude of the strongest feature at 7.4 km s-1 reached 120. Here, the relative amplitude is defined as ()/, where and are the maximum and minimum flux densities, respectively. The methanol emission was visible over 412 d depending on the flux density of flare peak. The flare curve was almost symmetric, i.e. the ratio of the rise time to the decay time () was about 0.930.25 for most features with the exception of the 8.6 km s-1 feature for which =0.590.17. The average time delays of the maximum flux relative the reference feature of 8.6 km s-1 are 1.70.4, 1.30.3 and 3.40.6 d for the features at 7.4, 9.2 and 11.0 km s-1, respectively. This implies a mean separation of 370 au to the line of sight and is consistent with that reported by Fujisawa et al. (2014).


| Cloud | RA | Dec | |||
|---|---|---|---|---|---|
| (mas) | (mas) | (km s-1) | (km s-1) | (mJy b-1) | |
| 1 | 1.122 | -6.729 | -7.16 | 0.25 | 2.082 |
| 2 | 0.000 | 0.000 | -7.41 | 0.16 | 7.643 |
| 3 | 0.272 | 0.991 | -7.46 | 0.59 | 1.642 |
| 4 | 5.223 | -43.979 | -7.45 | 0.29 | 0.644 |
| 5 | -15.758 | -9.481 | -8.09 | 0.24 | 0.103 |
| 6 | -103.410 | 39.431 | -8.58 | 0.28 | 2.759 |
| 7 | -32.649 | -23.026 | -8.57 | 0.24 | 0.207 |
| 8 | -46.947 | -38.466 | -9.02 | 0.26 | 0.370 |
| 9 | -57.553 | -41.464 | -9.27 | 0.22 | 0.441 |
| 10 | -392.408 | -94.329 | -10.96 | 0.23 | 0.287 |
| 11 | -334.250 | 240.653 | -16.09 | 0.55 | 0.042 |
| 12 | -324.757 | 283.323 | -16.61 | 0.60 | 0.032 |
| 13 | -262.792 | 321.424 | -16.71 | 0.28 | 0.080 |

The water emission ranged from 18.3 to 1.1 km s-1 with complex variations in the intensity of all six features. The emission of the features near 16.5 and 8.0 km s-1 significantly dimmed or even disappeared at regular intervals just when the methanol emission flares peaked at velocities that differ by less than 1.1 km s-1 (Figs 1 and 2). A similar behaviour of the water and methanol emissions was also seen at a velocity near 11.0 km s-1 before MJD 57290 (Fig. 1). These water features peaked either just in the middle between the methanol maxima or delayed by 25 d (Fig. 3). It is noteworthy that faint (0.20.25K) or moderate (0.40.8K) water maser flares near 1.7, 12.2, 13.0 and 13.9 km s-1 , seen in one or two cycles, peaked only at 0.5 phase separation from the methanol flares (Fig. 1). The relative amplitude of strong water features was up to 40. The values of varied in the range of 1.05 to 1.95 from cycle to cycle and no flare curve was observed with . The strongest water maser feature near 16.7 km s-1 drifted in radial velocity by 0.6 km s-1 over 2 months (Fig. 1). As the systemic velocity is 11.3 km s-1 (Sanchez-Monge et al. 2010) this drift can be interpreted as an effect of gas deceleration at the interface between an accelerated outflow and the molecular environment of HMYSO.
The results of the EVN observation are summarised in Table 1 which lists the following parameters of the methanol maser clouds with Gaussian velocity profiles: relative coordinates, peak velocity (), line width at half-maximum (FWHM) and flux density (). The term of cloud is defined as in Bartkiewicz et al. (2014).
The 13 methanol maser clouds detected in G107 are mainly grouped in two clusters separated by 400 mas in the south-east (SE)north-west (NW) direction (Fig. 4). The higher velocity emission (9.5 km s-1), i.e. redshifted with respect to the systemic velocity is distributed within the SE cluster (clouds 19) of size 14070 mas. The peak brightness temperature () of maser components in this cluster ranges from K to K. Weak emission (clouds 1113) at lower velocity (15.8 km s-1) from the NW cluster has an arc-like morphology of about 70 mas in extent. Their components have K. Both maser clusters containing a total of 12 clouds are oriented along an axis of position angle of 43° that agrees perfectly with the position angle of the major axis of large-scale (20″) outflow B traced by CO lines (Palau et al. 2011). The isolated methanol cloud 10 near 11.0 km s-1 is located 360 mas westward from the SE cluster and its is K. It lies very close to the axis of outflow A seen in CO lines (Palau et al. 2011).
In Fig. 4 the map of methanol maser clouds is superimposed on the 22 GHz water maser distribution observed from 2006 November to 2007 December with VLBI Exploration of Radio Astrometry (VERA) by Hirota et al. (2008) (their tables 1 and 2). The position of the 1.3 mm continuum emission is showed with error bars (Palau et al. 2011) and the directions of molecular outflows (Palau et al. 2013) are marked. The water masers in G107 are distributed in four clusters from a roughly circular region of size 300 mas (Hirota et al. 2008). The southern cluster of water emission with velocities from 8.8 to 8.2 km s-1 lies 95 mas north to 8.6 km s-1 methanol emission (cloud 6 in Table 1). Their intensities vary in opposite way (Fig. 3). The water masers in the velocity range from 18.1 to 16.4 km s-1 detected in the western cluster of arc-like shape are displaced by only 30 mas from the methanol maser arc-like structure at velocities from 16.7 to 16.1 km s-1 (clouds 1113 in Table 1). We note that the astrometric uncertainties of water and methanol maser positions are 0.1 mas and 3 mas, respectively, so that part of this displacement can be affected by a proper motion because we compare the data sets at two epochs spanned 8 yr. Simultaneous observations of both lines at high angular resolution will be needed to be more definitive. We preliminary conclude that these water and methanol masers coincide within 20 au for the assumed distance of 764 pc and exhibit alternating flares. The region of co-existence of the two masers is located 140 pc away from the central source of infrared emission. The water emission at velocities from 3.6 to 3.2 km s-1 from the western compact (30 mas) cluster was not detected during our monitoring. Three features of water maser at velocities from 14.3 to 9.7 km s-1, which appeared in two cycles may come from the NW elongated (120 mas) cluster imaged by Hirota et al. (2008).
4 Discussion
Our monitoring observations provided the first evidence that G107 alternates cyclically between the 6.7 GHz methanol maser emission state and the 22 GHz water maser state with a period of 34.4 d. The detectable methanol emission lasts only about 20 per cent of the period when the water emission drops below the detection level. The periodic features of both maser lines of G107 coincide within less that 1.1 km s-1 and at least some clouds of both maser species are in the same volume of molecular gas of size 3080 au. Similarly, the co-existence of features of both masers in regions of size 100300 au is seen for a few objects (e.g. Sanna et al. 2010, a few spots of cluster C in their fig. 3; Bartkiewicz et al. 2011) albeit many interferometric observations demonstrated that the methanol and water masers arise from different parts of the HMYSO environments.
It is generally accepted that the 22 GHz water transition is collisionally pumped in the cooling post-shock gas (Elitzur, Hollenbach & McKee 1989; Hollenbach et al. 2013), while the 6.7 GHz methanol transition is pumped by mid-infrared photons (Cragg et al. 2005). The 22 GHz transition is inverted over a broad range of physical conditions with a kinetic temperature () from 200 to 2000 K, number density of to cm-3 and fractional abundance higher than (e.g. Yates, Field & Gray 1997; Hollenbach et al. 2013; Gray et al. 2015). The 22 GHz maser gain weakly depends on dust temperature () lower than 100 K, but it is reduced by an order of magnitude for = 300K and the pumping is most efficient when Tk (Yates et al. 1997). Recently published models confirm this trend; the lowest inversion of the 22 GHz transition occurs for 500K (Gray et al. 2015).
The 6.7 GHz maser transition is radiatively pumped over a broad range of the number density ( cm-3) at methanol fractional abundance greater than . The brightness temperature increases rapidly for about 120 K and then is nearly constant up to =500 K (Cragg et al. 2005). It slightly drops with the gas temperature increase from 30 to 250 K. The 6.7 GHz emission diminishes when approaches or exceeds .
It is apparent from the above modelled ranges of the physical parameters that the 6.7 GHz methanol and 22 GHz water masers can co-exist in the same regions of G107 for a narrow range of gas density of cm-3 and kinetic temperature of K. Note that this upper limit of is poorly set as higher values were not investigated. However, one expects that for higher , the rotational levels are quickly thermalized and the methanol maser is quenched. No mechanism is known which produces changes of gas density and methanol abundance by an order of magnitude over a region of size 300 au on time-scales of 1 week. It seems that only the dust temperature can react sufficiently fast to the variations of the central object radiation and controls the methanol and water maser intensities. Since the pumping processes are competitive, a pulse of the strong infrared radiation quenches collisionally pumped 22 GHz water transition and enhances the radiatively pumped 6.7 GHz methanol transition.
Previous observations of G107 (Sanchez-Monge et al. 2008; Sanchez-Monge et al. 2010; Palau et al. 2011; Palau et al. 2013) suggest that the masers are excited by a deeply embedded young stellar object of about 45M☉ and a bolometric luminosity of 370L☉. This newly born star drives a quadrupolar outflow of dynamical age of about 1200 yr and a faint ultracompact H ii region (0.01 pc) with characteristics typical for a Class 0 protostar of spectral type B3. The emission of complex molecules probably traces a rotating disc of size 300 au. The gas temperature derived from the thermal methanol lines is about 100150 K.
Inayoshi et al. (2013) have proposed that the observed maser flares follow the luminosity variations of HMYSOs which are pulsationally unstable when growing under rapid mass accretion with rates M☉ yr-1. For the observed period of 34.4 d their models give a luminosity 40 times higher than that inferred from observations of G107 (Sanchez-Monge et al. 2010). Thus we conclude that this mechanism is an unlikely explanation for the periodic maser behaviour.
There is a growing number of embedded Class 0 protostars only detectable at infrared wavelengths in which the cyclic variability (Hodapp & Chini 2015; Safron et al. 2015) can be related to accretion instabilities developed by interactions between the stellar magnetosphere and the accretion disc (D’Angelo & Spruit 2012). In addition to the episodic changes in luminosity on time-scales of a few years, this mechanism could invoke short period (30 d) modulations with amplitude of 12 mag. For instance an embedded outflow source IRS 7 in the L1634 molecular cloud shows periodic flares with a period of 37 d and amplitude of about 2 mag in the band (Safron et al. 2015). It spends about half the period in a quiescent state that is comparable to that observed in the archetypal periodic source G9.62+0.20E (van der Walt et al. 2016) but is much shorter than in G107. Nevertheless this scenario can be viable because in addition to a well defined periodicity in G107 we observed significant modulations of the maser emission peaks which can be induced by accretion rate variations on longer time-scales.
Araya et al. (2010) have postulated that the maser gain follows the periodic accretion instabilities induced in a protobinary system. This mechanism of binary orbit triggered accretion rate (Artymowicz & Lubow 1996) modelled for the 6.7 GHz maser line by Parfenov & Sobolev (2014) predicts that the illumination of the disc by the bow shock hot material led to the variation of the dust temperature in the disc and regulates the maser brightness with the orbital phase. The detailed results of this modelling are questioned (van der Walt et al. 2016) but this scenario may be an alternative explanation of the maser behaviour in G107. Using the theoretical values from Artymowicz & Lubow (1996) we found the observed 6.7 GHz flare curve similar to the accretion rate curve for a 4 and 3M☉ binary with eccentricity of 0.6, a period of 0.09 yr and a semi-major axis of 0.4 au. Therefore, it seems that the orbital characteristics of a hypothetical binary system in G107 may be similar to those suggested for short (29.5 d) period source G12.89+0.49 (Goedhart et al. 2009) and very different from longer (200 d) period masers such as G9.62+0.20E (van der Walt, Goedhart & Gaylard 2009). High angular resolution data of G107 (e.g. Sanchez-Monge et al. 2010; Palau et al. 2011) do not provide evidence for such a binary (Sanchez-Monge et al. 2010; Palau et al. 2011).
Our observations do not support the hypothesis that the maser flares in G107 are due to variations in the free-free background seed photon flux produced by a colliding-wind binary (van der Walt 2011; van der Walt et al. 2016) or an eclipsing binary (Maswanganye et al. 2015). Changes in the continuum emission of the ultracompact H ii with a spectral index of 0.5 (Sanchez-Monge et al. 2008) should result in correlated variations of the water and methanol maser intensities.
Acknowledgements
We thank the Torun CfA staff and the students for assistance with the observations. We are grateful to Eric Gerard for reading and useful comments on the manuscript. This research has made use of the SIMBAD data base, operated at CDS (Strasbourg, France) and NASA’s Astrophysics Data System Bibliographic Services.
References
- Araya et al. (2010) Araya E.D., Hofner, P., Goss, W.M., Kurtz S., Richards A.M.S., Linz H., Olmi L., Sewilo M., 2010, ApJ, 717, L133
- Artymowicz & Lubow (1996) Artymowicz P., Lubow S.H., 1996, ApJ, 467, L77
- Bartkiewicz et al. (2009) Bartkiewicz A., Szymczak M., van Langevelde H.J., Richards A.M.S., Pihlstr om Y.M., 2009, A&A, 502, 155
- Bartkiewicz et al. (2011) Bartkiewicz A., Szymczak M., Pihlström Y.M., van Langevelde H.J., Brunthaler A., Reid M.J., 2011, A&A, 525, A120
- Bartkiewicz et al. (2014) Bartkiewicz A., Szymczak M., van Langevelde H.J., 2014, A&A, 564, A110
- Cragg et al. (2005) Cragg D.M., Sobolev A.M., Godfrey P.D., 2005, MNRAS, 360, 533
- D’Angelo & Spruit (2012) D’Angelo C.R., Spruit H.C., 2012, MNRAS, 420, 416
- Elitzur et al. (1989) Elitzur M., Hollenbach D.J., McKee C.F., 1989, ApJ, 346, 983
- Fujisawa et al. (2014) Fujisawa K. et al., 2014, PASJ, 66, 78
- Goedhart et al. (2003) Goedhart S., Gaylard M.J., van der Walt D.J., 2003, MNRAS, 339, L33
- Goedhart et al. (2004) Goedhart S., Gaylard M.J., van der Walt D.J., 2004, MNRAS, 355, 553
- Goedhart et al. (2009) Goedhart S., Langa M.C., Gaylard M.J., van der Walt D.J., 2009, MNRAS, 398, 995
- Goedhart et al. (2014) Goedhart S., Maswanganye J.P., Gaylard M.J. van der Walt D.J., 2014, MNRAS, 437, 1808
- Gray et al. (2015) Gray M.D., Baudry A., Richards A.M.S., Humphreys E.M.L., Sobolev A.M., Yates J.A., 2016, MNRAS, 456, 374
- Hirota et al. (2008) Hirota T. et al., 2008, PASJ, 60, 961
- Hodapp & Chini (2015) Hodapp K.W., Chini R., 2015, ApJ, 813, 107
- Hollenbach et al. (2013) Hollenbach D., Elitzur M., McKee C.F., 2013, ApJ, 773, 70
- Inayoshi et al. (2013) Inayoshi K., Sugiyama K., Hosokawa T., Motogi K., Tanaka K.E.I., 2013, ApJ, 769, L20
- Maswanganye et al. (2015) Maswanganye, J. P.; Gaylard, M. J.; Goedhart, S.; Walt, D. J. van der; Booth, R. S., 2015, MNRAS, 446, 2730
- Maswanganye et al. (2016) Maswanganye, J. P.; van der Walt, D. J.; Goedhart, S.; Gaylard, M. J., 2016, MNRAS, 456, 4335
- Palau et al. (2011) Palau A. et al., 2011, ApJ, 743, L32
- Palau et al. (2013) Palau A. et al., 2013, ApJ, 762, 120
- Parfenov & Sobolev (2014) Parfenov S.Yu., Sobolev A.M., 2014, MNRAS, 444, 620
- Safron et al. (2015) Safron E.J., et al., 2015, ApJ, 800, L5
- Sanchez-Monge et al. (2008) Sanchez-Monge A., Palau A. Estalella R., Beltran M.T., Girart J.M., 2008, A&A, 485, 497
- Sanchez-Monge et al. (2010) Sanchez-Monge A., Palau A. Estalella R., Kurtz S., Zhang Q., Di Francesco J., Shepherd D., 2010, ApJ, 721,L107
- Sanna et al. (2010) Sanna A., Moscadelli L., Cesaroni R., Tarchi A., Furuya R.S., Goddi C., 2010, A&A, 517, A78
- Sanna et al. (2015) Sanna A., et al., 2015, ApJ, 804, L2
- Scargle (1982) Scargle J.D., 1982, ApJ, 263, 835
- Szymczak et al. (2011) Szymczak M., Wolak P., Bartkiewicz A., van Langevelde H.J., 2011, A&A, 531, L3
- Szymczak et al. (2014) Szymczak M., Wolak P., Bartkiewicz A., 2014, MNRAS, 439, 407
- Szymczak et al. (2015) Szymczak M., Wolak P., Bartkiewicz A., 2015, MNRAS, 448, 2284
- van der Walt (2011) van der Walt D.J., 2011, AJ, 141, 152
- van der Walt et al. (2009) van der Walt D.J., Goedhart S., Gaylard M.J., 2009, MNRAS, 398, 961
- van der Walt et al. (2016) van der Walt D.J., Maswanganye J.M., Etoka S., Goedhart S., van den Heever S.P., 2016, 588, A47
- Yates et al. (1997) Yates J.A., Field D., Gray M.D., 1997, MNRAS, 285, 303