Subaru high- exploration of low-luminosity quasars (SHELLQs).
I.
Discovery of 15 quasars and bright galaxies at †‡
Abstract
We report the discovery of 15 quasars and bright galaxies at . This is the initial result from the Subaru High- Exploration of Low-Luminosity Quasars (SHELLQs) project, which exploits the exquisite multiband imaging data produced by the Subaru Hyper Suprime-Cam (HSC) Strategic Program survey. The candidate selection is performed by combining several photometric approaches including a Bayesian probabilistic algorithm to reject stars and dwarfs. The spectroscopic identification was carried out with the Gran Telescopio Canarias and the Subaru Telescope for the first 80 deg2 of the survey footprint. The success rate of our photometric selection is quite high, approaching 100 % at the brighter magnitudes ( mag). Our selection also recovered all the known high- quasars on the HSC images. Among the 15 discovered objects, six are likely quasars, while the other six with interstellar absorption lines and in some cases narrow emission lines are likely bright Lyman-break galaxies. The remaining three objects have weak continua and very strong and narrow Ly lines, which may be excited by ultraviolet light from both young stars and quasars. These results indicate that we are starting to see the steep rise of the luminosity function of galaxies, compared with that of quasars, at magnitudes fainter than mag or mag. Follow-up studies of the discovered objects as well as further survey observations are ongoing.
Subject headings
dark ages, reionization, first stars — galaxies: active — galaxies: high-redshift — intergalactic medium — quasars: general — quasars: supermassive black holesI. Introduction
The era from the birth of the first stars to cosmic reionization is one of the key subjects in astronomy and astrophysics today. While the formation of the first stars is observationally out of reach at present, the epoch of reionization is being explored with several different approaches. The latest measurements of the cosmic microwave background (CMB) by the Planck space mission suggest a reionization optical depth of , which implies that the midpoint of reionization occurred between and 8.8 [65]. This value is marginally consistent with the rapid decline of the H I neutral fraction of the intergalactic medium (IGM) from to , inferred from the evolving Ly luminosity function of galaxies [63, 64, 49, 6, 13, e.g.,]. The Universe is in the final phase of reionization at , as suggested by the small but non-zero H I transmission fraction of the IGM implied by the Gunn & Peterson [33, GP hereafter] troughs of luminous high- quasars [17].
The main source of the ultraviolet (UV) photons that caused the reionization of the Universe is still under debate. It has been argued that star-forming galaxies observed in deep surveys are not able to produce a sufficient number of photons to sustain reionization [69, 71, e.g.,], while the revised Planck results with later reionization than previously thought may alleviate this problem [70, e.g.,]. Active galactic nuclei (AGNs) have been studied as a possible additional source of ionizing photons [51, 24, 32, 27, 52, e.g.,], but the results are still controversial, largely due to the lack of knowledge about the numbers of faint quasars and AGNs residing in the reionization era.
High- quasars are also a key population to understanding the formation and evolution of supermassive black holes (SMBHs). If the assembly of an SMBH is predominantly via gas accretion onto a seed black hole with mass , then the time needed to grow to the mass is
where Gyr is the Eddington timescale, is the mean molecular weight per electron, is the radiative efficiency, and is the Eddington ratio [74, 53]; here we assume that is constant in time. We adopt , , and to derive the second line of the equation. For example, a seed with will take 0.7 Gyr to form a quasar with . Because this timescale is comparable to the cosmic time that elapsed between and , the SMBH mass function at conveys critical information about the mass distribution of the seed black holes and the mode of subsequent growth, including super-Eddington accretion [46]. Indeed, recent discoveries of the luminous quasars ULAS J11200641 with at [60] and SDSS J01002802 with at [96] have made a significant impact on such models [85, 23, 53, e.g.,].
Furthermore, high- quasars might be a signpost of galaxies and high density peaks in the dark matter distribution in the early Universe. The stellar and gaseous properties in and around the host galaxies can be studied in the optical/infrared [44, 30, 31, 89, e.g.,] or at sub-mm/radio wavelengths [55, 86, 82, 84, 87, 95, 88, e.g.,], giving a unique probe of galaxies in the reionization era. The chemical enrichment, and thus the preceding star formation history, can be measured with strong metal emission lines arising from ionized gas around the quasar nuclei [39, 15, 16, e.g.,]. On the whole, no or little chemical evolution of quasars has been observed from to the local Universe. A good example of this is ULAS J11200641, whose emission-line and continuum spectrum is strikingly similar to those of the local quasars except for the deep GP trough.
In the last two decades there has been great progress in the quest for high- quasars.11 1 Hereafter, “high-” denotes , where quasars are observed as -band dropouts in the Sloan Digital Sky Survey (SDSS) filter system [25]. The SDSS [97] provided the first opportunity to search for high- quasars over wide fields ( deg2), resulting in several tens of objects published to date [22, 19, 21, 18, 20, 36, 37, 38]. The Canada–France High- Quasar Survey [90, 91, 94, 92, 93, CFHQS;] explored fainter magnitudes than the SDSS and found a few tens of new quasars, including one very faint object (CFHQS J02160455; mag at ) discovered in the Subaru XMM-Newton Deep Survey [26] area. However, these optical surveys are not sensitive to redshifts beyond , where quasars become almost invisible at observed wavelengths m due to strong IGM absorption. The first quasar discovered at was ULAS J11200641 mentioned above, which was selected from near-infrared (NIR) data of the United Kingdom Infrared Telescope (UKIRT) Infrared Deep Sky Survey [50, UKIDSS;].
With the advent of the Visible and Infrared Survey Telescope for Astronomy (VISTA) Kilo-degree Infrared Galaxy (VIKING) survey, more quasars have been discovered in recent years [81, 83]. New optical wide-field surveys such as the Panoramic Survey Telescope & Rapid Response System 1 [45, Pan-STARRS1;] 3 survey and the Dark Energy Survey [14] are equipped with a -band filter centered at 9500 – 10000 Å, and are starting to deliver many more quasars at [4, 67]. In addition, there are various smaller projects which have succeeded in identifying high- quasars [29, 9, 43, 47, e.g.,]. In total, the above surveys have identified about a hundred high- quasars published to date. Most of the quasars are located at and mag, while the higher redshifts and fainter magnitudes are still poorly explored. The known bright high- quasars must be just the tip of the iceberg predominantly composed of faint quasars and AGNs, which may be a significant contributor to reionization, and may represent the more typical mode of SMBH growth in the early Universe.
This paper describes our ongoing project, SHELLQs (Subaru High- Exploration of Low-Luminosity Quasars), which is the first 1000 deg2 class survey for high- quasars with a 8 m class telescope. The project exploits multiband photometry data produced by the Subaru Hyper Suprime-Cam (HSC) Subaru Strategic Program (SSP) survey. We present the results of the initial follow-up spectroscopy of photometric candidates, performed in the 2015 Fall and 2016 Spring semesters, which delivered 15 high- objects including both quasars and bright galaxies. This paper is organized as follows. We introduce the Subaru HSC-SSP survey in §2. The details of the photometric candidate selection are presented in §3. The spectroscopic follow-up observations are described in §4. The quasars and galaxies we have discovered are presented and discussed in §5. The summary appears in §6. We adopt the cosmological parameters = 70 km s-1 Mpc-1, = 0.3, and = 0.7. All magnitudes in the optical and NIR bands are presented in the AB system [61]. Magnitudes refer to point spread function (PSF) magnitudes (see §2) unless otherwise noted.
II. The Subaru HSC-SSP Survey
The Subaru HSC-SSP survey (M. Takada et al. 2016, in preparation) is a large collaborative project with contributions from researchers in Japan, Taiwan, and Princeton University. The project started in early 2014, and will include 300 nights until around 2019. It uses the HSC [57, S. Miyazaki et al. 2016, in preparation], a wide-field camera newly installed on the Subaru 8.2 m telescope on the summit of Maunakea. HSC is equipped with 116 2K 4K Hamamatsu fully depleted CCDs, of which 104 CCDs are used to obtain science data. The pixel scale is 0″.17. The camera has a nearly circular field of view of 1∘.5 diameter, which enables it to image 1.77 deg2 of the sky in a single shot. Five broad-band filters (, , , , and ) and several narrow-band filters are currently available.
The HSC-SSP survey has three layers with different combinations of area and depth. The Wide layer aims to observe 1400 deg2 mostly along the celestial equator through the five broad-band filters. The present paper is based on this Wide-layer data. The total exposure times range from 10 minutes in the -, -bands to 20 minutes in the -, -, and -bands, divided into individual exposures of 3 minutes each. The target 5 limiting magnitudes are (, , , , ) = (26.5, 26.1, 25.9, 25.1, 24.4) mag measured in 2″.0 apertures. The Deep and Ultra-Deep layers observe 27 and 3.5 deg2, respectively, within and around popular deep survey fields. Five broad-band filters and four narrow-band filters are used, aiming to reach the 5 limiting depth of mag (Deep) or mag (Ultra-Deep).
The SHELLQs project exploits the exquisite HSC survey data to search for low-luminosity quasars at high redshift. Assuming the quasar luminosity function at presented by Willott et al. [93], the expected numbers of newly identified quasars in the Wide layer are 500 with mag at and 100 with mag at . The former magnitude limit corresponds to mag for a typical quasar spectral energy distribution (SED), thus allowing us to explore 2 mag lower luminosity than any previous wide-field survey at [37, e.g.,]. Our filter set is sensitive to quasars with redshifts up to (i.e., beyond the current quasar redshift record). However, the detection capability sharply drops at where the GP trough comes into the -band, hence the survey is limited to intrinsically very luminous objects at those redshifts. The deep optical data produced by the HSC survey will also provide opportunities to explore even higher redshifts when combined with wide and deep NIR surveys.
This paper describes the results from the early HSC survey data taken before 2015 August. It covers roughly 80 deg2 in the five broad bands in the Wide layer, with a median seeing of 0″.6 – 0″.8. Data reduction was performed with the dedicated pipeline hscPipe (version 3.8.5; J. Bosch et al. 2016, in preparation) derived from the Large Synoptic Survey Telescope (LSST) software pipeline [35, 3, 41], for all the standard procedures including bias subtraction, flat fielding with dome flats, stacking, astrometric and photometric calibrations, and source detection and measurements. The astrometric and photometric calibrations are tied to the Pan-STARRS1 system [72, 78, 54]. We utilize forced photometry, which allows for flux measurements in all the five bands with a consistent aperture defined in a reference band. The reference band is by default and is switched to () for extremely red sources with no detection in the () and bluer bands. We use the PSF magnitude (, or simply ) and the cModel magnitude (), which are measured by fitting the PSF models and two-component, PSF-convolved galaxy models to the source profile, respectively [1]. We measure fluxes and colors of sources with , while the source extendedness is evaluated with . All the magnitudes are corrected for Galactic extinction [73].
We performed a rough assessment of the completeness limits achieved in the early Wide survey as follows. In each subregion of the sky with an approximate size of 12′ 12′, we select every source whose processing flags indicate clean photometry, and measure the number counts . It typically follows a straight line in the – log plane at bright magnitudes, then peaks at . We fit a straight line to the – log relation at , and define the 50 % completeness magnitude at the point where falls to half of . The resultant completeness magnitudes averaged over all the fields are (26.5, 26.3, 26.4, 25.5, 24.7) mag in the (, , , , )-band, respectively, with a typical field-to-field variation of 0.3 mag. The spatial pattern of the above estimates agrees with that of the seeing, in such a way that poor seeing is accompanied by worse-than-average depth. These completeness magnitudes are roughly 0.3 mag fainter than the target limiting magnitudes of the survey mentioned above, which is at least partly because of the differences in the adopted magnitudes (PSF magnitudes vs. 2″.0-aperture magnitudes) and in the definitions of the depths (50% completeness vs. 5 detection).
Our project also benefits from archival NIR data from UKIDSS and VIKING. The UKIDSS is a multi-tiered imaging survey using WFCAM, a wide-field camera mounted on the UKIRT 3.8 m telescope [50]. The widest Large Area Survey covers most of the HSC survey footprint, with target 5 limiting magnitudes of (, , , ) = (20.9, 20.4, 20.0, 20.1) mag measured in 2″.0 apertures. The VIKING is one of the public surveys of the European Southern Observatory with the VISTA 4.1 m telescope. This project aims to observe 1500 deg2 of the sky, with target 5 limiting magnitudes of (, , , , ) = (23.1, 22.3, 22.1, 21.5, 21.2) mag measured in 2″.0 apertures. Roughly half of the HSC survey footprint will be covered by the VIKING at its completion. The present work uses the data from the UKIDSS data release 10 and the VIKING data release 4.
III. Photometric Candidate Selection
High- quasars are characterized by extremely red optical colors caused by strong IGM absorption blueward of Ly. This is demonstrated in Figure 1, which presents and colors of model quasars and other populations in the HSC passband system. There are three major sources of astrophysical contamination to the photometric selection of quasars. The first is Galactic brown dwarfs, which have been the most serious contaminants in past surveys because of their very red colors and point-like appearance. The second is red galaxies at , whose 4000 Å break leads to red colors, but we expect that the excellent image quality of the HSC will help identify those low- galaxies morphologically. The third is faint Lyman-break galaxies (LBGs) at , which are also affected by IGM absorption. Figure 2 displays the luminosity functions of high- quasars [93, 43] and LBGs [6, 7]. We assume the galaxy UV spectral slope of [77, e.g.,] to convert the UV magnitudes in the literature to . Although the luminosity functions are still poorly constrained at mag for quasars and at mag for LBGs, it is likely that they intersect at an apparent magnitude of 24 mag, with LBGs outnumbering quasars at fainter magnitudes. This is why previous surveys at brighter magnitudes did not suffer from severe LBG contamination. The LBG contamination in our project could be significant, particularly if the LBG luminosity function has a double power-law form instead of the Schechter function with its exponential cut-off at the bright end [8, 7].


There are several methods to extract quasar candidates from multiband imaging data. Our sample of candidates is selected based on a Bayesian probabilistic approach, as detailed in §III.1. It computes the posterior probability for each source being a high- quasar rather than a red star or dwarf, based on photometry in all the available bands as well as SED and surface density models of the populations under consideration. We use photometry in the HSC optical bands plus the NIR bands (, , , ) where available from UKIDSS or VIKING. While UKIDSS is too shallow for all but the brightest HSC sources, the VIKING data are useful to identify and remove brown dwarfs, because the mean colors of L–T dwarfs ( mag) match the relative depths of the HSC survey and VIKING. The entire flow of the candidate selection from the HSC-SSP database to the final spectroscopic targets is described in §III.2. Our selection procedure has efficiently removed contaminants, recovered all the known quasars imaged by the HSC so far (§III.3), and discovered a number of new objects as described in the following sections.
III.1. Bayesian algorithm
Our quasar candidates are selected with a Bayesian probabilistic algorithm, developed following Mortlock et al. [59]. Here we assume that galaxies and relatively blue stars with O to early-M spectral types have been removed in advance with color and extendedness cuts (see §III.2). Although this may not be the case for LBGs at , we do not model this population at present because (i) they are hard to distinguish from high- quasars by colors alone and (ii) their surface density at mag is still poorly understood (see Figures 1 and 2).
For a detected source with the observed quantities , the Bayesian probability of being a quasar is given by:
| (1) |
and
| (2) |
where the subscripts Q and D denote a quasar and a brown dwarf, respectively. The vector represents the magnitudes in all the available bands in the present case, while represents the intrinsic source properties (i.e., luminosity and redshift for a quasar and luminosity and spectral type for a brown dwarf). The functions , , and represent the surface number density, the probability that the source is detected (“det”), and the probability that the source has the observed quantities , respectively, each as a function of .
We compute with the quasar luminosity function of Willott et al. [93] and the Galactic brown dwarf model of Caballero et al. [10]. The former is well determined at mag, while we extrapolate it to mag as shown in Figure 2 in order to match the HSC observations. The brown dwarf model takes into account the spatial density distributions and luminosities of late-M, L, and T dwarfs, and allows one to compute number counts for each spectral type at a given Galactic coordinate. At our quasar selection limit of mag (see below), L–T dwarfs within 1 kpc of the Sun are bright enough to enter our sample. The validity of these quasar and brown dwarf models will be evaluated with the results of our and other surveys in future work.
Since the HSC-SSP survey depth has not been fully analyzed yet (§2), we arbitrarily set for or mag and 0 otherwise. The SED models required for are created as follows. The quasar model spectrum at is first created by stacking the SDSS spectra of 340 bright quasars at , where the quasar selection is fairly complete [68, 90], after correcting for the foreground IGM absorption. The IGM H I opacity data are taken from Songaila [76]. This spectrum is then placed at various redshifts with the appropriate IGM absorption taken into account, and convolved with the filter transmission functions to compute colors. Because the model spectra redshifted to do not extend beyond the -band, we take the and colors from Hewett et al. [34]. The dwarf colors are computed with a set of observed spectra compiled in the SpeX prism library22 2 This research has benefited from the SpeX Prism Spectral Libraries, maintained by Adam Burgasser at http://pono.ucsd.edu/adam/browndwarfs/spexprism. and in the CGS4 library.33 3 The L and T dwarf archive is maintained by Sandy Leggett at http://staff.gemini.edu/sleggett/LTdata.html. Because of the discrete sampling of the brown-dwarf templates grouped into individual spectral types, the integration in Equation 2 is treated as a summation for spectral types. Finally, the flux errors are taken from the outputs of the HSC image processing pipeline, and are assumed to follow a Gaussian probability density distribution in fluxes.
III.2. Selection flow
The present work is based on the HSC-SSP Wide-layer data included in the S15A internal data release, which happened in 2015 September. Forced photometry (see §2) on the stacked images is used. We first query the HSC-SSP database for non-blended44 4 In particular, we query sources that are isolated or deblended from parent blended sources, and we reject those parents. This corresponds to deblend.nchild = 0 in the database language. sources meeting the following criteria:
| (3) |
or
| (4) |
and without any critical quality flags assigned.55 5 Specifically, we require that the source is (i) not close to an edge of the processed image frame (flags.pixel.edge = False), (ii) not in a bad CCD region (i.e., bad pixels or vignetted area; flags.bad.center = False), (iii) not saturated (flags.pixel.saturated.center = False), and (iv) not affected by cosmic rays (flags.pixel.cr.center = False) in the -, -, and -bands. Throughout this paper , , and refer to PSF magnitudes. The conditions of Equation 3 select -band dropouts at , while those of Equation 4 select -band dropouts at . The color cuts are used to exclude relatively blue stars with O to early-M spectral types (see Figure 1), while the difference between the PSF and cModel magnitudes is used to exclude extended sources. After the database query, we further remove low- interlopers with more than detection in the - or -band.
Because we are looking for rare faint objects detected in only one or two bands, we are sensitive to false dropout sources of both astrophysical and non-astrophysical origins. However, we can take advantage of the fact that in the HSC-SSP Wide survey, each patch of the sky is visited and imaged several times with different dithering positions. Glitches in the data may become apparent upon comparing the individual per-visit exposures. For every candidate, we retrieve and perform photometry on all the per-visit images with Source Extractor, version 2.8.6 [5], in the double-image mode, with the stacked image as the detection reference. If any of the per-visit photometric measurements deviate by more than three times the measurement error from the stacked photometry, the candidate is eliminated. This procedure is performed in the band in which the source photometry has the highest signal-to-noise ratio (S/N; typically the -and for dropouts and the -band for dropouts). We also reject candidates with profiles that are too compact, diffuse, or elliptical to be celestial point sources with the Source Extractor measurements on the stacked images. The eliminated sources are mostly cosmic rays, moving or transient sources, and image artifacts.
The candidates selected above are matched to the UKIDSS and VIKING catalogs within 1″.0 in the overlapping survey area. They are then processed through the Bayesian probabilistic algorithm, and those with the quasar probability are added to the sample of candidates. The rather low value of the threshold was chosen to ensure that we would not throw away any possible candidates. We found that the actual distribution is bimodal, with only a small fraction falling in , so our results are insensitive to the exact value of this cut.
Finally, we inspect images of all the candidates by eye and reject additional problematic objects. HSC stacked and per-visit images are used for this purpose. The sources rejected at this stage include those close to very bright stars, cosmic rays, and moving objects overlooked in the above automatic procedure.
In the present survey area covering 80 deg2, we had roughly 50,000 red and point-like sources meeting the database query conditions (Equations 3 and 4) and undetected in the - and -bands. The vast majority of them (97 %) were eliminated by checking the per-visit photometry and source morphology as described above. From 2000 remaining candidates, the Bayesian algorithm selected 117 candidates with . In this initial work, we further excluded candidates with bluer colors ( and ; see Figure 1), fainter magnitudes ( 24.3 mag), or with detection only in the -band; we obtained 38 final candidates after visual image inspection.
We are also developing more classical methods of quasar color selection, such as simple color cuts and SED fitting with no Bayesian prior, in order to understand completeness and any possible bias in the Bayesian algorithm. A comparison of these selection techniques will be presented in a future paper. We found that the present sample of 38 candidates passed our current color cut and SED fitting selection criteria as well.
III.3. Recovery of known quasars
Figure 3 presents the magnitude histogram of the sample selected above. We found 36 -band dropouts interpreted as quasar candidates, and two -band dropouts as quasar candidates. The magnitudes of the former objects range from mag to the limiting magnitude of our selection, mag, while the latter objects are fairly bright in the -band, 21.7 and 22.6 mag.
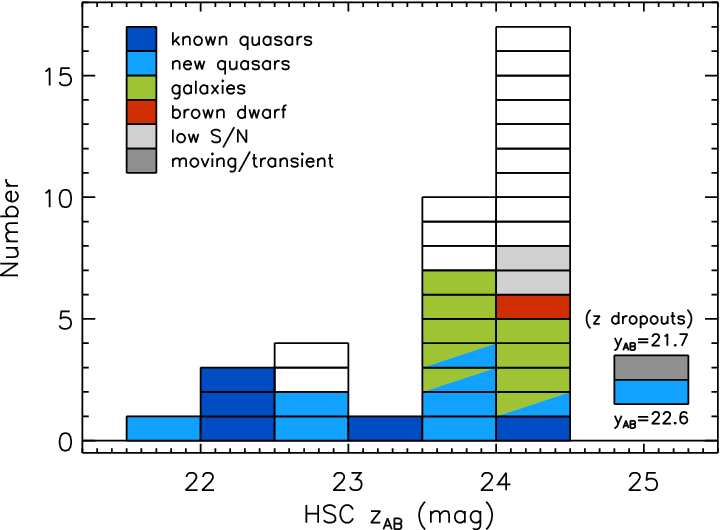
Five high- quasars in the present survey area were identified prior to our project; they are summarized in Table 1. We found that they all successfully pass our selection criteria and end up in the final quasar candidates, as marked by the dark blue cells in Figure 3. The Bayesian quasar probability is in all cases. The figure implies that the success rate of our quasar selection is quite high at the brightest magnitudes; for example, three of the four candidates at mag were indeed previously discovered high- quasars. The five known quasars include CFHQS J02160455 with mag, which, as we discussed in §1, was the faintest high- quasar known before this work.
Thus our candidate selection works quite efficiently at the brighter magnitudes. We now start to explore the remainder of the sample with new spectroscopic observations, as described in the next section.
| R.A. | Decl. | (mag) | (mag) | (mag) | Comment |
|---|---|---|---|---|---|
| 02:10:13.19 | 04:56:20.7 | 26.96 0.42 | 22.34 0.01 | 22.39 0.04 | ; ref (1) |
| 02:16:27.79 | 04:55:34.1 | 27.61 0.69 | 24.20 0.07 | 25.81 0.68 | ; ref (2) |
| 02:27:43.30 | 06:05:30.3 | 25.49 0.12 | 22.05 0.01 | 22.03 0.03 | ; ref (2) |
| 22:19:17.22 | 01:02:49.0 | 27.78 0.80 | 23.43 0.04 | 23.29 0.07 | ; ref (3) |
| 22:28:43.52 | 01:10:32.0 | 24.01 0.02 | 22.40 0.01 | 22.47 0.02 | ; ref (4) |
IV. Spectroscopy
We carried out spectroscopic follow-up observations of the quasar candidates in the 2015 Fall and 2016 Spring semesters. One of the candidates was observed with the Optical System for Imaging and low-intermediate-Resolution Integrated Spectroscopy [12, OSIRIS;] mounted on the Gran Telescopio Canarias (GTC) in 2015 September, which led to the first discovery of a high- quasar from our project. We also observed 19 candidates with the Faint Object Camera and Spectrograph [42, FOCAS;] mounted on Subaru in 2015 November and December, and identified 14 more quasars and galaxies. We further obtained additional exposures for a few of the above objects in 2016 February. The journal of these discovery observations is presented in Table 2. The details of the observations are described in the following sections.
| Target | Date | |||
|---|---|---|---|---|
| GTC/OSIRIS; 2015 Sep | ||||
| Sep 13 | Sep 14 | |||
| HSC J22160016 | 90 min | 55 min | ||
| Subaru/FOCAS; 2015 Nov and Dec | ||||
| Nov 3 | Nov 4 | Dec 6 | Dec 7 | |
| HSC J02100523 | 23 min | 60 min | ||
| HSC J02100559 | 80 min | 45 min | ||
| HSC J02150555 | 40 mins,t | 120 min | 60 min | |
| HSC J02190416 | 80 min | 60 min | ||
| HSC J08480045 | 80 mint | 30 mins | 30 min | |
| HSC J08500012 | 30 min | |||
| HSC J08570142 | 100 min | |||
| HSC J08590022 | 30 min | |||
| HSC J11520055 | 15 min | |||
| HSC J12020057 | 60 min | |||
| HSC J12050000 | 100 mins | |||
| HSC J12070005 | 40 min | |||
| HSC J22160016 | 30 min | |||
| HSC J22280128 | 80 min | |||
| HSC J22320012 | 60 min | 50 mine | ||
| HSC J22360032 | 25 mins | 80 min | ||
| Subaru/FOCAS; 2016 Feb | ||||
| Feb 13 | Feb 14 | Feb 15 | Feb 16 | |
| HSC J02100523 | 30 mine | 40 min | ||
| HSC J12020057 | 50 min | 60 min | ||
| HSC J12050000 | 80 min | 100 mins | ||
| HSC J12070005 | 60 min | |||
Note. — The coordinates (J2000.0) and magnitudes were measured with the HSC data. All the objects have the Bayesian quasar probability . References: (1) Willott et al. [92], (2) Willott et al. [94], (3) Kashikawa et al. [43], (4) Zeimann et al. [98].
Note. — Observing conditions: spoor seeing (1″.0 2″.0), tlow transparency, elow elevation (30∘).
IV.1. GTC/OSIRIS
GTC is a 10.4 m telescope located at the Observatorio del Roque de los Muchachos in La Palma, Spain. Our program (GTC19-15B; Iwasawa et al.) was awarded 14.4 hr in the 2015B semester. We used OSIRIS with the R2500I grism and 1″.0 wide long slit, which provides spectral coverage from = 0.74 to 1.0 m with a resolution . The observations were carried out in queue mode on dark nights with excellent weather conditions and the seeing 0″.7 – 1″.0.
The data were reduced using the Image Reduction and Analysis Facility (IRAF66 6 IRAF is distributed by the National Optical Astronomy Observatory, which is operated by the Association of Universities for Research in Astronomy (AURA) under a cooperative agreement with the National Science Foundation.). Bias correction, flat fielding with dome flats, sky subtraction, and 1d extraction were performed in the standard way. The wavelength was calibrated with reference to sky emission lines. The flux calibration was tied to the white dwarf standard stars, Ross 640 and G191-B2B, observed on the same nights. We corrected for slit losses by scaling the spectra to match the HSC -band magnitudes.
One of the quasar candidates was observed in this GTC run and identified to be a quasar at . Its spectrum is presented in §5. In addition, we observed five candidates that were selected from the older (S14B) version of the HSC-SSP data release. These five objects are no longer quasar candidates with the revised photometry in our fiducial (S15A) release, and hence are not included in the sample of 38 candidates described above. Indeed, their OSIRIS spectra show the relatively smooth red continua characteristics of brown dwarfs, which is also consistent with the latest HSC magnitudes. The detailed analysis of these objects is still underway and will be reported in a future paper.
IV.2. Subaru/FOCAS
Our program was awarded four nights in the S15B semester (S15B-070; Matsuoka et al.) and five nights in the S16A semester (S16A-076; Matsuoka et al.) with the Subaru 8.2 m telescope. We used FOCAS in the multiobject spectrograph mode with the VPH900 grism and SO58 order-sorting filter. The widths of the slitlets were set to 1″.0. This configuration provides spectral coverage from = 0.75 to 1.05 m with a resolution . The observations were carried out in gray nights in 2015 November, December, and 2016 February. A few of these nights were occasionally affected by cirrus and poor seeing (1″.0 2″.0), while the weather was fairly good with seeing 0″.6 – 0″.8 in the rest of the observations.
The data were reduced with IRAF using the dedicated FOCASRED package. Bias correction, flat fielding with dome flats, sky subtraction, and 1d extraction were performed in the standard way. The wavelength was calibrated with reference to the sky emission lines. The flux calibration was tied to the white dwarf standard star Feige 110 observed on the same nights as the targets. We corrected for slit losses by scaling the spectra to match the HSC magnitudes in the -band for the -band dropouts and -band for the one -band dropout we observed.
We observed 19 targets from the sample of candidates, including the quasar identified with GTC/OSIRIS, and identified 14 new high- quasars and galaxies, as well as a brown dwarf. Their final spectra are presented in §5. One of the -band dropout targets was not found in the HSC position at the time of the spectroscopy, so is most likely a moving object or a transient event caught by the HSC -band observations. All the -band exposures of this object were taken in a single day, and our inspection of per-visit images did not detect significant day-scale motion or flux variation. The spectral S/N of the remaining two targets was too low to judge their nature at this moment.
V. Discovery of high- quasars and galaxies
Figure 4 displays the spectra of the identified quasars and possible quasars, while Figure 5 displays those of the non-quasars (i.e., galaxies and a brown dwarf). Their photometric and spectroscopic properties are summarized in Table 3. We present short notes on the individual quasars in §V.1 and on the contaminating objects in §V.2. Discussion and future prospects are described in §V.3.


| Name | R.A. | Decl. | (mag) | (mag) | (mag) | (mag) | Redshift | (mag) | |
|---|---|---|---|---|---|---|---|---|---|
| Quasars and Possible Quasars | |||||||||
| HSC J12050000 | 12:05:05.09 | 00:00:27.9 | 22.61 0.03 | 21.95 0.21 | 1.000 | 6.7–6.9 | 24.35 0.18 | ||
| HSC J22360032 | 22:36:44.58 | 00:32:56.9 | 23.78 0.08 | 23.23 0.05 | 1.000 | 6.4 | 23.66 0.10 | ||
| HSC J08590022 | 08:59:07.19 | 00:22:55.9 | 27.89 1.06 | 22.77 0.01 | 23.65 0.07 | 1.000 | 6.39 | 23.59 0.15 | |
| HSC J11520055 | 11:52:21.27 | 00:55:36.6 | 25.52 0.09 | 21.83 0.01 | 21.61 0.02 | 21.66 0.22 | 1.000 | 6.37 | 24.97 0.11 |
| HSC J22320012 | 22:32:12.03 | 00:12:38.4 | 27.76 0.51 | 23.84 0.04 | 24.26 0.13 | 1.000 | 6.18 | 22.56 0.34 | |
| HSC J22160016 | 22:16:44.47 | 00:16:50.1 | 26.05 0.14 | 22.78 0.02 | 22.94 0.03 | 1.000 | 6.10 | 23.58 0.12 | |
| HSC J22280128 | 22:28:27.83 | 01:28:09.5 | 27.56 0.41 | 24.06 0.05 | 24.50 0.13 | 1.000 | 6.01 | 22.40 0.12 | |
| HSC J12070005 | 12:07:54.14 | 00:05:53.3 | 26.39 0.15 | 24.00 0.03 | 23.87 0.08 | 1.000 | 6.01 | 22.59 0.08 | |
| HSC J12020057 | 12:02:46.37 | 00:57:01.7 | 26.13 0.13 | 23.82 0.03 | 23.89 0.10 | 1.000 | 5.93 | 22.54 0.18 | |
| Galaxies | |||||||||
| HSC J02190416 | 02:19:29.41 | 04:16:45.9 | 24.32 0.06 | 24.14 0.11 | 1.000 | 5.96 | 22.50 0.07 | ||
| HSC J02100523 | 02:10:33.82 | 05:23:04.1 | 25.85 0.17 | 23.78 0.06 | 23.54 0.11 | 0.940 | 5.89 | 22.92 0.20 | |
| HSC J08570142 | 08:57:23.95 | 01:42:54.6 | 26.24 0.26 | 24.14 0.05 | 23.93 0.09 | 0.964 | 5.82 | 22.52 0.03 | |
| HSC J02100559 | 02:10:41.28 | 05:59:17.9 | 26.61 0.27 | 24.25 0.07 | 24.10 0.16 | 0.996 | 5.82 | 22.37 0.06 | |
| HSC J08480045 | 08:48:18.33 | 00:45:09.6 | 26.27 0.21 | 23.90 0.06 | 24.00 0.10 | 1.000 | 5.78 | 22.75 0.08 | |
| HSC J02150555 | 02:15:45.20 | 05:55:29.1 | 26.03 0.15 | 23.98 0.05 | 23.67 0.10 | 0.929 | 5.74 | 22.66 0.02 | |
| Brown dwarf | |||||||||
| HSC J08500012 | 08:50:02.63 | 00:12:10.0 | 28.40 1.44 | 24.06 0.06 | 23.22 0.05 | 0.171 | 0.00 | ||
Note. — The coordinates are at J2000.0. The -band magnitudes are taken from VIKING. The magnitude upper limits are placed at 5 significance. The errors of do not include the uncertainty inherent in the assumed quasar and galaxy spectral slopes.
V.1. Notes on individual quasars
V.1.1 HSC J12050000
This object is a -band dropout source with the HSC photometry. While the deep IGM absorption trough at Å suggests that the redshift of this source is , the interpretation of the redder part of the spectrum is difficult with the present S/N. Assuming that the Ly line is somewhere in the spike around 9400 Å, the inferred redshift is . Then N V 1240 is expected at Å, and the blueward absorption feature is likely to be an N V broad absorption line (BAL) system. An alternative, interesting possibility is that the strongest peak at Å is Ly at . In this case, the residual flux around 9400 Å would imply that there is an ionized bubble within the IGM at 6.7. If this bubble is created by the ionizing radiation from J12050000, then the estimated near-zone size is 6 Mpc, or 13 Mpc when normalized to mag, which is considerably larger than implied from other high- quasars [11]. This problem would be alleviated if the bubble is ionized by a different source in front of J12050000, although the chance of having such a high- foreground source must be small. While the case for the redshift to be is most likely, we need further data (e.g., other emission lines in deep near-IR or submm spectra) to determine an accurate redshift of this object.
V.1.2 HSC J22360032
The IGM absorption trough at Å indicates that the redshift of this source is . The redder part of the spectrum is relatively blue and indicates that this object is a quasar with no Ly emission line. The absence of Ly may be due to the intrinsic nature of this quasar or by the damping wing of severe IGM absorption. If we assume the Ly wavelength of Å, then the estimated redshift is . In this case, the spectral position of the strong BAL observed at around 9200 Å corresponds to N V 1240. This BAL gas may also be responsible for absorbing the Ly line emission.
V.1.3 HSC J08590022
This is an unambiguous quasar with strong and broad emission lines at and 9170 Å, which are Ly and N V 1240 at . The continuum is very weak even at the wavelengths that are unaffected by IGM absorption (i.e., redward of the Ly line), and the observed broad-band flux in this spectral range is mostly contained in the above two lines.
V.1.4 HSC J11520055
The spectrum is typical of a high- quasar. The redshift measured with the Ly line is , but is quite uncertain, given the asymmetry in the line due to the onset of the Ly forest.
V.1.5 HSC J22320012
The spectrum is reminiscent of those of Ly emitters found in deep galaxy surveys [62, e.g.,]. The Ly redshift is . The luminosity, rest-frame equivalent width, and full width at half maximum (FWHM; after correcting for the instrumental broadening) of the line are erg s-1, Å, and km s-1, respectively. The high (Ly) implies a contribution from AGN, as a recent study of a large sample of Ly emitters at [48] suggests that the bright emitters with erg s-1 almost always have a substantial AGN contribution, based on their X-ray, UV, and radio properties. The measured (Ly) and are similar to those of the high- galaxy “CR7”, which is suggested to contain Population-III-like stars [75, based on the very strong nebular lines including He II 1640], while is less than half that of CR7. The AGN contribution in this object may also be supported by the possible broad-line component seen redward of Ly, as well as the relatively large [2, see, e.g.,]. Note that the intrinsic line FWHM may be as much as twice the value estimated here, due to the IGM absorption.
V.1.6 HSC J22160016
This is an unambiguous quasar at , observed both at GTC and Subaru. The spectrum around the expected N V 1240 position ( Å) is heavily absorbed, likely due to a BAL of the N V line. The small-scale features of this BAL are very similar in the FOCAS and OSIRIS spectra, suggesting that they are real. We note that there is no atmospheric absorption feature in the standard star spectrum at the wavelengths corresponding to this BAL.
V.1.7 HSC J22280128
The redshift measured with Ly is . The spectrum is similar to but not as extreme as J22320012, with erg s-1, Å, and km s-1. As in J22320012, the luminous Ly line implies a contribution from AGN.
V.1.8 HSC J12070005
The spectrum is very similar to that of the previous object, J22280128. The redshift inferred from the Ly line is , while the Ly properties are erg s-1, Å, and km s-1. The luminous Ly emission and relatively large imply an AGN contribution, as in J22320012 and J22280128.
V.1.9 HSC J12020057
This object has a typical quasar spectrum, with a strong and broad Ly line and blue continuum. The redshift estimated with Ly is .
V.2. Notes on the contaminating objects
Figure 5 presents the spectra of the objects that are not likely to be quasars, based on the absence of high ionization lines, broad emission lines, or blue continuum. J08570142 and J02150555 have narrow Ly lines and sharp continuum breaks characteristic of GP troughs. The interstellar absorption lines of Si II 1260, Si II 1304, and C II 1335 are also clearly visible, which indicate that they are LBGs at and , respectively. These three absorption lines may also be present in the spectra of J02190416, J02100523, J02100559, and J08480045, although the S/N is lower. Combined with the relatively flat continua and the sharp flux drops in the bluer part of the spectra, they are also likely to be high- galaxies. Their approximate redshifts were estimated from the absorption lines.
It is worth mentioning that the redshift distribution of these galaxies () is systematically different from that of the discovered quasars (). This is partly because only intrinsically luminous objects can be detected at , where the GP trough comes into the -band. In addition, galaxies are redder than quasars at due to weaker Ly lines and redder continua, and so are more difficult to separate from the Galactic brown dwarfs (see Figure 1). The evolution of the luminous end of the galaxy luminosity function around may also be a factor.
Another interpretation is that these sources are red galaxies at , whose 4000 Å break is responsible for their red colors (see the discussion in §3). However, we find this to be unlikely. Even with high metallicity (2.5 ) and old stellar age (5 Gyr), a large amount of dust reddening () is required for a galaxy at to have [79]. Such high values of and are rarely found in samples of red galaxies [58, 56, e.g.,], while our objects have even redder colors (). In addition, their spectra show absorption lines in most of the cases consistent with Si II 1260, Si II 1304, and C II 1335 at . The lack of lower- galaxies in our sample demonstrates the power of HSC, whose excellent image quality helps detect faint extended emission of such galaxies and separate them from high- objects morphologically.
Finally, J08500012 has a relatively smooth red continuum characteristic of a brown dwarf. Indeed this object has a rather low value () and the Bayesian algorithm predicts that it is most likely a L0 dwarf, which is consistent with the obtained spectrum. A follow-up study of this faint dwarf will be presented in a future paper.
V.3. Discussion and future prospects
In summary, we obtained spectra of 19 out of the 38 candidates, and identified 15 new high- quasars and galaxies. The above candidates also include 5 previously known quasars, which were recovered by our selection. The current status of the spectroscopic identifications is presented in Figure 3. Our selection is quite successful at magnitudes brighter than mag, where seven out of the nine candidates have turned out to be quasars and the remaining two are awaiting spectroscopy. This implies the following two points: First, the source detection and measurements with the HSC hardware and reduction software are highly reliable without serious systematic effects. Second, our quasar selection algorithms work quite efficiently as long as they are fed with correct photometry information.
Interestingly, we have started to find high- galaxies as significant contaminants at mag. This is not surprising because the luminosity functions of quasars and LBGs are likely to intersect at 24 mag, with LBGs outnumbering quasars at fainter magnitudes (see Figure 2 and the discussion in §3). Figure 6 presents the difference between the PSF and cModel magnitudes, as a measure of source extendedness, for all the identified objects in this work. Because the host galaxy contribution is not always negligible for the low-luminosity quasars we are looking for, and the extendedness is a noisy quantity at the faintest magnitudes, no clear cut can be defined to separate quasars and galaxies on this plane. Indeed, the three possible quasars with relatively narrow Ly lines (J22320012, J22280128, J12070005; see Figure 4) appear to have larger extendedness than the remaining quasars, suggesting significant light from the host galaxies.

Meanwhile, the discovered galaxies are an important probe of the reionization era. For example, stellar populations in such high- bright galaxies can be studied in detail with high-quality spectra. Measurements of the interstellar absorption lines such as those observed in J08570142 and J02150555 have the potential to constrain the escape fraction of ionizing photons [40]. Follow-up observations with facilities at other wavelengths (e.g., the Atacama Large Millimeter/submillimeter Array; ALMA), would also be useful to understand the nature of these galaxies in the high- Universe.
At the faintest magnitudes of our survey ( mag), the photometric selection and spectroscopic identification become more challenging. Along with the increasing fraction of galaxies, we found a contaminating brown dwarf, which is expected from its low Bayesian quasar probability ( = 0.17; see §V.2). We were not able to confirm the nature of two candidates due to their low spectral S/N, although we typically spent a few hours per object with Subaru. They seem to have no strong emission lines and so may be galaxies or brown dwarfs, but weak-line quasars such as J22360032 are known to exist. Further analysis of these objects, possibly with additional observing time to increase the S/N, will be presented in a future paper.
With the five previously known objects and the nine newly identified objects (including the possible quasars J22320012, J22280128, and J12070005), fourteen high- quasars are now known in the present survey area. This is roughly half of the expected number with our survey limit in 80 deg2 (see §2), although the spectroscopic identification is still not complete. In the last column of Table 3, we report the absolute magnitudes of the discovered quasars as well as galaxies. For quasars, we measure the flux densities at the rest-frame wavelength Å (except for J with the highest redshift, in which case we adopt Å and assume ) and estimate assuming the power-law continuum slope [80, ; e.g.,]. For galaxies, we measure at Å and convert them to by assuming the UV spectral slope of [77]. As expected, our survey has succeeded in identifying quasars (and galaxies) with luminosities approaching mag (i.e., 2 mag lower luminosity than found in most of the previous large surveys; see §1).
We will continue to develop the SHELLQs project as the HSC-SSP survey continues. The present work only partially covers the first 80 deg2 of the Wide layer, which will eventually observe 1400 deg2. Our immediate goal is to complete the spectroscopic identification in this 80 deg2 area and derive our first quasar luminosity function. In the long term, we will expand the survey area and significantly increase the sample size and luminosity range of known high- quasars. As described in §1, the expected numbers of quasars over the whole Wide area are 500 with mag at and 100 with mag at . We will also explore even lower luminosities with the Deep and Ultra-Deep layers of the HSC-SSP survey, although follow-up spectroscopy will become more challenging.
At the same time, it is important to follow up individual quasars in greater detail. The redshifts of some of the discovered quasars are poorly constrained at the moment, which should be improved. We are also planning deep optical and NIR spectroscopy to measure the near-zone size, SMBH mass, and metallicity for those quasars at lower luminosity than previously known at . These low-luminosity objects are expected to be much more numerous than the brighter ones, and hence possess critical information about the general properties of quasars in the early Universe. They will also provide a useful constraint on the low-mass end of the SMBH mass function, and in turn, models of the formation and early evolution of SMBHs. In addition, X-ray observations will play a critical role to estimate the bolometric luminosity, the Eddington ratio, and the presence and properties of absorbing material. We also plan to conduct ALMA follow-up observations in order to study the gas and dust content, as well as the star formation activity in the host galaxies.
VI. Summary
We present initial results from the SHELLQs project, a survey of low-luminosity quasars and AGNs at high redshift close to the reionization era. The project exploits the exquisite imaging data with five optical bands (, , , , and ) produced by the Subaru HSC-SSP survey, supplemented with NIR photometry where available from UKIDSS and VIKING. The limiting magnitudes of the quasar search are currently set to mag and mag, but these may change in the future. The candidates are selected by combining several photometric approaches, including a Bayesian probabilistic algorithm, which have turned out to be quite efficient in eliminating astrophysical contaminants such as stars and dwarfs, as well as cosmic rays, moving objects, and transient events. From the early HSC-SSP survey area covering 80 deg2, we identified 38 candidate high- quasars, which are the focus of this paper.
We carried out spectroscopic follow-up observations of 19 of these candidates, with GTC/OSIRIS and Subaru/FOCAS, in the 2015 Fall and 2016 Spring semesters. Nine objects were identified as quasars or possible quasars at , based on the sharp continuum breaks characteristic of GP troughs, broad Ly and N V 1240 lines, and/or blue continuum. Six objects are likely high- galaxies with interstellar absorption lines of Si II 1260, Si II 1304, and C II 1335, and in some cases narrow Ly emission lines. The remaining objects include a L0 dwarf, a moving or transient object, and two sources whose nature is still uncertain due to the low spectral S/N. In addition to these newly identified objects, five quasars were known prior to our survey among the 38 candidates. The success rate of our selection is quite high, and most of the objects we took spectra of were identified as high- quasars or galaxies.
The SHELLQs project will continue as the HSC-SSP survey continues toward its goals of observing 1400 deg2 in the Wide layer, as well as 27 and 3.5 deg2 in the Deep and Ultra-Deep layer, respectively. We will soon deliver our first quasar luminosity function reaching down to mag at . Further follow-up observations of the discovered quasars and galaxies are being considered at various wavelengths from sub-millimeter/radio to X-ray.
References
- [1] Abazajian, K., Adelman-McCarthy, J. K., Agüeros, M. A., et al. 2004, AJ, 128, 502
- [2] Alexandroff, R., Strauss, M. A., Greene, J. E., et al. 2013, MNRAS, 435, 3306
- [3] Axelrod, T., Kantor, J., Lupton, R. H., & Pierfederici, F. 2010, Proc. SPIE, 7740, 774015
- [4] Bañados, E., Venemans, B. P., Morganson, E., et al. 2014, AJ, 148, 14
- [5] Bertin, E., & Arnouts, S. 1996, A&AS, 117, 393
- [6] Bouwens, R. J., Illingworth, G. D., Oesch, P. A., et al. 2015, ApJ, 803, 34
- [7] Bowler, R. A. A., Dunlop, J. S., McLure, R. J., et al. 2015, MNRAS, 452, 1817
- [8] Bowler, R. A. A., Dunlop, J. S., McLure, R. J., et al. 2014, MNRAS, 440, 2810
- [9] Carnall, A. C., Shanks, T., Chehade, B., et al. 2015, MNRAS, 451, L16
- [10] Caballero, J. A., Burgasser, A. J., & Klement, R. 2008, A&A, 488, 181
- [11] Carilli, C. L., Wang, R., Fan, X., et al. 2010, ApJ, 714, 834
- [12] Cepa, J., Aguiar, M., Escalera, V. G., et al. 2000, Proc. SPIE, 4008, 623
- [13] Choudhury, T. R., Puchwein, E., Haehnelt, M. G., & Bolton, J. S. 2015, MNRAS, 452, 261
- [14] Dark Energy Survey Collaboration, Abbott, T., Abdalla, F. B., et al. 2016, arXiv:1601.00329
- [15] De Rosa, G., Decarli, R., Walter, F., et al. 2011, ApJ, 739, 56
- [16] De Rosa, G., Venemans, B. P., Decarli, R., et al. 2014, ApJ, 790, 145
- [17] Fan, X., Carilli, C. L., & Keating, B. 2006, ARA&A, 44, 415
- [18] Fan, X., Hennawi, J. F., Richards, G. T., et al. 2004, AJ, 128, 515
- [19] Fan, X., Narayanan, V. K., Lupton, R. H., et al. 2001, AJ, 122, 2833
- [20] Fan, X., Strauss, M. A., Richards, G. T., et al. 2006, AJ, 131, 1203
- [21] Fan, X., Strauss, M. A., Schneider, D. P., et al. 2003, AJ, 125, 1649
- [22] Fan, X., White, R. L., Davis, M., et al. 2000, AJ, 120, 1167
- [23] Ferrara, A., Salvadori, S., Yue, B., & Schleicher, D. 2014, MNRAS, 443, 2410
- [24] Fontanot, F., Cristiani, S., & Vanzella, E. 2012, MNRAS, 425, 1413
- [25] Fukugita, M., Ichikawa, T., Gunn, J. E., et al. 1996, AJ, 111, 1748
- [26] Furusawa, H., Kosugi, G., Akiyama, M., et al. 2008, ApJS, 176, 1
- [27] Giallongo, E., Grazian, A., Fiore, F., et al. 2015, A&A, 578, A83
- [28] González, V., Bouwens, R. J., Labbé, I., et al. 2012, ApJ, 755, 148
- [29] Goto, T. 2006, MNRAS, 371, 769
- [30] Goto, T., Utsumi, Y., Furusawa, H., Miyazaki, S., & Komiyama, Y. 2009, MNRAS, 400, 843
- [31] Goto, T., Utsumi, Y., Walsh, J. R., et al. 2012, MNRAS, 421, L77
- [32] Grissom, R. L., Ballantyne, D. R., & Wise, J. H. 2014, A&A, 561, A90
- [33] Gunn, J. E., & Peterson, B. A. 1965, ApJ, 142, 1633
- [34] Hewett, P. C., Warren, S. J., Leggett, S. K., & Hodgkin, S. T. 2006, MNRAS, 367, 454
- [35] Ivezic, Z., Tyson, J. A., Abel, B., et al. 2008, arXiv:0805.2366
- [36] Jiang, L., Fan, X., Annis, J., et al. 2008, AJ, 135, 1057
- [37] Jiang, L., Fan, X., Bian, F., et al. 2009, AJ, 138, 305
- [38] Jiang, L., McGreer, I. D., Fan, X., et al. 2015, AJ, 149, 188
- [39] Jiang, L., Fan, X., Vestergaard, M., et al. 2007, AJ, 134, 1150
- [40] Jones, T. A., Ellis, R. S., Schenker, M. A., & Stark, D. P. 2013, ApJ, 779, 52
- [41] Jurić, M., Kantor, J., Lim, K., et al. 2015, arXiv:1512.07914
- [42] Kashikawa, N., Aoki, K., Asai, R., et al. 2002, PASJ, 54, 819
- [43] Kashikawa, N., Ishizaki, Y., Willott, C. J., et al. 2015, ApJ, 798, 28
- [44] Kashikawa, N., Kitayama, T., Doi, M., et al. 2007, ApJ, 663, 765
- [45] Kaiser, N., Burgett, W., Chambers, K., et al. 2010, Proc. SPIE, 7733, 77330E
- [46] Kawaguchi, T., Aoki, K., Ohta, K., & Collin, S. 2004, A&A, 420, L23
- [47] Kim, Y., Im, M., Jeon, Y., et al. 2015, ApJ, 813, L35
- [48] Konno, A., Ouchi, M., Nakajima, K., et al. 2015, arXiv:1512.01854
- [49] Konno, A., Ouchi, M., Ono, Y., et al. 2014, ApJ, 797, 16
- [50] Lawrence, A., Warren, S. J., Almaini, O., et al. 2007, MNRAS, 379, 1599
- [51] Lehnert, M. D., & Bremer, M. 2003, ApJ, 593, 630
- [52] Madau, P., & Haardt, F. 2015, ApJ, 813, L8
- [53] Madau, P., Haardt, F., & Dotti, M. 2014, ApJ, 784, L38
- [54] Magnier, E. A., Schlafly, E., Finkbeiner, D., et al. 2013, ApJS, 205, 20
- [55] Maiolino, R., Cox, P., Caselli, P., et al. 2005, A&A, 440, L51
- [56] Malhotra, S., Rhoads, J. E., Pirzkal, N., et al. 2005, ApJ, 626, 666
- [57] Miyazaki, S., Komiyama, Y., Nakaya, H., et al. 2012, Proc. SPIE, 8446, 84460Z
- [58] Miyazaki, M., Shimasaku, K., Kodama, T., et al. 2003, PASJ, 55, 1079
- [59] Mortlock, D. J., Patel, M., Warren, S. J., et al. 2012, MNRAS, 419, 390
- [60] Mortlock, D. J., Warren, S. J., Venemans, B. P., et al. 2011, Nature, 474, 616
- [61] Oke, J. B., & Gunn, J. E. 1983, ApJ, 266, 713
- [62] Ono, Y., Ouchi, M., Mobasher, B., et al. 2012, ApJ, 744, 83
- [63] Ouchi, M., Shimasaku, K., Akiyama, M., et al. 2008, ApJS, 176, 301
- [64] Ouchi, M., Shimasaku, K., Furusawa, H., et al. 2010, ApJ, 723, 869
- [65] Planck Collaboration 2016, arXiv:1605.03507
- [66] Pickles, A. J. 1998, PASP, 110, 863
- [67] Reed, S. L., McMahon, R. G., Banerji, M., et al. 2015, MNRAS, 454, 3952
- [68] Richards, G. T., Fan, X., Newberg, H. J., et al. 2002, AJ, 123, 2945
- [69] Robertson, B. E., Ellis, R. S., Dunlop, J. S., McLure, R. J., & Stark, D. P. 2010, Nature, 468, 49
- [70] Robertson, B. E., Ellis, R. S., Furlanetto, S. R., & Dunlop, J. S. 2015, ApJ, 802, L19
- [71] Robertson, B. E., Furlanetto, S. R., Schneider, E., et al. 2013, ApJ, 768, 71
- [72] Schlafly, E. F., Finkbeiner, D. P., Jurić, M., et al. 2012, ApJ, 756, 158
- [73] Schlegel, D. J., Finkbeiner, D. P., & Davis, M. 1998, ApJ, 500, 525
- [74] Shapiro, S. L. 2005, ApJ, 620, 59
- [75] Sobral, D., Matthee, J., Darvish, B., et al. 2015, ApJ, 808, 139
- [76] Songaila, A. 2004, AJ, 127, 2598
- [77] Stanway, E. R., McMahon, R. G., & Bunker, A. J. 2005, MNRAS, 359, 1184
- [78] Tonry, J. L., Stubbs, C. W., Lykke, K. R., et al. 2012, ApJ, 750, 99
- [79] Toshikawa, J., Kashikawa, N., Ota, K., et al. 2012, ApJ, 750, 137
- [80] Vanden Berk, D. E., Richards, G. T., Bauer, A., et al. 2001, AJ, 122, 549
- [81] Venemans, B. P., Findlay, J. R., Sutherland, W. J., et al. 2013, ApJ, 779, 24
- [82] Venemans, B. P., McMahon, R. G., Walter, F., et al. 2012, ApJ, 751, L25
- [83] Venemans, B. P., Verdoes Kleijn, G. A., Mwebaze, J., et al. 2015, MNRAS, 453, 2259
- [84] Venemans, B. P., Walter, F., Zschaechner, L., et al. 2016, ApJ, 816, 37
- [85] Volonteri, M. 2012, Science, 337, 544
- [86] Wang, R., Carilli, C. L., Beelen, A., et al. 2007, AJ, 134, 617
- [87] Wang, R., Wagg, J., Carilli, C. L., et al. 2013, ApJ, 773, 44
- [88] Willott, C. J., Bergeron, J., & Omont, A. 2015, ApJ, 801, 123
- [89] Willott, C. J., Chet, S., Bergeron, J., & Hutchings, J. B. 2011, AJ, 142, 186
- [90] Willott, C. J., Delfosse, X., Forveille, T., Delorme, P., & Gwyn, S. D. J. 2005, ApJ, 633, 630
- [91] Willott, C. J., Delorme, P., Omont, A., et al. 2007, AJ, 134, 2435
- [92] Willott, C. J., Albert, L., Arzoumanian, D., et al. 2010a, AJ, 140, 546
- [93] Willott, C. J., Delorme, P., Reylé, C., et al. 2010b, AJ, 139, 906
- [94] Willott, C. J., Delorme, P., Reylé, C., et al. 2009, AJ, 137, 3541
- [95] Willott, C. J., Omont, A., & Bergeron, J. 2013, ApJ, 770, 13
- [96] Wu, X.-B., Wang, F., Fan, X., et al. 2015, Nature, 518, 512
- [97] York, D. G., Adelman, J., Anderson, J. E., Jr., et al. 2000, AJ, 120, 1579
- [98] Zeimann, G. R., White, R. L., Becker, R. H., et al. 2011, ApJ, 736, 57