Filter based Taxonomy Modification for Improving Hierarchical Classification
Abstract
Hierarchical Classification (HC) is a supervised learning problem where unlabeled instances are classified into a taxonomy of classes. Several methods that utilize the hierarchical structure have been developed to improve the HC performance. However, in most cases apriori defined hierarchical structure by domain experts is inconsistent; as a consequence performance improvement is not noticeable in comparison to flat classification methods. We propose a scalable data-driven filter based rewiring approach to modify an expert-defined hierarchy. Experimental comparisons of top-down HC with our modified hierarchy, on a wide range of datasets shows classification performance improvement over the baseline hierarchy (, defined by expert), clustered hierarchy and flattening based hierarchy modification approaches. In comparison to existing rewiring approaches, our developed method () is computationally efficient, enabling it to scale to datasets with large numbers of classes, instances and features. We also show that our modified hierarchy leads to improved classification performance for classes with few training samples in comparison to flat and state-of-the-art HC approaches. Source code available for reproducibility at: www.cs.gmu.edu/mlbio/TaxMod
Keywords— Top-Down Hierarchical Classification, Rewiring, Clustering, Flattening
1 Introduction
Taxonomy (hierarchy) is most commonly used to organize large volumes of data. It has been successfully used in different application domains such as bioinformatics11 1 http://geneontology.org/, computer vision22 2 http://www.image-net.org/ and web directories33 3 http://dir.yahoo.com/. These application domains (especially highlighed by interest in online prediction challenges such as LSHTC44 4 http://lshtc.iit.demokritos.gr/ and BioASQ55 5 http://bioasq.org/) introduce unique computational and statistical challenges. Given that these datasets have several thousand classes, the developed methods need to scale during the learning and prediction phases. Further, the majority of classes have very few training examples, leading to a class imbalance problem where the learned models (for rare categories) have a tendency to overfit and mispredictions favor the larger classes.
Hierarchies provide useful structural relationships (such as parent-child and siblings) among different classes that can be exploited for learning generalized classification models. In the past, researchers have demonstrated the usefulness of hierarchies for classification and have obtained promising results [1, 2, 3, 4, 5]. Utilizing the hierarchical structure has been shown to improve the classification performance for rare categories as well [6]. Top-down HC methods that leverage the hierarchy during the learning and prediction process are effective approaches to deal with large-scale problems [2]. Classification decision for top-down methods involves invoking only the models in the relevant path within the hierarchy. Though computationally efficient, these methods have higher number of misclassifications due to error propagation [7].


For several benchmarks, the HC approaches are outperformed by flat classifiers that ignore the hierarchy [9, 10]. In majority of the cases, the hierarchy available for training classifiers is manually designed by experts based on domain knowledge and is not consistent for classification. In order to improve performance, we need to restructure the hierarchy to make it more favorable and useful for classification. Motivated by this idea, our main focus in this paper is on generating an improved representation from the expert-defined hierarchy. To summarize, our contributions are as follows:
- •
We propose an efficient data-driven filter based rewiring approach for hierarchy modification which unlike previous wrapper based approaches [11, 12] does not require multiple, expensive computations. Our approach is scalable and can be applied to the HC problems with high-dimensional features, large number of classes and examples.
- •
We perform extensive empirical evaluations and case studies to show the strengths of our approach in comparison to other hierarchy modification approaches such as clustering and flattening.
- •
The modified hierarchy can be used with any hierarchical classification approaches like top-down HC or state-of-the-art approaches incorporating hierarchical relationships [13]. The modified hierarchy in conjunction with a scalable Top-Down HC approach outperforms the flat classifiers on 65% of the rare categories (i.e., classes with less than 10 training examples) across the DMOZ datasets (See Section 4.5).
| Modification Method | Approach | Type | Scalable |
| Margin-based modification [14] | Flattening | Filter | |
| Level flattening [15] | Flattening | Filter | |
| Inconsistent node flattening [7] | Flattening | Filter | |
| Learning based algorithm [16] | Flattening | Wrapper | |
| Agglomerative clustering [8] | Clustering | Wrapper | |
| Divisive clustering [17] | Clustering | Wrapper | |
| Optimal hierarchy search [11] | Rewiring | Wrapper | |
| Genetic based algorithm [12] | Rewiring | Wrapper | |
| Our proposed approach: | |||
| Similarity based modification | Rewiring | Filter |
2 Methods
2.1 Motivation
The manual process of hierarchy creation suffers from various issues. Specifically, (i) Hierarchies are generated by grouping semantically similar categories under a common parent category. However, many different semantically sound hierarchies may exist for same set of classes. For example, in categorizing products, the experts may generate a hierarchy by first separating products based on the company name (, Apple, Microsoft) and then the product type (, phone, tablet) or vice-versa. Both hierarchies are equally good from the perspective of an expert. However, these different hierarchies may lead to different classification results. (ii) Apriori it is not clear to domain experts when to generate new nodes (hierarchy expansion) or merge two or more nodes (link creation) while creating hierarchies, resulting in a certain degree of arbitrariness. (iii) A large number of categories pose a challenge for the manual design of a consistent hierarchy. (iv) Dynamic changes may require hierarchical restructuring.
To remove inconsistencies, various approaches for hierarchy modification have been proposed. These approaches can be broadly categorized into two categories: (i) Flattening approaches [7, 15, 16, 14, 18] where some of the identified inconsistent nodes (based on error rate, classification margins) are flattened (removed) and (ii) Rewiring approaches [11, 12, 19] where parent-child relationships within the hierarchy are modified to improve the classification performance. Clustering based methods have also been adapted in some of these studies [8, 17] where consistent hierarchy is generated from scratch using agglomerative or divisive clustering algorithms. A summary of the various existing methods and their characteristics is shown in Table 1.
To understand the qualitative difference between hierarchy generated using various approaches, we performed experiments on the smaller newsgroup66 6 http://qwone.com/ jason/20Newsgroups/ dataset containing 20 classes. Figure 1(b)-(d) shows the hierarchy structure obtained using clustering, flattening and rewiring based approaches, respectively. Hierarchy generated using clustering completely ignores the expert-defined hierarchy information, which contains valuable prior knowledge for classification [11]. Flattening approaches cannot group together the classes from different hierarchical branches (for , and ). On the contrary, the rewiring approaches provide the flexibility of grouping classes from different sub-branches. More details about Figure 1 are discussed later in a case study (Section 4.1).
| Symbol | Description |
|---|---|
| expert-defined (original) hierarchy | |
| set of leaf categories (classes) | |
| input vector for -th training example | |
| true label for -th training example | |
| predicted label for -th test example | |
| binary label used for -th training example to learn weight | |
| vector for -th node in the hierarchy. = 1 iff =, -1 | |
| otherwise | |
| predicted label for -th test example at -th node in the | |
| hierarchy, = 1 iff prediction, -1 otherwise | |
| total number of training examples | |
| weight vector (model) for -th node | |
| optimal objective function value for -th node obtained | |
| using validation dataset. We have dropped the subscript | |
| at some places for ease of description | |
| C 0 | misclassification penalty parameter |
| modified hierarchy obtained after rewiring | |
| set of all nodes in the hierarchy (except root) | |
| threshold for grouping similar classes in rewiring method | |
| parent of the n-th node | |
| children of the n-th node | |
| siblings of the n-th node |
2.2 Proposed Rewiring Approach
Wrapper based approaches [11, 12, 19] modify the hierarchy by making one or few changes, which are then evaluated for classification performance improvement using the HC learning algorithm. Modified changes are retained if the performance results improve; otherwise the changes are discarded and the process is repeated. This repeated procedure of hierarchy modification continues until the optimal hierarchy that satisfies certain criteria is reached. As such, wrapper approaches are not scalable for large datasets.
We propose an efficient data-driven filter based rewiring approach where the hierarchy is modified based on certain relevance criterion (pairwise sibling similarity) between the different classes within the hierarchy. Our approach is single step and do not require experimental evaluation for multiple iterations. We refer to our proposed rewiring approach as . Table 2 captures the common notations used in this paper and Algorithm 1 illustrates our approach for hierarchy modification. Specifically, it consists of two steps:
(i) Grouping Similar Classes Pairs - To ensure classes with high degree of similarity are grouped together under the same parent node in the modified taxonomy, this step identifies the similar classes pairs that exist within the expert-defined hierarchy. Pairwise cosine similarity is used as the similarity measure in our experiments because it is less prone to the curse of dimensionality [20]. Once the similarity scores are computed, we determine the set S of most similar pairs of classes using an empirically defined cut-off threshold for a dataset (detailed analysis regarding selection is discussed in Section 4.4). For example, in Figure 1(a) this step will group together the class pairs with high similarity scores such as S = [(, ), (, ), (, ), ].
Pairwise similarity computation between different classes is one of the major bottlenecks of this step. To make it scalable, we distribute the similarity computation across multiple compute nodes.
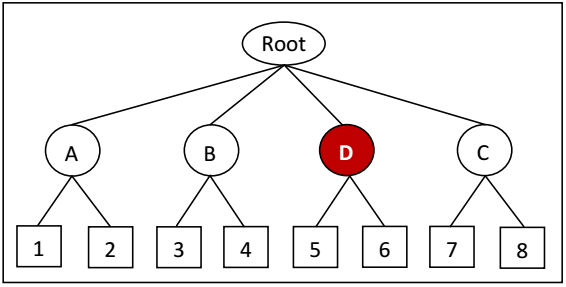
(ii) Inconsistency Identification and Correction - To obtain the consistent hierarchy, we group together each of the similar class pairs to a common parent node. Iteratively, starting from the most similar class pairs we check for potential inconsistencies , if the pairs of classes are in different branches (sub-trees). In order to resolve the identified inconsistencies we take corrective measures using three basic elementary operations: (i) node creation, (ii) parent-child rewiring and (iii) node deletion. Figure 2(b)-(d) illustrates the various hierarchical structures that are obtained after the execution of these elementary operations on the
expert-defined hierarchy in Figure 2 (a).
Node Creation (NC) - This operation groups together the identified similar class pairs in different branches (sub-trees) of the hierarchy using a new node, with parent as the lowest common ancestors of similar classes. Figure 2(b) illustrates this operation where the similar class pairs and are grouped together by the newly created node . This operation is used only when a proper subset of the leaf nodes from different branches are similar (, not similar to all leaf nodes in the branch; otherwise the parent-child rewiring operation is used).
Parent-child Rewiring (PCRewire) - As shown in Figure 2(c), this operation simply assigns (rewires) the leaf node from one parent to another parent node in the hierarchy. It is useful when the leaf node is identified to be similar to all the sibling leaf nodes within the given hierarchy branch. For example, in Figure 2(c), if the computed similarity score determines the leaf node to be more similar to nodes , and in comparison to its current siblings and , than it is more desirable from a classification perspective to assign as node child rather than .
Node Deletion (ND) - This refers to deletion of nodes in the hierarchy that are deemed useless for classification. In Figure 2(d), node is deleted because there are no leaf nodes that can be classified by node . This operation is used as a post-processing step in our algorithm to refine the hierarchy.
The algorithm determines (outer for loop) the best corrective measures (node creation or parent-child rewiring) that need to be taken. Once all the inconsistencies have been addressed, calls the node deletion procedure as a final modification step where unnecessary nodes are deleted.
It should be noted that the new modified hierarchy obtained after inconsistencies removal can be used to train any HC classifier. State-of-the-art HC classification approaches embed the parent-child relationships from the hierarchy either, within the regularization term [21], referred by HR-LR (or HR-SVM) or the loss term, referred by HierCost [13]. The intuition behind Hierarchy Regularized Logistic Regression (HR-LR) [21] approach is that data-sparse child nodes benefit during training from data-rich parent nodes, and this has been shown to achieve the best performance on standard HC benchmarks. However, training these models is computationally expensive due to the coupling between different classes within this formulation. To make this method scalable, distributed computation using hadoop map-reduce was proposed in conjunction with parallel training of odd and even levels. As such, this method requires special hardware and software configurations for large datasets and hence, we did not use this method in our experiments. In case of HierCost [13], a cost-sensitive learning approach was adapted. This method intuitively captures the hierarchical information by treating misclassifications differently based on the commonalities (ancestors) between the true and the predicted labels. Intrinsically, this method scales for large datasets due to the trivial decomposition of learned models for different leaf categories. This method outperforms HR-LR method without any additional parameter configurations. Hence, in this paper we use the HierCost approach for evaluation with our rewired hierarchies.



2.3 Top-Down Hierarchical Classification
We propose to use the Top-Down HC approach with our modified hierarchies because it scales well during training and prediction. Specifically, we train binary one-vs-rest classifiers for each of the nodes — to discriminate its positive examples from the examples of other nodes (i.e., negative examples) in the hierarchy. In this paper, we use logistic regression (LR) as the underlying base model for training [21]. The LR objective uses logistic loss to minimize the empirical risk and squared -norm term (denoted by ) to control model complexity and prevent overfitting. The objective function for training a model corresponding to node is provided in eq. (2.1).
| (2.1) |
For each node in the hierarchy, we solve eq. (2.1) to obtain the optimal weight vector denoted by . The complete set of parameters for all the nodes constitutes the learned model for top-down classifier. For LR models, the conditional probability for given its feature vector and the weight vector is given by eq. (2.2) and the decision function by eq. (2.3).
| (2.2) |
| (2.3) |
For a test example with feature vector , the top-down classifier predicts the class label as shown in eq. (2.4). Essentially, the algorithm starts at the root and recursively selects the best child node until it reaches a terminal node which is the predicted label.
| (2.4) |
3 Experimental Protocol
3.1 Datasets
We have used an extensive set of datasets for evaluating the performance of our proposed rewiring approach. Various statistics of the datasets used are listed in Table 3. CLEF [22] and DIATOMS [23] are image datasets and the rest are text datasets. IPC77 7 http://www.wipo.int/classifications/ipc/en/ is a collection of patent documents and the DMOZ datasets are an archive of web-pages available from LSHTC88 8 http://lshtc.iit.demokritos.gr/ challenge website. For evaluating the DMOZ-2010 and DMOZ-2012 datasets we use the provided test split. The results reported for these two benchmarks are blind prediction (i.e., we do not know the ground truth labels for the test set) obtained from the web-portal interface99 9 http://lshtc.iit.demokritos.gr/node/81,1010 10 http://lshtc.iit.demokritos.gr/LSHTC3_oracleUpload. For all text datasets we apply the tf-idf transformation with -norm normalization on the word-frequency feature vector.
| Dataset | Total | Leaf | Levels | Train | Test | Features |
|---|---|---|---|---|---|---|
| Nodes | Nodes | |||||
| CLEF | 88 | 63 | 3 | 10000 | 1006 | 80 |
| DIATOMS | 399 | 311 | 3 | 1940 | 993 | 371 |
| IPC | 553 | 451 | 3 | 46324 | 28926 | 1123497 |
| DMOZ-SMALL | 2388 | 1139 | 5 | 6323 | 1858 | 51033 |
| DMOZ-2010 | 17222 | 12294 | 5 | 128710 | 34880 | 381580 |
| DMOZ-2012 | 13963 | 11947 | 5 | 383408 | 103435 | 348548 |
3.2 Evaluation Metrics
Flat Measures - Micro- () and Macro- (M) are
used for evaluating the performance. To compute , we sum up the category specific true positives , false positives and false negatives for different classes and compute the score as:
Unlike that gives equal weight to each instance, M gives equal weight to all classes so that score is not skewed in favor of the larger classes. It is computed as:
Hierarchical Measures - Hierarchy is used for evaluating the classifier performance. The hierarchy based measure include hierarchical () defined by:
where and are the sets of ancestors of the predicted and true labels which include the label itself, but do not include the root node, respectively.
Note that for consistent evaluation, we have used the original hierarchy for all methods unless noted.
3.3 Methods for Comparison
3.3.1 Hierarchical Methods
Based on the hierarchy used during the training process, we use the following methods for comparison.
Top-Down Logistic Regression (TD-LR): Expert-defined hierarchy provided by domain experts is used for training the classifiers.
Clustering Approach: Hierarchy generated using agglomerative clustering is used. For evaluation, we have restricted the height of clustered hierarchy to the original height by flattening using cluster cohesion [8].
Global Inconsistent Node Flattening (Global-INF) [7]: Hierarchy is modified by flattening (removing) the inconsistent nodes based on optimal optimization objective value obtained at each node (eq. (2.1)) and empirically defined global cut-off threshold.
Optimal Hierarchy Search [11]: Optimal hierarchy is
identified in the hierarchical space by gradually modifying the expert-defined hierarchy using elementary operations – promote, demote and merge. For reducing the number of operations (and hence hierarchy evaluations), we have restricted the modification to the hierarchy branches where we encountered the maximum classification errors. This modified approach is referred as T-Easy. In the original paper [11], the
largest evaluated dataset has 244 classes and 15795 instances.
3.3.2 Flat Method
The hierarchy is ignored and binary one-versus-rest -regularized LR classifiers are trained for each of the leaf categories. The prediction decision for unlabeled test instances is based on the maximum prediction score achieved across the several leaf categories classifiers.
3.3.3 State-of-the-art Cost-sensitive Learning
[13] Similar to flat method but with cost value associated with each instance in the loss function as shown in eq. (3.5). This approach is referred as HierCost and for evaluations we have used the best cost function “exponential tree distance (ExTrD)” proposed in the paper.
| (3.5) |
where is the cost value assigned to example .
3.4 Experimental Settings
To make the experimental results comparable to previously published results we use the same train-test split as provided by the public benchmarks. In all the experiments we divide the training dataset into train and a small validation dataset in the ratio 90:10. The final reported testing performance is done on an independent held-out dataset as provided by these benchmarks. The model is trained by choosing the misclassification penalty parameter in the set [0.001, 0.01, 0.1, 1, 10, 100, 1000]. The best parameter selected using a validation set is used to retrain the models on the entire training set. For our proposed rewiring approach, we compute the pairwise similarities between classes using the entire training dataset. Additionally, we use the liblinear solver1111 11 http://www.csie.ntu.edu.tw/cjlin/liblinear/ for optimization in all the experiments. The source code is made available at our website: http://cs.gmu.edu/mlbio/TaxMod
| TD-LR | Clustering [8] | Flattening [7] | Proposed | |
| Metric | Agglomerative | Global-INF | rewHier | |
| [Figure 1(a)] | [Figure 1(b)] | [Figure 1(c)] | [Figure 1(d)] | |
| 77.04 (0.18) | 78.00 (0.09) | 79.42 (0.12) | 81.24 (0.08) | |
| 77.94 (0.04) | 78.20 (0.01) | 79.82 (0.07) | 81.94 (0.04) |
| Dataset | Evaluation | TD-LR | Agglomerative | Flattening | Rewiring Methods | |
|---|---|---|---|---|---|---|
| Metrics | Clustering [8] | Global-INF [7] | T-Easy [11] | rewHier | ||
| CLEF | 72.74 | 73.24 | 77.14 | 78.12 | 78.00 | |
| 35.92 | 38.27 | 46.54 | 48.83 | 47.10 | ||
| DIATOMS | 53.27 | 56.08 | 61.31 | 62.34 | 62.05 | |
| 44.46 | 44.78 | 51.85 | 53.81 | 52.14 | ||
| IPC | 49.32 | 49.83 | 52.30 | 53.94 | 54.28 | |
| 42.51 | 44.50 | 45.65 | 46.10 | 46.04 | ||
| DMOZ-SMALL | 45.10 | 45.94 | 46.61 | NS | 48.25 | |
| 30.65 | 30.75 | 31.86 | NS | 32.92 | ||
| DMOZ-2010 | 40.22 | NS | 42.37 | NS | 43.10 | |
| 28.37 | NS | 30.41 | NS | 31.21 | ||
| DMOZ-2012 | 50.13 | NS | 50.64 | NS | 51.82 | |
| 29.89 | NS | 30.58 | NS | 31.24 | ||
4 Discussion and Results
4.1 Case Study
To understand the quality of different hierarchical structures (expert-defined, clustered, flattened and rewired) for the newsgroup dataset shown in Figure 1, we perform top-down HC using each of the hierarchy, separately. The dataset has 11269 training instances, 7505 test instances and 20 classes. We evaluate each of the hierarchy by randomly selecting five different sets of training and test split in the same ratio as original dataset.
The results of classification performance is shown in Table 4. We can see that using these modified hierarchies substantially improves the classification performance in comparison to the baseline expert-defined hierarchy. On comparing the clustered, flattened and proposed rewired hierarchies, the classification performance obtained from using the rewired hierarchy is found to be significantly better than the flattened and clustered hierarchy. This is because rewired hierarchy can resolve inconsistencies by grouping together the classes from different hierarchical branches.
4.2 Evaluating Rewiring Approaches
4.2.1 Performance based on Flat Metrics
Table 5 shows the and performance comparison of rewiring approaches against expert-defined, clustered and flattened hierarchy baselines. The rewiring approaches consistently outperform other baselines for all the datasets across all metrics. For image datasets, the relative performance improvement is larger with performance improvement up to 11 using M scores in comparison to the baseline TD-LR method.
In Table 5 results with -values and are denoted by and , respectively. We compute the sign-test for [24] and non-parametric wilcoxon rank test for comparing the scores obtained per class for the rewiring methods against the best baseline i.e., Global-INF. Both, the rewiring approaches significantly outperform the Global-INF method across the different datasets.
The proposed approach shows competitive classification performance in comparison to the T-Easy approach. For smaller datasets, the T-Easy approach has better performance because it searches for the optimal hierarchy in the hierarchical space. However, the main drawback of the T-Easy approach is that it requires computationally expensive learning-based evaluations for reaching the optimal hierarchy making it intractable for large, real-world classification benchmarks such as DMOZ (See detailed discussion in Runtime Comparison).
| Dataset | Hierarchy | Flattening | Rewiring Methods | |
|---|---|---|---|---|
| used | Global-INF | T-Easy [11] | rewHier | |
| CLEF | Original | 79.06 | 81.43 | 80.14 |
| Modified | 80.87 | 81.82 | 81.28 | |
| DIATOMS | Original | 62.80 | 64.28 | 63.24 |
| Modified | 63.88 | 66.35 | 64.27 | |
| IPC | Original | 64.73 | 67.23 | 68.34 |
| Modified | 66.29 | 68.10 | 68.36 | |
| DMOZ-SMALL | Original | 63.37 | NS | 66.18 |
| Modified | 64.97 | NS | 66.30 | |
| DMOZ-2012 | Original | 73.19 | NS | 74.21 |
| Dataset | Baseline | Flattening | Rewiring Methods | |
|---|---|---|---|---|
| TD-LR | Global-INF | T-Easy [11] | rewHier | |
| CLEF | 2.5 | 3.5 | 59 | 7.5 |
| DIATOMS | 8.5 | 10 | 268 | 24 |
| IPC | 607 | 830 | 26432 | 1284 |
| DMOZ-SMALL | 52 | 65 | NS | 168 |
| DMOZ-2010 | 20190 | 25600 | NS | 42000 |
| DMOZ-2012 | 50040 | 63000 | NS | 94800 |
| Executed elementary operation | Dataset | ||
|---|---|---|---|
| for hierarchy modification | CLEF | DIATOMS | IPC |
| T-Easy [11] | 52 | 156 | 412 |
| (promote, demote, merge) | |||
| proposed rewHier method | 25 | 34 | 42 |
| (NC, PCRewire, ND) | |||

4.2.2 Performance based on Hierarchical Metrics
Hierarchical evaluation metrics such as computes errors for misclassified examples based on the definition of a defined hierarchy. Table 6 shows the score for the best baseline method, Global-INF and the rewiring methods evaluated over the original and the modified hierarchy. The rewiring methods shows the best performance for all the datasets because it is able to restructure the hierarchy based on the dataset that is better suited for classification.
4.2.3 Runtime Comparison
In Table 7 we compare the training times of the different models. For training, we learn the models in parallel for different classes using multiple compute nodes which are then combined to obtain the final runtime. For our proposed rewiring approach we also compute the similarity between different classes in parallel. We can see from Table 7 that TD-LR takes the the least time as there is no overhead associated with modifying the hierarchy; followed by the Global-INF model which requires retraining of models after hierarchy flattening. Rewiring approaches are most expensive because of the compute intensive task of either performing similarity computation in our proposed approach or multiple hierarchy evaluations using the T-Easy approach. The T-Easy method takes the longest time due to large number of expensive hierarchy evaluations after each elementary operations until the optimal hierarchy is reached. Table 8 shows the number of elementary operations executed using the T-Easy and the approach. We can see that T-Easy approach performs large number of operations even for smaller datasets (for , 412 operations for IPC datasets in comparison to 42 for the rewHier).
4.3 Effect of varying the Training Size
Figure 3 shows the comparison of rewiring approaches with Global-INF approach on CLEF and DMOZ-SMALL datasets with varying percentage of training size. For both datasets we can see that rewiring approaches outperform the flattening approaches. For the CLEF dataset with smaller training percentage, the rewHier approach has better performance. The reason for this behavior might be the over-fitting of the optimal hierarchy with the training data in case of T-Easy approach, which results in poor performance on unseen examples. For training dataset with enough examples as expected, T-Easy method gives the best performance but at the cost of expensive runtime. We cannot run T-Easy on the larger DMOZ datasets.
4.4 Threshold () Selection to Group Similar Classes Pairs
Figure 4 shows the sorted (descending order) class pairs cosine similarity scores for DMOZ-SMALL dataset. We can see that similarity scores become nearly constant after 1000 pairs (and drops further after 6000, not shown in the Figure) that does not provide any interesting similar classes grouping information for taxonomy modification. As such, for this dataset choosing threshold as the similarity score of the 1000-th class pair is a reasonable choice. A similar approach to determine the threshold is applied for other datasets as well.


| Flat Method | TD-LR | HierCost | ||||||||
|---|---|---|---|---|---|---|---|---|---|---|
| Dataset | LR | expert-defined | rewHier | expert-defined | rewHier | |||||
| CLEF | 51.31 | 80.58 | 35.92 | 74.52 | 47.10 | 80.14 | 52.30 | 82.18 | 54.20 | 84.42 |
| DIATOMS | 54.17 | 63.50 | 44.46 | 56.15 | 52.14 | 63.24 | 54.16 | 64.13 | 55.78 | 66.31 |
| IPC | 45.74 | 64.00 | 42.51 | 62.57 | 46.04 | 62.57 | 50.10 | 68.45 | 51.04 | 69.43 |
| DMOZ-SMALL | 30.80 | 60.87 | 30.65 | 63.14 | 32.92 | 66.18 | 32.98 | 65.58 | 33.43 | 66.30 |
| DMOZ-2010 | 27.06 | 53.94 | 28.37 | 54.82 | 29.48 | 56.43 | 29.81 | 58.24 | 30.35 | 58.93 |
| DMOZ-2012 | 27.04 | 66.45 | 28.54 | 68.12 | 29.94 | 69.00 | 29.78 | 69.74 | 30.27 | 70.21 |


4.5 Improvement over Flat and State-of-the-art Approaches.
Figure 5 presents the percentage of classes improved for TD-LR and HierCost HC approaches in comparison to the flat approach on DMOZ datasets containing rare categories , less than 10 training examples. For the DMOZ-2010 and DMOZ-2012 benchmarks we use a separate held out test dataset since, we do not have the true labels for the provided test set used for the online competition. From Figure 5 we observe that both the HC approaches outperforms the flat approach irrespective of the hierarchy being used. Rare categories benefit from the utilization of hierarchical relationships, and using the hierarchy improves the accuracy of HC. Moreover, use of rewHier to train the TD-LR and HierCost approaches improves the classification performance in comparison to using the expert-defined hierarchy. Further, the HierCost approach consistently outperforms the TD-LR approach because HierCost penalizes the misclassified instances based on the assignment within the hierarchy. Table 9 gives the more comprehensive results over all classes and Figure 6 gives and improvements for rare categories classes.
In terms of prediction runtime, the TD approaches outperform the flat and HierCost approaches. The flat and HierCost models invoke all the classifiers trained for the leaf nodes to make a prediction decision. For the DMOZ-2012 dataset, the flat and HierCost approaches take 220 minutes for predicting the labels of test instances, whereas the TD-LR model is 3.5 times faster on the same hardware configuration.
5 Related Work
Our work is closely related to the rewiring approach developed in Tang et al. [11], where the expert-defined hierarchy is gradually modified. Iteratively, a subset of the hierarchy is modified and evaluated for classification performance improvement using the HC learning algorithm. Modified changes are retained if the performance results improve; otherwise the changes are discarded and the process is repeated. This repeated procedure of hierarchy modification continues until the optimal hierarchy is reached. Expensive evaluation at each step makes this approach intractable for large-scale datasets. Another drawback of this approach is deciding which branch of the hierarchy to explore first (for modification) and which elementary operation (promote, demote, merge) to apply at each step. Other work in similar direction can be found in [12, 19].
Earlier studies focused on flattening based approaches where some level or nodes are selectively flattened (removed) based on certain criterion [15, 14, 18]. In other work, learning based approach have been proposed [16], where nodes to flatten are decided based on classification performance improvement on a validation set. This approach although useful for smaller datasets, is not scalable due to the expensive evaluation process after each node removal. Recently, Naik et al. [7] proposed a taxonomy adaptation where some nodes are intelligently flattened based on empirically defined cut-off threshold and objective function values computed at each node. Hierarchy modification using this approach is scalable and beneficial for classification and has been theoretically justified [25].
Other approaches towards hierarchy modification involves generating hierarchy from scratch, ignoring the expert-defined hierarchy. These approaches exploit hierarchical clustering algorithms for generating the hierarchy [8, 17, 26, 27]. Constructing hierarchy using clustering approaches is not popular due to its sensitivity to predefined parameters such as number of levels.
6 Conclusion and Future Work
We propose a data-driven filter based rewired approach for hierarchy modification that is more suited for HC. Our method is robust and can be adapted to work in conjunction with any state-of-the-art HC approaches in the literature that utilize hierarchical relationships. Irrespective of the classifiers being trained, our modified hierarchy consistently gives better performance over use of clustering or flattening to modify the original hierarchy. In comparison to previous rewiring approaches, our method gives competitive results with much better runtime performance that allow HC approaches to scale to significantly large datasets (e.g., DMOZ). Further, experiments on datasets with skewed distribution shows the effectiveness of our proposed method in comparison to flat and state-of-the-art methods, especially for classes with rare categories. In future, we plan to study the effect of our method in conjunction with feature selection and other non-linear classification methods.
Acknowledgement
NSF grant #203337 and #202882 to Huzefa Rangwala.
References
- [1] L. Cai and T. Hofmann. Hierarchical document categorization with support vector machines. In CIKM, pages 78–87, 2004.
- [2] D. Koller and M. Sahami. Hierarchically classifying documents using very few words. In ICML, pages 170–178, 1997.
- [3] A. McCallum, R. Rosenfeld, T. Mitchell, and A. Ng. Improving text classification by shrinkage in a hierarchy of classes. In ICML, pages 359–367, 1998.
- [4] S. Dumais and H. Chen. Hierarchical classification of web content. In ACM SIGIR, pages 256–263, 2000.
- [5] A. Sun and E. Lim. Hierarchical text classification and evaluation. In ICDM, pages 521–528, 2001.
- [6] T. Liu, H. Wan, T. Qin, Z. Chen, Y. Ren, and W. Ma. Site abstraction for rare category classification in large-scale web directory. In WWW: Special interest tracks & posters, pages 1108–1109, 2005.
- [7] A. Naik and H. Rangwala. Inconsistent node flattening for improving top-down hierarchical classification. In IEEE DSAA, 2016.
- [8] T. Li, S. Zhu, and M. Ogihara. Hierarchical document classification using automatically generated hierarchy. JIIS, 29(2):211–230, 2007.
- [9] L. Xiao, D. Zhou, and M. Wu. Hierarchical classification via orthogonal transfer. In ICML, pages 801–808, 2011.
- [10] A. Zimek, F. Buchwald, E. Frank, and S. Kramer. A study of hierarchical and flat classification of proteins. IEEE/ACM TCBB, 7(3):563–571, 2010.
- [11] L. Tang, J. Zhang, and H. Liu. Acclimatizing taxonomic semantics for hierarchical content classification. In ACM SIGKDD, pages 384–393, 2006.
- [12] X. Qi and B. Davison. Hierarchy evolution for improved classification. In CIKM, pages 2193–2196, 2011.
- [13] A. Charuvaka and H. Rangwala. Hiercost: Improving large scale hierarchical classification with cost sensitive learning. In ECML PKDD, 2015.
- [14] R. Babbar, I. Partalas, E. Gaussier, and MR. Amini. Maximum-margin framework for training data synchronization in large-scale hierarchical classification. In Neural Information Processing, pages 336–343, 2013.
- [15] X. Wang and B. Lu. Flatten hierarchies for large-scale hierarchical text categorization. In ICDIM, pages 139–144, 2010.
- [16] R. Babbar, I. Partalas, E. Gaussier, and M. Amini. On flat versus hierarchical classification in large-scale taxonomies. In NIPS, pages 1824–1832, 2013.
- [17] K. Punera, S. Rajan, and J. Ghosh. Automatically learning document taxonomies for hierarchical classification. In WWW: Special interest tracks & posters, 2005.
- [18] H Malik. Improving hierarchical svms by hierarchy flattening and lazy classification. In Large-Scale HC Workshop of ECIR, 2010.
- [19] K. Nitta. Improving taxonomies for large-scale hierarchical classifiers of web docs. In CIKM, pages 1649–1652, 2010.
- [20] M. Steinbach, L. Ertöz, and V. Kumar. The challenges of clustering high dimensional data. In New Directions in Statistical Physics, pages 273–309. 2004.
- [21] S. Gopal and Y. Yang. Recursive regularization for large-scale classification with hierarchical & graphical dependencies. In ACM SIGKDD, pages 257–265, 2013.
- [22] I. Dimitrovski, D. Kocev, S. Loskovska, and S. Džeroski. Hierarchical annotation of medical images. Pattern Recognition, 44(10):2436–2449, 2011.
- [23] I. Dimitrovski, D. Kocev, S. Loskovska, and S. Džeroski. Hierarchical classification of diatom images using predictive clustering trees. Ecological Informatics, 7:19–29, 2012.
- [24] Y. Yang and X. Liu. A re-examination of text categorization methods. In ACM SIGIR, pages 42–49, 1999.
- [25] T. Gao and D. Koller. Discriminative learning of relaxed hierarchy for large-scale visual recognition. In ICCV, pages 2072–2079, 2011.
- [26] C. Aggarwal, S. Gates, and P. Yu. On the merits of building categorization systems by supervised clustering. In SIGKDD, pages 352–356, 1999.
- [27] S. Chuang and L. Chien. A practical web-based approach to generating topic hierarchy for text segments. In CIKM, pages 127–136, 2004.