A Langevin model for complex cardiological time series
Abstract
There has been considerable efforts to understand the underlying complex dynamics in physiological time series. Methods originated from statistical physics revealed a non-Gaussian statistics and long range correlations in those signals. This suggests that the regulatory system operates out of equilibrium. Herein the complex fluctuations in blood pressure time series were successful described by physiological motivated Langevin equation under a sigmoid restoring force with multiplicative noise.
pacs
05.40.-a,87.80.Vt,87.19.L-,87.19.HhAugust 24, 2026
Introduction - The autonomic nervous system is able to maintain life signals at safe levels by the action of a pair of nerve branches, called sympathetic and parasympathetic. While the sympathetic prepares our body for ”flight or fight” the parasympathetic (or vagal) is considered as a ”rest and digest” system. In many cases, to achieve the homeostatic optimal levels, these systems have a competitive approach: while one start up an physiological reaction the other one suppress it [1].
Homeostasis depends on the blood flow according to the metabolic demands of each body part. The exchange of nutrients and metabolites occurs when blood flows through capillary channels. The perfusion either into or out the capillary depends on the blood pressure. Adequate levels of blood pressure are controlled by several mechanisms that can be classified according to the response delay: the long term and short term control.
In order to maintain homeostasis the body automatically responds to changes. These responses are called reflexes. The principal short term reflex regulation of arterial blood pressure is the baroreflex. Stretch-sensitive mechanoreceptors are located in the carotid sinus and aortic arch connected to the brainstem, or nucleus tractus solitarii, by the glossopharyngeal and vagal nerves. After integrating the afferent signals the central nervous system, in turn, excite/inhibit the vagal branch if the pressure is high/low enough, closing the circuit for what can be regarded as a self-inhibitory feedback [2].
In addition, blood pressure may vary to adapt different physiological conditions such as exercise [3] or pregnancy [4] and in certain disease states such as hypertension [5]. The optimal level of blood pressure must be risk adjusted: cannot be high enough to cause structural damage and cannot be low enough to hinder the nutrient flow.
It has been suggest that the underlying cardiac control system can be characterized as a complex system. Indeed, heart and blood pressure present fractal time series with long range correlations and non-Gaussian distributions [6] and undergoes a breakdown of critical characteristics like a continous second ordem phase transtion [7].
In this letter, we propose an analytically tractable stochastic model for the baroreflex that capture the fractality and the non-Gaussian behavior in the blood pressure time series. This model leads to solutions in terms of the so called q-Gaussians, which is a well known function in the framework of Nonextensive Statistical Mechanics. This theory have shown excellent results describing time series systems with fractal structure and an introduction and many examples of the theory can be found in [8].
Experiment - Two groups of adult male Wistar rats were analyzed: control rats and chronic sinoaortic denervated rats, animals surgically denervated days before measurements. Sinoaortic denervated was performed using the methods described by Krieger et al [9], and basically consists of full disruption of the nerve fibers connecting the the afferent signals from the baroreceptors to the brainstem, leading to hypertension, tachycardia, and an increase in blood pressure lability. Twenty days after the surgery, only the increase of blood pressure lability is usually observed [10]. This adaptation had been previously investigated in the light of detrended fluctuation analysis [11].
Blood pressure was recorded from the left femoral artery for minutes in conscious rats. Before the analog to digital conversion, blood pressure was low-pass filtered (fc= Hz) for high-frequency noise removal, and recorded with a kHz sampling frequency. Diastolic (minimum) values were detected after parabolic interpolation and signal artifacts were visually identified and removed. A more detailed account of this experiment can be found in [10]. Since the measurements were done in awake conscious unrestrained rats some distortions in the blood pressure signal arise due to their movements. To reduce this problem we discard series that show any kind of discontinuities.

Results and Discussion - Figure 1a a typical diastolic blood pressure record from a control animal is presented. The histogram for the blood pressure values is presented in figure 1c. A Gaussian distribution with sample mean and sample variance was plotted with the histogram, highlighting the non-Gaussian behavior. Furthermore, it clearly presents a positive skew. Despise the fact that the time series has a constant mean of over a range of inter-beats, a complex pattern of fluctuations were observed. To characterize the stochastic dynamics of the blood pressure a detrended fluctuation analysis (DFA) was performed. The log-log plot of the fluctuation function is presented in figure 1b. A crossover around separate two different behaviors. For long time scales the DFA exponent while a for short time scales . This crossover had been discussed previously and it could be associated with autonomic nervous system control of arterial blood pressure [11, 12]. To confirm the presence of long range correlations, the time series were randomly shuffled and DFA was applied. The shuffled time series present DFA exponent , as typical white noise, show at figure 1b in red, which demonstrates that long range correlations arises from the blood pressure control system.
External perturbations are continuously disrupting the cardiac system. In such noisy environment the autonomic nervous system must keep the blood pressure at acceptable levels by integrating chemical and mechanical input from afferents to regulate the blood pressure. However, the neural transmission itself is noisy [13]. Information transmission along the axons is made by electrical signals. Those signals, called action potentials, are created by ion channels in a cell membrane. They travel down the axon to its end where the neurotransmitters are release in the synaptic gap. Those transmitters activate receptors in the post synaptic neuron [14]. The noise source are diverse, for example, they could have physical background in thermodynamic or quantum mechanics, as it happens with sensor neurons, or could be built up in the cellular network [15]. In this sense, the cardiac neural control system is under intrinsic and extrinsic noise.
Synaptic signal transmission is found to be modeled as a diffusive process wherein additive and multiplicative noise plays relevant role to describe the neuronal response [16, 17]. Let where is the blood pressure and is a measure of central tendency, like the mean or the median. Then the neural control of blood pressure dynamics could be modeled as a Brownian particle under a restoring force of the baroreflex:
| (1) |
where is the restoring force, is the diffusion coefficient, is the multiplicative noise and is the additive noise. They both have zero mean and show Markovian correlations, and . Physiologically could be interpreted as external perturbations on cardiac system while is a noise arising from the neural transmission.
Harris and Wolpert [18] propose an unifying optimal control theory for information process in motor systems. The theory is based on a single physiological assumption: the neural noise increases in variance with the size of the control signal. This assumption is then made by the model presented in this paper. Here the noise amplitude is signal dependent and it is proportional to the control system. Several complex systems, like financial and turbulence [19, 20], has a linear drift coefficient and a quadratic state-dependent diffusion coefficient. In those system and . Analogously, the restoring force of the baroreflex could be expressed as above with .Generally the baroreflex is represented by a sigmoid function [21], where are the model parameters. Integrating the sigmoid one can found where , , and must hold that be strictly positive.
Equation (1) could be rewritten as Fokker-Planck equation using Ito calculus:
| (2) |
where , and is the arterial blood pressure distribution. The physiologically viable solution for equation 2 must have as boundary condition. In those conditions, equation 2 has a q-Gaussian distribution as stationary solution [22]:
| (3) |
| (4) |
If implies for some . As and then . The positive value of is associated with the continuous action of the sympathetic activity when not inhibited. In other words, when the blood pressure is near the central value there is an continuous activity, called sympathetic tone, of the nervous system to increase the blood pressure. Otherwise, if , equation 4 must hold for every , which implies and . If coupling constant is larger than multiplicative noise amplitude such as then and converge to Gaussian distribution. The multiplicative noise becomes too small and the long tail vanish. On the other hand, if and converges to the Lorentz distribution [23] destroying homeostasis. In spite of q-Gaussian distribution are defined for , to describe the non-Gaussian behavior observed in figure 1c and keep the physiological feasibility, q must stick in between 1 and 2.
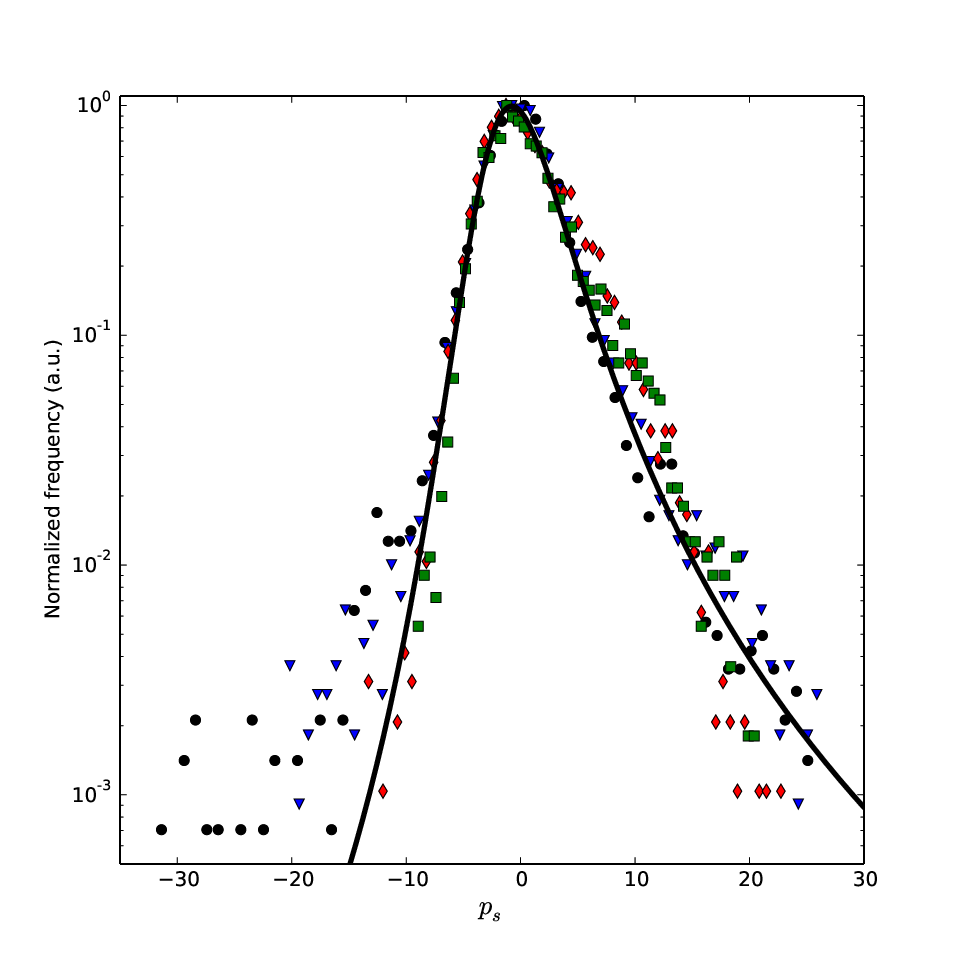
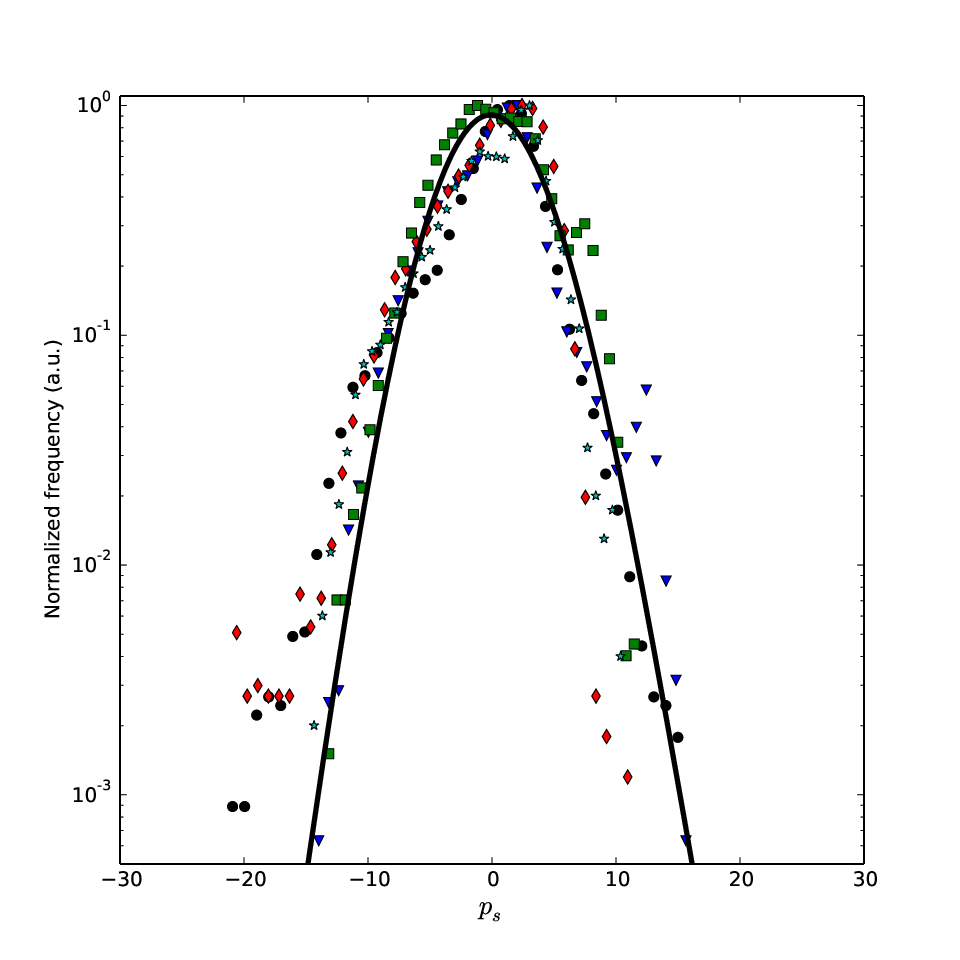
To compare the proposed model with the experimentally observed diastolic blood pressure data, a rescale transformation where performed: , where , is the blood pressure, is it median and is it standard deviation. Once the animals were unrestrained, each BP series could shown different central values and variability. However, when the rescale where performed the data collapse as figure 2 shows. In the same figure the stable solution of the model, equation 3, where plotted. For control animals, figure 2a, the following parameters were used: , , , , and . These values implying . A value of where observed in heart rate variability [24]. Several other non-equilibrium systems presents ,for example, finacial markets [25], hadron-hadron collisions [26], and geological faults [27]. For surgically disrupted animals, presented at figure 2b, the following parameters were used: , , , , and . These values implying , very close to the Gaussian distribution (), showing that the non Gausssian fluctuations are intrinsicly associated with the control feedback loop at short time scale.


To characterize quantitatively the dynamics, a Monte Carlo simulation of the equation 1 were performed for both group. The same parameters of the analitical curves in figure 2 were used. To understand how the model could reproduce the underlying dynamics a DFA of the simulated series were compared with the blood pressure real data. As recently discussed DFA could present a biased estimator for the Hurst exponent [28]. Nevertheless it still holding as good methodology to work on real data [29], and any bias that could be introduced in the fluctuation function will happens on both time series, the real and the simulated one, being no hindrance to the analysis. The results of the DFA for synthetic series and real data is presented in figure 3. The time scales of the blood pressure control feedback loop is commonly analyzed in three different ranges: high , low and very low frequency . The baroreflex plays a significant role at high and low frequency control [30].
After 20 days, since major damages were inflicted on the neural circuit responsible for the baroreflex, the control were achieved by some other redundant mechanism but with larger response delay [11]. Figure 3 shows the model captures the fluctuations behavior in the baroreflex control range for both groups. Time scales larger than are in the very low frequency range and the model developed here plays no role. However, except for long time scales, the fluctuation functions reveals a very similar pattern between synthetic and experimental time series. Based on this analysis, we conclude the model presented here captures the complex behavior of blood pressure control.
A langevin model based on a sigmoidal restoring force with multiplicative noise for the diastolic blood pressure time series was discussed. The stationary solution was a q-Gaussian distribution with that describes remarkably well the blood pressure time series recorded from femoral artery for minutes in conscious unconstrained rats. To investigate the model dynamics a synthetic time series was generated by a monte carlo simulation of the equivalent Langevin equation. The synthetic time series and the experimental data was characterized using DFA and the fluctuation functions were compared. The fluctuation functions reveals a very similar pattern in the synthetic and experimental time series for high and low frequency.
References
- [1] L. K. McCorry, Am. J. Pharm. Educ. 71, 78 (2007).
- [2] A. C. Guyton and J. E. Hall, Textbook of Medical Physiology (W.B. Saunders Company, 2000).
- [3] K. M. Gallagher, P. J. Fadel, S. A. Smith, M. Strømstad, K. Ide, N. H. Secher, and P. B. Raven, Exp. Physiol. 91, 79 (2006).
- [4] M. E. Crandall and C. M. Heesch, Am. J. Physiol. Regul. Integr. Comp. Physiol. 258, R1417 (1990).
- [5] G. Grassi, B. M. Cattaneo, G. Seravalle, A. Lanfranchi, and G. Mancia, Hypertension 31, 68 (1998).
- [6] C. K. Peng, J. Mietus, J. M. Hausdorff, S. Havlin, H. E. Stanley, and A. L. Goldberger, Phys. Rev. Lett. 70, 1343 (1993).
- [7] K. Kiyono, Z. R. Struzik, N. Aoyagi, F. Togo, and Y. Yamamoto, Phys. Rev. Lett. 95, 058101 (2005).
- [8] C. Tsallis et al., Introduction to nonextensive statistical mechanics (Springer, 2009).
- [9] E. M. Krieger, Circ. Res. 15, 511 (1964).
- [10] P. P. d. S. Soares, C. S. Port, F. M. F. Abdalla, R. N. De La Fuente, E. D. Moreira, E. M. Krieger, and M. C. Irigoyen, J. Cardiovasc. Pharmacol. 47, 331 (2006).
- [11] C. E. C. Galhardo, T. J. P. Penna, M. A. de Menezes, and P. Soares, New J. Phys. 11, 103005 (2009).
- [12] K. Fuchs, A. Y. Schumann, A. Kuhnhold, P. Guzik, J. Piskorski, G. Schmidt, and J. W. Kantelhardt, in Proc. 6th Conference of the European Study Group on Cardiovascular Oscillations, Vol. 56 (2010).
- [13] R. B. Stein, E. R. Gossen, and K. E. Jones, Nat. Rev. Neurosci. 6, 389 (2005).
- [14] J. A. White, J. T. Rubinstein, and A. R. Kay, Trends Neurosci. 23, 131 (2000).
- [15] A. A. Faisal, L. P. Selen, and D. M. Wolpert, Nat. Rev. Neurosci. 9, 292 (2008).
- [16] C. Boucsein, T. Tetzlaff, R. Meier, A. Aertsen, and B. Naundorf, J. Neurosci. 29, 1006 (2009).
- [17] M. J. Richardson and R. Swarbrick, Phys. Rev. Lett. 105, 178102 (2010).
- [18] C. M. Harris and D. M. Wolpert, Nature 394, 780 (1998).
- [19] J. Peinke, R. Friedrich, et al., Phys. Rev. Lett. 83, 5495 (1999).
- [20] S. Ghashghaie, W. Breymann, J. Peinke, P. Talkner, and Y. Dodge, Nature 381, 767 (1996).
- [21] B. Kent, J. Drane, B. Blumenstein, and J. Manning, Cardiology 57, 295 (1972).
- [22] L. Borland, Physics Letters A 245, 67 (1998).
- [23] S. Umarov, C. Tsallis, and S. Steinberg, Milan J. Math. 76, 307 (2008).
- [24] G. Pavlos, L. Karakatsanis, M. Xenakis, E. Pavlos, A. Iliopoulos, and D. Sarafopoulos, Physica A 395, 58 (2014).
- [25] M. Ausloos and K. Ivanova, Phys. Rev. E 68, 046122 (2003).
- [26] G. Barnaföldi, K. Ürmössy, and T. Biró, in Journal of Physics: Conference Series, Vol. 270 (IOP Publishing, 2011) p. 012008.
- [27] F. Vallianatos, Europhys. Lett. 102, 28006 (2013).
- [28] R. Bryce and K. Sprague, Sci. Rep. 2 (2012).
- [29] Y.-H. Shao, G.-F. Gu, Z.-Q. Jiang, W.-X. Zhou, and D. Sornette, Sci. Rep. 2 (2012).
- [30] C. Cerutti, C. Barres, and C. Paultre, Am. J. Physiol. Heart Circ. Physiol. 266, H1993 (1994).