Extending Fermi-LAT and H.E.S.S. Limits on Gamma-ray Lines from Dark Matter Annihilation
Abstract
Gamma-ray lines from dark matter annihilation (, where ) are always accompanied, at lower energies, by a continuum gamma-ray spectrum stemming both from radiative corrections () and from the decay debris of the second particle possibly present in the final state (). This model-independent gamma-ray emission can be exploited to derive novel limits on gamma-ray lines that do not rely on the line-feature. Although such limits are not expected to be as stringent, they can be used to probe the existence of -ray lines for dark matter masses beyond the largest energies accessible to current telescopes. Here, we use continuous gamma-ray searches from Fermi-LAT observations of Milky Way dwarf spheroidal galaxies and from H.E.S.S. observations of the Galactic Halo to extend the limits on the annihilation cross sections into monochromatic photons to dark matter masses well beyond GeV (Fermi-LAT) and TeV (H.E.S.S.). In this large mass regime, our results provide the first constraints on -ray lines from dark matter annihilation.
Key words: astroparticle physics; gamma-rays: general; gamma-rays: galaxies; line: identification; (cosmology:) dark matter
1 Introduction
Indirect searches for dark matter are one of the most promising ways to detect the dark matter particle and to determine its fundamental properties Buckley et al. (2013). Indirect signatures include searches for anomalous , , and emission produced by dark matter annihilation in astrophysical objects that could be observed over, and disentangled from, the expected backgrounds from known astrophysical emission. Gamma-ray searches Bringmann & Weniger (2012), in particular, currently provide some of the most stringent and robust constraints on the dark matter annihilation cross section into different final states Cirelli (2015).
These searches can be generically divided into three different categories:
(i) Prompt continuum emission, ranging from down to soft gamma-ray energies, from dark matter annihilation into any SM final state (e.g. or ) radiating photons, and/or producing photons as a result of hadronization of the decay products of the final-state particles (for example );
(ii) Secondary continuum emission, resulting from the radiative processes associated with stable, charged particles produced in the annihilation event (such as electrons and positrons); this emission extends from radio all the way to gamma-ray frequencies (see e.g. Colafrancesco et al. (2006); Colafrancesco et al. (2007) and Ref. Profumo & Ullio (2010) for a review)
(iii) Monochromatic (line-like) photon emission, resulting from two-body final states containing a photon, for example , , and , or from internal Bremsstrahlung Bergstrom et al. (2005a); Bergstrom et al. (2005c); Bergstrom et al. (2005b); Bringmann et al. (2008); Bringmann et al. (2011).
While the continuum emission expected from (i) and (ii) can have morphological and spectral features that would enable distinguishing a dark matter component from astrophysical diffuse emission, lines in the GeV-TeV energy range, especially if accompanied by an extended morphology11 1 Cold pulsar winds can produce gamma-ray lines, but are point-like sources Aharonian et al. (2012). Carlson et al. (2013) can be unmistakably associated with dark matter annihilation (or decay). As a result, current limits on the dark matter annihilation cross section into monochromatic photons are often more constraining than those from continuum emissions22 2 On the other hand, the pair-annihilation cross section of dark matter to two-body final states including a photon is generically suppressed by requiring the dark matter to be essentially electrically neutral..
At a dark matter mass () of GeV, for example, the Fermi-LAT constraint on –denoted in the following by – is almost three orders of magnitude stronger than that on Ackermann et al. (2015a); Ackermann et al. (2015b). But while the Fermi-LAT limits on extend all the way up to dark matter masses of 10 TeV, the limits on are restricted to , which corresponds to the largest photon energy probed by Femi-LAT collaboration in their spectral line Ackermann et al. (2015b). A similar effect occurs in the H.E.S.S. telescope beyond 20 TeV. Hence, we will refer to those energies as the detectors energy limit.
Consequently, Fermi-LAT data do not provide, at face value, limits on for dark matter masses beyond GeV. Similarly, H.E.S.S. data can only constrain for dark matter masses smaller than about TeV Abramowski et al. (2013). In other words, the energy upper limit corresponds to the maximal dark matter mass probed by these telescopes in the search for gamma-ray lines.
Monochromatic photons from dark matter annihilation, however, always produce a continuum gamma-ray spectrum that extends down to low energies. This model-independent spectrum is generated either by radiative emission Ciafaloni et al. (2011) (for ) or by the decay of the particle accompanying the photon (for and ). By exploiting this continuum spectrum, bounds on , and may be derived even for dark matter masses much larger than the energy upper limit of a given gamma-ray telescope. This simple observation, which seems to have been overlooked in the previous literature, is the basis of our work.
Although the bounds derived from this continuum spectrum are not expected to be as stringent as those based on the line-feature, they allow to extend the limits on gamma-ray lines from dark matter annihilation to masses not previously testable due to the energy range of the telescopes. In this way, available experimental data can be used to constrain in a novel and independent way the fundamental properties of the dark matter particle Yaguna (2009).
As an example, consider a 1 TeV dark matter particle pair-annihilating into photon pairs with a branching ratio. At first sight, Fermi-LAT seems to have no sensitivity to such a scenario because the signal –a -ray line with TeV– lies above the Fermi-LAT energy limit. But, the final state photons may radiate, via weak corrections, gauge bosons that will in turn give rise to a gamma-ray continuum emission within the Fermi-LAT energy range. Thus, thanks to the continuum emission associated with the lines, Fermi-LAT becomes sensitive to such a dark matter particle.
Here, we apply this idea to both Fermi-LAT and H.E.S.S. limits on continuum emission from dark matter. Specifically, we use Fermi-LAT observations of dwarf spheroidal galaxies using PASS 8 class of events Ackermann et al. (2015a) to set limits on , and for dark matter masses above 500 GeV, and H.E.S.S. observations of the Galactic center region Abramowski et al. (2011) to extend the range of limits on -ray lines to dark matter masses beyond 20 TeV. In this mass range, our results provide the first, model-independent constraints on -ray lines from dark matter annihilations.
2 Continuum emission associated with gamma-ray lines
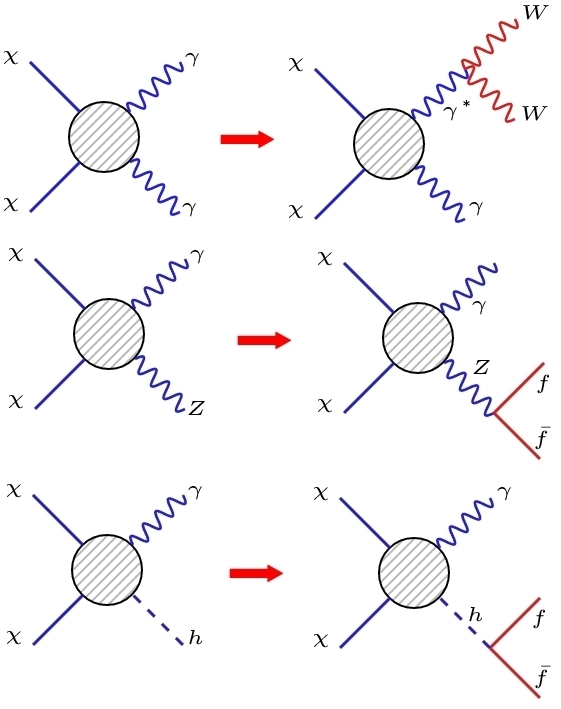 |
Gamma-ray lines from dark matter annihilation are always accompanied by a continuum spectrum at lower energies. For the and final states, this spectrum arises mostly from the decay (and subsequent hadronization of the decay products) of the and produced in association with the photons. For the final state, a continuum emission stems from radiative corrections from QED and weak interactions Ciafaloni et al. (2011). A final state photon may, for instance, radiate bosons (see figure 1), which eventually decay producing a well-known continuum gamma-ray spectrum. For the and final states this lower-energy gamma-ray emission is more pronounced since both and decays lead to sizable continuum gamma-ray emissions, as exemplified in Fig.1.
It is important to note that the continuum spectrum associated with -ray lines is model-independent, for it arises entirely from Standard Model physics. Therefore, such a spectrum can be used to probe the existence of the primary annihilation channel containing the photon. Here, we use the gamma-ray fluxes as incorporated into the PPPC Code Cirelli et al. (2011), which already include the relevant electroweak corrections Ciafaloni et al. (2011).
For the sake of illustration, we show, in figure 2, the continuum spectrum from the annihilation of dark matter into final states containing one or two monochromatic photons. The dark matter mass is assumed in the figure to be 3 TeV, whereas the primary annihilation channels were taken to be (solid green line), (dashed red line), or (dash-dotted blue line, with assumed to be a purely Standard Model-like Higgs). Notice that the shape of the spectrum is similar for all three channels but, as expected, the and final states produce many more photons than the one, which is generically suppressed by factors of order Ciafaloni et al. (2011). For this particular dark matter mass, the difference between the continuum emission and that from and amounts to one order of magnitude at most. The and final states give rise to relatively similar spectra due to the similar gamma-ray yield resulting from the and decays.
For dark matter annihilating into monochromatic photons, the differential flux of photons from a given angular direction is given by
| (1) |
where is the annihilation J-factor,
| (2) |
where is the dark matter density which is assumed be well described by a NFW profile,
| (3) |
where and are the characteristic density and scale radius determined dynamically from the maximum circular velocity and the enclosed mass contained up to the radius of maximum as discussed in Ackermann et al. (2014). The integral is performed over the line of sigh element within the solid angle . In this work we adopted the J-factors listed in the table I of Ackermann et al. (2015a) which is equivalent to Ackermann et al. (2014). As for is the differential -ray yield per annihilation into the final state , with . Since this yield is model-independent –see figure 2– gamma-ray data can be used to constrain regions in the plane vs .
In our analysis we derive limits from Fermi-LAT and H.E.S.S. data.
3 Fermi-LAT limits
The Fermi-LAT telescope has observed a wealth of dwarf spheroidal satellite galaxies of the Milky Way, which are known to be dark matter-dominated objects. The resulting data belonging to the P8R2SOURCEV6 event class, based on six years of observations, span energies between 500 MeV and 500 GeV. The collaboration makes use of the Pass-8 software which results into an improved point spread function and effective area compared to previous releases and includes the third point source Fermi-LAT catalog (3FGL). Since none of the dwarf galaxies presents any significant gamma-ray excess, tight constraints on the dark matter annihilation cross section can be placed Ackermann et al. (2015a) –see also Ahnen et al. (2016); Ahnen et al. (2016); Oman et al. (2016); Li et al. (2016); Dutta et al. (2015); Zitzer (2015); Rico et al. (2015); Bonnivard et al. (2015b); Bonnivard et al. (2015a); Hooper & Linden (2015); Geringer-Sameth et al. (2015); Drlica-Wagner et al. (2015); Baring et al. (2016); Queiroz et al. (2016).
Fermi-LAT has made publicly available33 3 http://www-glast.stanford.edu/pub_data/1048/ binned Poisson maximum-likelihood tools that can be used to reproduce the individual limits stemming from any of the dwarf galaxies in the study, without accounting for uncertainties on the J-factors of each dwarf galaxy, assumed to be described by a NFW dark matter density profile. Here we perform a joint likelihood analysis across the 15 dwarf galaxies, and treat the J-factor as a nuisance parameter, following the recipe described in the supplemental material of Ref. Ackermann et al. (2015a). In doing so, we use the likelihood of an individual dwarf i, defined as,
| (4) |
where encompasses the parameters of the DM model, i.e. the ratio of the dark matter annihilation cross section and mass, whereas refers for the set of nuisance parameters from the LAT analysis () and J-factors of the dwarf galaxies , with being the gamma-ray data. The former is provide by the Fermi-LAT team as mentioned. In order to account for the statistical uncertainties on the J-factors of each dwarf galaxy, a J-factor likelihood function is defined as follows,
where is referred as the true value of the J-factor of a dwarf galaxy , whereas is the measured J-factor with error labelled as . Then we join the likelihood terms,
| (5) |
and perform a test statistic (TS), with , which gives rise to 95% C.L. upper limit on the energy flux as explained in Rolke et al. (2005) by imposing a change in the log-likelihood of from its maximum. In order to demonstrate that our results are solid, we reproduced Fermi-LAT limits from the usual channels finding a very good agreement. See figure 3 where we show that explicitly for the channel.
With the maximum likelihood at hand, we feed a given gamma-ray spectrum, here the low-energy continuum from , and , and we obtain a bound on the annihilation cross section arising from the gamma-ray continuum emission from a stack of 15 dwarfs.
Our results are summarized in Fig. 4. It shows the C.L. limits on the thermally averaged, zero-temperature pair-annihilation cross section to , for . As previously discussed, the annihilation final states and yield similar gamma-ray emission, and consequently nearly equivalent limits, whereas pure annihilation into photon pair is less constraining due to the lower associated continuum emission level. For reference, we display in this figure the current bounds on gamma-ray lines reported by the Fermi-LAT Ackermann et al. (2015b) and H.E.S.S. collaborations (dotted black lines).
In addition, the unitarity bound on the size of the pair-annihilation cross section Griest & Kamionkowski (1990) (dashed black line) is also shown. This bound, derived via partial-wave unitarity, sets a model-independent upper limit on the annihilation rate of the dark matter particles. Today, this upper limit amounts, for s-wave annihilation, to Beacom et al. (2007), where was used for the velocity of the dark matter particles. Only the region below the dashed black line is thus consistent with unitarity.
Our new limits, though not as stringent as those based on the line-feature, provide the first Fermi-LAT constraints on gamma-ray lines from dark matter annihilation for GeV. Even if these limits are weaker than (or consistent with) the current H.E.S.S. limits Abramowski et al. (2013), they constitute a new and independent limit on gamma-ray lines that is based on a different astrophysical target and that relies entirely on Fermi-LAT data.
4 H.E.S.S. limits
In Abramowski et al. (2011), the H.E.S.S. collaboration presented their latest results on the search for a dark matter annihilation signal from the Galactic Center Halo, which are based on 112 hours of GC observations taken over a period of about four years. In their analysis, H.E.S.S. divides the sky into background and source regions, with the former located further away from the Galactic plane, where a dark matter signal is expected to be dimmer. The source region used in Abramowski et al. (2011) was a circular region of radius from which Galactic latitudes were removed to reduce the possible contamination of the dark matter signal by local -ray sources. Since no excess emission was found by H.E.S.S., restrictive limits were placed on the dark matter annihilation cross section, which are among the most stringent for dark matter masses above GeV.
By integrating Fig.3 of Ref. Abramowski et al. (2011) multiplied by observation time, effective area, and J-factor we can compute the number of signal events for the ON () and OFF () regions as well as the number of background () events for the OFF regions. ON region refers to the circular region around the Galactic Center, whereas the OFF regions are the represented by annulus of radii of and as delimited in Fig.2 of Abramowski et al. (2011) 44 4 The J-factors are given in the H.E.S.S. paper and the effective area was obtained using the code gammapy code https://gammapy.readthedocs.io/en/latest/, which offers quite good agreement with the effective area made public in several PhD thesis from H.E.S.S. members (e.g. https://www.physik.hu-berlin.de/de/eephys/HESS/theses/pdfs/ArneThesis.pdf). We can then define likelihood functions as described in Lefranc & Moulin (2015) and compute 95% C.L. limits similarly to the procedure discussed for Fermi-LAT. In Fig.5 for concreteness we compare our limit with the one obtained by H.E.S.S. collaboration. The limits are for dark matter annihilations into all quarks using the parametric energy spectrum as defined in Hill et al. (1987); Tasitsiomi & Olinto (2002). From Fig.5 it is clear that our analysis finds a very good agreement with H.E.S.S. result.
After this cross-check, we computed the 95% C.L. bound on annihilation cross section vs dark matter mass plane for the channels , and , using a NFW profile, similarly to Abramowski et al. (2011). Our results are summarized in Fig. 6. Since a 100 TeV dark matter particle annihilating into still produces some appreciable amount of continuum gamma-rays below 20 TeV, H.E.S.S. can still probe the properties of such a dark matter particle. To the best of our knowledge, these are the first limits on gamma-ray lines from dark matter annihilation for TeV.
While the new limits we have derived, both from Fermi-LAT and H.E.S.S., on the dark matter annihilation cross sections into monochromatic photons are above the typical cross sections needed to produce dark matter in the early universe as a thermal relic, they are applicable for example to dark matter models where the production mechanism is non-thermal Gelmini et al. (2006), or where a modified expansion rate occurs at the time of decoupling (see e.g. Profumo & Ullio (2003) and references therein). These two possibilities are especially interesting in the large-mass region that our limits cover.
5 Conclusions
In this study we demonstrated that the continuum spectrum associated with -ray lines from dark matter annihilation can be used, in conjunction with currently available data, to set new constraints on the dark annihilation cross section into monochromatic photons over a very broad range of dark matter particle masses. This continuum spectrum is model independent, and arises from radiative corrections or from the decay of the particle accompanying the photon –a Higgs boson or a . Using limits from six years of Fermi-LAT observations of local dwarf galaxies with PASS-8, we extended current Fermi-LAT limits on , and to dark matter masses well beyond GeV (Fermi-LAT energy upper limit); similarly, using H.E.S.S. observations of the Galactic Halo, we extended the corresponding H.E.S.S. limits to dark matter masses larger than TeV. At these very large masses, our limits provide the first constraints on gamma-ray lines from dark matter annihilation.
Acknowledgements
We thank Fermi-LAT Collaboration for the public data and tools used in this work. We are also grateful to the PPPC team for making their code publicly available. We thank Christoph Weniger for discussions. CY is supported by the Max Planck Society in the project MANITOP. SP is partly supported by the US Department of Energy, Contract DE-SC0010107-001.
References
- Abramowski et al. (2011) Abramowski A., et al., 2011, Phys. Rev. Lett., 106, 161301
- Abramowski et al. (2013) Abramowski A., et al., 2013, Phys. Rev. Lett., 110, 041301
- Ackermann et al. (2013) Ackermann M., et al., 2013, Phys. Rev., D88, 082002
- Ackermann et al. (2014) Ackermann M., et al., 2014, Phys.Rev., D89, 042001
- Ackermann et al. (2015a) Ackermann M., et al., 2015a, Phys. Rev. Lett., 115, 231301
- Ackermann et al. (2015b) Ackermann M., et al., 2015b, Phys. Rev., D91, 122002
- Aharonian et al. (2012) Aharonian F., Khangulyan D., Malyshev D., 2012, Astron. Astrophys., 547, A114
- Ahnen et al. (2016) Ahnen M. L., et al., 2016, JCAP, 1602, 039
- Baring et al. (2016) Baring M. G., Ghosh T., Queiroz F. S., Sinha K., 2016, Phys. Rev., D93, 103009
- Beacom et al. (2007) Beacom J. F., Bell N. F., Mack G. D., 2007, Phys. Rev. Lett., 99, 231301
- Bergstrom et al. (2005a) Bergstrom L., Bringmann T., Eriksson M., Gustafsson M., 2005a, Phys. Rev. Lett., 94, 131301
- Bergstrom et al. (2005b) Bergstrom L., Bringmann T., Eriksson M., Gustafsson M., 2005b, Phys. Rev. Lett., 95, 241301
- Bergstrom et al. (2005c) Bergstrom L., Bringmann T., Eriksson M., Gustafsson M., 2005c, JCAP, 0504, 004
- Bonnivard et al. (2015a) Bonnivard V., et al., 2015a, Mon. Not. Roy. Astron. Soc., 453, 849
- Bonnivard et al. (2015b) Bonnivard V., et al., 2015b, Astrophys. J., 808, L36
- Bringmann & Weniger (2012) Bringmann T., Weniger C., 2012, Phys. Dark Univ., 1, 194
- Bringmann et al. (2008) Bringmann T., Bergstrom L., Edsjo J., 2008, JHEP, 01, 049
- Bringmann et al. (2011) Bringmann T., Calore F., Vertongen G., Weniger C., 2011, Phys. Rev., D84, 103525
- Buckley et al. (2013) Buckley J., et al., 2013, in Community Summer Study 2013: Snowmass on the Mississippi (CSS2013) Minneapolis, MN, USA, July 29-August 6, 2013. (arXiv:1310.7040), http://inspirehep.net/record/1262275/files/arXiv:1310.7040.pdf
- Carlson et al. (2013) Carlson E., Linden T., Profumo S., Weniger C., 2013, Phys. Rev., D88, 043006
- Ciafaloni et al. (2011) Ciafaloni P., Comelli D., Riotto A., Sala F., Strumia A., Urbano A., 2011, JCAP, 1103, 019
- Cirelli (2015) Cirelli M., 2015, 1511.02031
- Cirelli et al. (2011) Cirelli M., et al., 2011, JCAP, 1103, 051
- Colafrancesco et al. (2006) Colafrancesco S., Profumo S., Ullio P., 2006, Astron. Astrophys., 455, 21
- Colafrancesco et al. (2007) Colafrancesco S., Profumo S., Ullio P., 2007, Phys. Rev., D75, 023513
- Drlica-Wagner et al. (2015) Drlica-Wagner A., et al., 2015, Astrophys. J., 809, L4
- Dutta et al. (2015) Dutta B., Gao Y., Ghosh T., Strigari L. E., 2015, Phys. Rev., D92, 075019
- Gelmini et al. (2006) Gelmini G., Gondolo P., Soldatenko A., Yaguna C. E., 2006, Phys. Rev., D74, 083514
- Geringer-Sameth et al. (2015) Geringer-Sameth A., Walker M. G., Koushiappas S. M., Koposov S. E., Belokurov V., Torrealba G., Evans N. W., 2015, Phys. Rev. Lett., 115, 081101
- Griest & Kamionkowski (1990) Griest K., Kamionkowski M., 1990, Phys.Rev.Lett., 64, 615
- Hill et al. (1987) Hill C. T., Schramm D. N., Walker T. P., 1987, Phys. Rev., D36, 1007
- Hooper & Linden (2015) Hooper D., Linden T., 2015, JCAP, 1509, 016
- Lefranc & Moulin (2015) Lefranc V., Moulin E., 2015, in Proceedings, 34th International Cosmic Ray Conference (ICRC 2015). (arXiv:1509.04123), http://inspirehep.net/record/1393231/files/arXiv:1509.04123.pdf
- Li et al. (2016) Li S., et al., 2016, Phys. Rev., D93, 043518
- Oman et al. (2016) Oman K. A., Navarro J. F., Sales L. V., Fattahi A., Frenk C. S., Sawala T., Schaller M., White S. D. M., 2016, Phys. Rev.
- Profumo & Ullio (2003) Profumo S., Ullio P., 2003, JCAP, 0311, 006
- Profumo & Ullio (2010) Profumo S., Ullio P., 2010, 1001.4086
- Queiroz et al. (2016) Queiroz F. S., Yaguna C. E., Weniger C., 2016, JCAP, 1605, 050
- Rico et al. (2015) Rico J., Wood M., Drlica-Wagner A., Aleksić J., 2015, in Proceedings, 34th International Cosmic Ray Conference (ICRC 2015). (arXiv:1508.05827), http://inspirehep.net/record/1389141/files/arXiv:1508.05827.pdf
- Rolke et al. (2005) Rolke W. A., Lopez A. M., Conrad J., 2005, Nucl. Instrum. Meth., A551, 493
- Tasitsiomi & Olinto (2002) Tasitsiomi A., Olinto A. V., 2002, Phys. Rev., D66, 083006
- Yaguna (2009) Yaguna C. E., 2009, Phys. Rev., D80, 115002
- Zitzer (2015) Zitzer B., 2015, in Proceedings, 34th International Cosmic Ray Conference (ICRC 2015). (arXiv:1509.01105), http://inspirehep.net/record/1391628/files/arXiv:1509.01105.pdf