Modeling Precursors for Event Forecasting
via Nested Multi-Instance Learning
Abstract
Forecasting events like civil unrest movements, disease outbreaks, financial market movements and government elections from open source indicators such as news feeds and social media streams is an important and challenging problem. From the perspective of human analysts and policy makers, forecasting algorithms need to provide supporting evidence and identify the causes related to the event of interest. We develop a novel multiple instance learning based approach that jointly tackles the problem of identifying evidence-based precursors and forecasts events into the future. Specifically, given a collection of streaming news articles from multiple sources we develop a nested multiple instance learning approach to forecast significant societal events across three countries in Latin America. Our algorithm is able to identify news articles considered as precursors for a protest. Our empirical evaluation shows the strengths of our proposed approaches in filtering candidate precursors, forecasting the occurrence of events with a lead time and predicting the characteristics of different events in comparison to several other formulations. We demonstrate through case studies the effectiveness of our proposed model in filtering the candidate precursors for inspection by a human analyst.
1 Introduction
Forecasting societal uprisings, civil unrest movements, and terror threats is an important and challenging problem. Open source data sources (e.g., social media and news feeds) have been known to serve as surrogates in forecasting a broad class of events, e.g., disease outbreaks [1], election outcomes [18, 22], stock market movements [6] and protests [19]. While many of these works focus on predictive performance, there is a critical need to develop methods that also yield insight by identifying precursors to events of interest.
This paper focuses on the problem of identifying precursors (evidence) for forecasting significant societal events. Modeling and identifying the precursors for a given protest is useful information for the human analyst and policy makers as it discerns the underlying reasons behind a civil unrest movement. Specifically, the objective of this study is to forecast protest across different cities in three Latin American countries (Argentina, Brazil and Mexico). 6000 news outlets are tracked daily across these countries with the goal of forecasting the occurrence of a protest with atleast one day of lead time. From the news feeds, we also aim to identify the specific news articles that can be considered as precursors for the targer event.
We formulate the precursor identification and forecasting problem within a novel multiple instance learning algorithm (MIL). Multiple instance learning algorithms [3, 28] are a class of supervised learning techniques that have labels for a group of instances, but not for individual instances. We make a similar mapping for the group of collected news articles to have no individual class label associated with every news article but the group of news articles are attached with a label indicating the occurrence of a protest. We extend the standard MIL algorithm by introducing a nested structure, where we group news articles published in a given day at the first level and then group the collection of individual days at the second level. This nested MIL approach allows for modeling the sequential constraints between the news articles (grouped by days) published on different days and also provides a probabilistic estimate for every news article and the collection of news article. This estimate is signficant because it indicates for a given news article the probability of it signaling a protest event. Note, in our datasets we do not have any training labels to indicate the protest indicator per news article.
Figure 1 shows an example of precursors detected by our model. On the right of the timeline, is a news report about a protest event in Argentina. The connected dots denotes the generated probability of this day being positive. From this example, we find that within 10 days before the event, there are multiple similar reported events that were selected as highly probable leading indicators or evidence. Most of planned societal events are a consequence of several factors that affect the different entities within communities and their relationships with each other (or the government) over time. In this specific example, the leading precursor some days before the protest was an article commenting on standards of living in Argentina and rising poverty levels. The International Court of Justice also provided a verdict on the debt crisis. All these factors led to the final protest where general population demanding work opportunities.

The main contributions of this study are summarized as follows:
- 1.
A novel nested framework of multi-instance learning for event forecasting and precursor mining. We formulate event forecasting and precursor mining for multiple cities in a country as a multi-instance learning problem with a nested structure. By estimating a prediction score for each instance in the history data, we automatically detect significant precursors for different events.
- 2.
Harness temporal constraints in multi-instance learning. We explore different penalty function and regularizations where we employ the temporal information in our dataset under assumption that most events of interest are follow-up reports of other events that happened before, and most planned events are developing over time.
- 3.
Modeling for various event categories in multiple geo-locations. We extend the nested MIL formulation for general purpose multi-class classification to determine necessary attributes of events in terms of their underlying population.
- 4.
Application and evaluation with comprehensive experiments. We evaluate the proposed methods using news data collected from July 2012 to December 2014 in three countries of Latin America: Argentina, Mexico, and Brazil. For comparison, we implement other multi-instance algorithms, and validate the effectiveness and efficiency of the proposed approach. We also perform qualitative and quantitative analysis on the precursors inferred by our model.
The rest of this paper is organized as follows. We discuss related work in Section 2. Section 3 introduces the problem setup and our proposed model based on Multi-Instance Learning is presented in Section 4. This section is then followed by experiments and evaluations on real world datasets presented in Section 5 and Section 6 . Finally, we concludes with a summary of the research in Section 7.
2 Related Work
Event Detection and Forecasting. Event detection and forecasting from online open source datasets has been an active area of research in the past decade. Both supervised and unsupervised machine learning techniques have been developed to tackle different challenges. Linear regression models use simple features to predict the occurrence time of future events [4, 6, 10, 18]. Advanced techniques use a combination of sophisticated features such as topic related keywords, as input to support vector machines, LASSO and multi-task learning approaches [23, 20]. Ramakrishnan et al. [19] designed a framework (EMBERS) for predicting civil unrest events in different locations by using a wide combination of models with heterogeneous input sources ranging from social media to satellite images. Zhao et al. [27] combine multi-task learning and dynamic features from social networks for spatial-temporal event forecasting. Generative models have also been used in [26] to jointly model the temporal evolution in semantics and geographical burstiness within social media content. Laxman et al. [13] designed a generative model for categorical event prediction in event streams using frequent episodes. However, few existing approaches provide evidence and interpretive analysis as support for event forecasting.
Identifying Precursors. Identifying precursors for significant events is an interesting topic and has been used extensively for interpretive narrative generation and in storytelling algorithms [11]. Rong et al. [21] developed a combinational mixed Poisson process (CMPP) model to learn social, external and intrinsic influence in social networks.
Multiple Instance Learning. In the multiple instance learning (MIL) paradigm, we are given labels for sets of instances commonly referred as bags or groups. However, individual instance-level labels are unknown or missing. The bag-level labels are assumed to be an association function (e.g., OR, average) of the unknown instance level labels. One approach to MIL adapts support vector machines (SVMs) by: (i) modifying the maximum margin formulation to discriminate between bags rather than individual instances [3], and (ii) developing kernel functions that operate directly on bags [9]. Other multiple instance learning approaches and various applications are found in a detailed survey [2]. Specifically, the generalized MIL [25] formulation assumes the presence of multiple concepts and a bag is classified as positive if there exists instances from every concept. Relevant to our work, besides predicting bag labels, Liu et al. [15] seek to identify the key instances within the positively-labeled bags using nearest neighbor techniques. Recent work [12] has focused on instance-level predictions from group labels (GICF) and allowed for the application of general aggregation functions with applications to detecting sentiments associated with sentences within reviews.
The methods proposed in this paper can be viewed as complementary to prior work, casting the forecasting and precursor discovery problems within novel extensions of multiple instance learning.
3 Problem Formulation
| Variable | Meaning |
|---|---|
| a set of super bags in our dataset | |
| an ordered set of “bags” in | |
| a set of instances with =, number of instance in a bag | |
| the -th instance in set , a V-dimension vector | |
| label of super bag | |
| estimated probability for a super bag | |
| the probability of bag in super bag to be positive | |
| the probability of an instance in bag in super bag to be positive | |
| multi-class label of super bag |
Given, a collection of streaming media sources (e.g., news feeds, blogs and social network streams), the objective of our study is to develop a machine learning approach to forecast the occurrence of an event of interest in the near future. Specifically, we focus on forecasting “protests” or civil unrest movements in Latin America from a daily collection of published news articles. Besides forecasting the protest, we want to identify the specific news articles from the streaming news outlets that can be considered as supporting evidence for further introspection by an intelligence analyst. We refer to these identified articles as precursors for a specific protest.
Figure 2 provides an overview of our proposed approach and problem formulation. We show groups of news articles collected daily, five days prior to the specific protest event (being forecast). Within our proposed MIL-based formulation, each news article is an individual instance, the collection of news articles published on a given day is a bag, and the ordered collection of bags (days) is denoted by super-bag (explained in detail later). For this study, each individual news article is represented by a distributed representation for text derived using deep learning framework and text embeddings [14]. Figure 2 shows that for certain days within the collection we attempt to identify news articles (highlighted) that are considered as precursors from the entire collection of input news articles used for forecasting the occurrence of a specific target.
3.1 Formal Definition and Notations
For a given protest event occurring on day , we assume that for each day before the event we are tracking a multitude of news sources. We represent the collection of news articles published on a given day by , where the -th news article is represented by . The ordered collection of news articles for the protest event up to day can be represented as a super-bag, . The occurrence of the protest event at time is denoted by where denotes a protest and , otherwise.
The forecasting problem can be formulated as learning a mathematical function that maps the input, ordered collection of news articles extracted per day to a protest indicator days in the future from the day . To identify the news articles considered as precursors (evidence), we want to estimate a probability for each news article on any given day that signifies the occurrence of a given protest. For a news article , we denote this estimated probability value by . As such, given the collection of news articles we identify the precursor set as the ones with greater than a fixed threshold . We represent this precursor set of documents as a subset of the original super-bag, given by . As a secondary objective, we want to forecast the occurrence of an event with a long lead time i.e., large values of . Table 1 captures the notations and definitions used in this study.
4 Methods
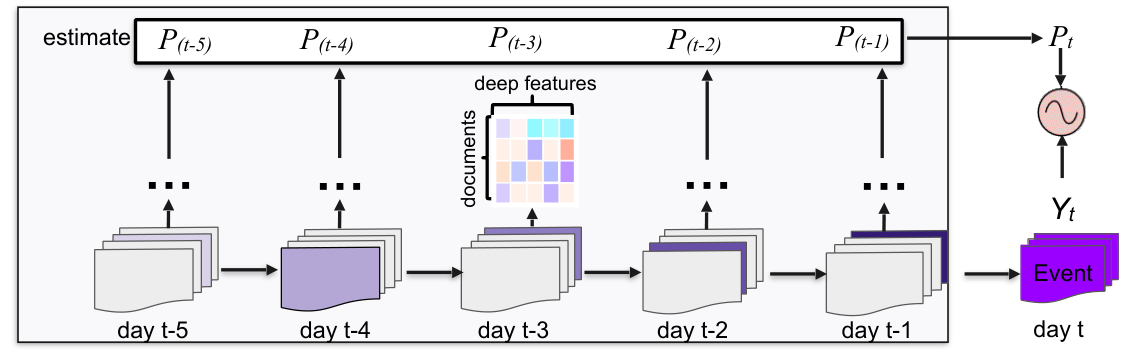
We first provide our intuition behind formulating the precursor discovery and forecasting problem within a novel extension of multiple instance learning algorithm. Parallel to the standard multiple instance learning algorithms we have a group of news articles (bags) with labels available only for the entire bag (i.e., leading to a protest); and one of the objectives is to train a classifier to predict the bag-level label. In addition to predicting the group-level labels, we also care about predicting the labels for individual news articles (instances) since, they signify the precursor. Various MIL formulations extend this approach to estimate the key instances within a bag or provide instance-level labels. However, our problem setting has a two-level grouping structure with sequential constraints i.e., we capture news articles per day (bags) and group the days to form a super-bag with labels only available at the super-bag level. As such, we propose nested multiple instance learning formulations for predicting the super bag level labels (forecast), and then estimate the bag-level and instance-level probabilities for identifying association of the bag and instance with the event, respectively. We developed various extensions of our proposed approach, that tie the different sequential and group constraints.
4.1 Nested MIL model (nMIL )
We model the instance level probability estimates for a news article on day to associate with a targeted event with a logistic function. This probability estimates indicate how related the specific instance is to the target event, . Higher the probability value, the more related the document is to the target event and most probably represents a precursor that contains information about causes of the target event.
| (1) |
Here, denotes the learned weight vector for our model. The probability for a day (or bag) is then modeled as the average of probability estimates of all instances in a day [12]. Hence, for each bag:
| (2) |
where is an aggregation function.
We then model the probability of a super-bag (associated with an event ) being positive as the average of the probability of all bags within the super bag to be positive (related to the target event). Thus:
| (3) |
For a given super bag , as all the bags within it are temporally ordered, the probability estimates for a given bag (day) is assumed to be similar to its immediate predecessor. This consistency in consecutive bag probabilities is modeled by minimizing the following cross-bag cost as below:
| (4) |
Finally, given a set of true labels for the super bags, we can train our model by minimizing the following cost function w.r.t to :
| (5) | ||||
Here,
is the negative log-likelihood function that penalizes the difference between prediction and the true label for super bag where is the indicator function.
is the cross-bag cost defined in Equation. 4
represents the instance level cost. Here, sgn is the sign function; is a crucial margin parameter used to separate the positive and negative instances from the hyper line in the feature space; is a threshold parameter to determine positiveness of instance.
is the regularization function.
, are constants that control the trade-offs between the loss function and regularization function.
4.1.1 Cross-bag Similarity (nMIL)
The cross-bag similarity in the above equation does not allow for sudden changes in the day-level probabilities caused due to newer events happening on the current day. We update the cost function across days (bags) (Equation 4) as follows:
| (6) |
The objective function above allows for label information to spread over the manifold in the feature-space. As such, we compute as the pairwise cosine similarity between the news articles in and . Since, we do not have ground truth labels for the bag level (day) we make this consistency assumption that estimated probabilities for consecutive days should be similar if the news articles have similarity in the feature space as well. This model is referred by nMILand allows for sudden changes in how events unfold.
4.2 Sequential Model (nMIL)
The basic nMIL models assume that there exists a single weight vector across all the days (bags) within a super bag. To model the sequential characteristics of the articles published across consecutive days, we extend this formulation by learning individual weight vectors for each of the historical days. Assuming days within a super bag we learn a weight vector for each individual day represented as ; where is the weight vector learned for day . In this setting, the individual weight vectors are still learned together in a joint fashion as the Multiple-Task Learning approaches [7]. However, the probability of a news article on day will be given by . The is formulation is called nMILand given by:
| (7) | ||||
Just like the Multi-Task learning algorithms, the regularization term can be modified to capture the various relationship-based constraints. However, in this study we ignore these specialized approaches focusing only on the MIL paradigm.
4.3 Multiclass Classification
We also extend our developed nMIL formulations to solve general purpose multiclass classification problems rather than binary classification problems. Within our domain, each labeled event is manually attached with two attributes: event type and event population. Event type provides information about the nature of the event. Event population indicates the size/community of people who participated in the protest event.
For the multiclass classification problems, we train one-versus-rest classifiers for each of the classes learning a separate weight vector per class. When classifying a super bag to a specific event type/population we first forecast the binary protest indicator label for a super bag. Next, we apply the multi-class classification only on the predicted positive examples.
4.4 Optimization
We perform online stochastic gradient decent optimization to solve our cost function and test our model on new data to predict super bag label. For every iteration in our algorithm, we randomly choose a super-bag from the training dataset by picking an index using a standard uniform distribution. Then we optimize an approximation based on the sampled super-bag by:
| (8) |
The gradient of the approximate function is given by:
| (9) | ||||
where . We update the weight vector using a varied learning rate and using mini-batch stochastic gradient descent.
4.5 Precursor discovery using nMIL
In the nMIL model, each super-bag consists of an ordered set of bags and each bag represents the documents in one day in the city for which we are forecasting a protest event. We present in Algorithm 1 the steps to identify news articles as precursors based on their estimated probability given by .
5 Experiments
5.1 Datasets
The experimental evaluation was performed on news documents collected from around 6000 news agencies between July 2012 to December 2014 across three countries in South America including Argentina, Brazil and Mexico. For Argentina and Mexico, the input news articles were mainly in Spanish and for Brazil, the news articles were in Portuguese.
The ground truth information about protest events, called gold standard report (GSR) is exclusively provided by MITRE [19]. The GSR is a manually created list of civil unrest events that happened during the period 2012-2014. A labeled GSR event provides information about the geographical location at the city level, date, type and population of a civil unrest news report extracted from the most influential newspaper outlets within the country of interest. These GSR reports are the target events that are used for validation of our forecasting algorithm, and also used for analyzing the identified precursors. We have no ground truth available for verifying the validity of the precursors.
Argentina: We collected data for Argentina from newspaper outlets including Clarin and Lanacion from the period of July 2010 to December 2014. There are multiple protest events that happened in Argentina during that time. For instance, people protested against the government and utility/electricity-providing companies because of heatwaves in Dec. 2013.
Brazil: For Brazil, we obtained data from news agencies including the three leading news agencies in Brazil; O Globo, Estadao, and Jornal do Brasil from November 2012 to September 2013. During this period Brazil faced several mass public demonstrations occurred across several Brazilian cities stemming from a variety of issues ranging from transportation costs, government corruption and police brutality. These mass protests were initiated due to a local entity advocating for free public transportation. This period had an unusually high social media activity and news coverage and is also known as the ‘‘Brazilian Spring” 11 1 http://abcnews.go.com/ABC_Univision/brazilian-spring-explainer/story?id=19472387.
Mexico: For Mexico, we tracked news agencies including the top outlets: Jornada, Reforma, Milenio from January 2013 to December 2014. Over 619 days, we noticed 71 news articles per day on average. There were more than 2000 protest events in this two-year period with major unrest movements in 2013 was led by teachers and students demanding education reform by protesting against the government.
5.2 Experimental Protocol
The GSR signifies the occurrence of a protest event on a given day at a specific location. To evaluate the MIL-based forecasting and precursor discovery algorithms, for each protest event we extract all the published news articles for up to 10 days before the occurrence of the specific event. This ordered collection of per-day news documents up to the protest day are considered as positive super bags. For negative samples, we identify consecutive sets of five days within our studied time periods for the different countries when no protest was reported by the GSR. The ordered collection of per-day news documents not leading to a protest are considered as negative super bags for the nMIL approach. For any news article (i.e., an individual instance) within a positive/negative super-bag we have no label (or ground truth). As part of the precursor discovery algorithm, we estimate a probability for an individual instance to signal a protest (by showing evidence). It is important to note that the GSR linked news article for a protest is never used for training purposes. Having identified the positive and negative samples, we split our datasets into training and testing partitions and perform 3-fold cross-validation.
We study the performance of forecasting models with varying lead time days and varying historical days. Lead time () indicates the days in advance the model makes predictions and historical days () is the number of days over which the news articles are extracted as input to the prediction algorithms. As an example, if is set to 1, then the model forecasts if a protest event is planned for the next day. Setting the historical days, to 5 denotes that we use news from five days before the current day to make the forecast. We varied from 1 to 5 and from 1 to 10 and trained 50 different models for the different approaches to study the characteristics of the developed approaches with varying lead time and historical days.
For event forecasting, we evaluate the performance by the standard metrics including precision, recall, accuracy and F1-measure.
5.3 Comparative Approaches
We compare the proposed nMIL models to the following approaches:
- •
SVM : We use the standard support vector machine formulation [8] by collapsing the nested grouping structure and assigning the same label for each news article as it’s super-bag (for training). During the prediction phase, the SVM yields the final super-bag prediction (forecast) by averaging the predicted label obtained for each of the instances.
- •
MI-SVM [3]: The MI-SVM model extends the notion of a margin from individual patterns to bags. Notice that for a positive bag the margin is defined by the margin of the “most positive” instance, while the margin of a negative bag is defined by the “least negative” instance. In our case, we collapse the news articles from the different historical days into one bag and apply this standard MIL formulation.
- •
Relaxed-MIL (rMILnor ) [24]: Similar to the MI-SVM baseline, we collapse the news articles into one bag. However, unlike the MI-SVM formulation the rMILnor can provide a probabilistic estimate for a given document within a bag to be positive or negative.
- •
Modified Relaxed-MIL (rMILavg ): This approach is similar to the rMILnor , except we compute the probability of a bag being positive by taking average of estimate of each instance in the bag rather than using the Noisy-OR model discussed above.
- •
GICF [12]: This model optimizes a cost function which parameterized the whole-part relationship between groups and instances and pushes similar items across different groups to have similar labels.
5.4 Feature Description
In practice, finding good feature representations to model the news articles is not a trivial problem. Traditionally the bag of words representation allows for easy interpretation but also needs pre-processing and feature selection. Several researchers have developed efficient and effective neural network representations for language recently [5, 16, 17]. Specifically, we learn deep features for documents by taking advantage of the existing doc2vec model. For each document, we generate a dimension vector for training with contextual window size of 10 in an unsupervised version. We compared the performance of deep features with traditional TF-IDF features but the results showed little difference. Thus, we only report the evaluation of models with deep features.
6 Results and Discussion
In this section, we evaluate the performance of the proposed models. Firstly, we evaluate the effectiveness and efficiency of the methods on real data in comparison with baseline methods on multiple configurations of forecasting tasks. Then, we study and analyze the quality of precursors with respect to quantitative and qualitative measures. Multi-class forecasting evaluation is also provided for one of the countries. At last, we perform a sensitivity analysis of performance regarding parameters in the proposed model.
| Method | Argentina | Brazil | Mexico | |||
|---|---|---|---|---|---|---|
| Acc | F-1 | Acc | F-1 | Acc | F-1 | |
| SVM | 0.611(0.034) | 0.406(0.072) | 0.693(0.040) | 0.598(0.067) | 0.844(0.062) | 0.814(0.091) |
| MI-SVM | 0.676(0.026) | 0.659(0.036) | 0.693(0.040) | 0.503(0.087) | 0.880(0.025) | 0.853(0.040) |
| rMILnor | 0.330(0.040) | 0.411(0.092) | 0.505(0.012) | 0.661(0.018) | 0.499(0.009) | 0.655(0.025) |
| rMILavg | 0.644(0.032) | 0.584 (0.055) | 0.509(0.011) | 0.513(0.064) | 0.785(0.038) | 0.768(0.064) |
| GICF | 0.589(0.058) | 0.624(0.048) | 0.650(0.055) | 0.649 (0.031) | 0.770(0.041) | 0.703(0.056) |
| nMIL | 0.709(0.036) | 0.702(0.047) | 0.723(0.039) | 0.686 (0.055) | 0.898(0.031) | 0.902(0.030) |
| nMIL | 0.708(0.039) | 0.714(0.034) | 0.705(0.048) | 0.698(0.045) | 0.861(0.014) | 0.868(0.014) |
| nMIL | 0.687(0.038) | 0.680(0.045) | 0.713(0.028) | 0.687(0.038) | 0.871(0.013) | 0.879(0.014) |
6.1 How well does the nMIL forecast protests?
6.1.1 Comparative Evaluation.
Table 2 reports the prediction performance of the nMIL approach in comparison to other baseline approaches for the task of forecasting protests. Specifically, we use set , , and and report the average accuracy and F1 score along with standard deviation for predicting protests across multiple runs of varying historical days with lead time set to 1. We observe that the nMIL approaches outperform the baseline approaches across all the three countries. The rMILnor approach performs poorly because the the noisy-or aggregation function associating the bag-level labels to instance-level labels forces most of the news articles within the positive bags to have probability values close to 1. However, given the large collection of news articles available per day only a subset of them will indicate signals/evidence for a protest. For Argentina, the nMIL and nMILapproaches outperformed the best baseline (MI-SVM ), by 7% and 8% with respect the average F1 score, respectively.
Figure 3 shows the changes to F1 score for the proposed nMIL approach in comparison to SVM , MI-SVM and rMILavg for different number of historical days that are used in training with lead time set to 2. We trained 10 different models that use different number of historical days respectively varying from 1 to 10. These results show the methods that utilize the nested structure (nMIL) within the multi-instance learning paradigm, generally performed better than others. Moreover, the proposed nMILmodels performed well consistently across different countries with different number of history days.
6.1.2 How early can the nMIL forecast?
| Country | Argentina | Brazil | Mexico | |||||||||||||
|---|---|---|---|---|---|---|---|---|---|---|---|---|---|---|---|---|
| History Days | 1 | 2 | 3 | 4 | 5 | 1 | 2 | 3 | 4 | 5 | 1 | 2 | 3 | 4 | 5 | |
| Leadtime 1 | rMILavg | 0.719 | 0.714 | 0.690 | 0.710 | 0.705 | 0.717 | 0.692 | 0.696 | 0.662 | 0.680 | 0.815 | 0.803 | 0.789 | 0.796 | 0.873 |
| nMIL | 0.745 | 0.735 | 0.722 | 0.691 | 0.716 | 0.734 | 0.768 | 0.721 | 0.735 | 0.717 | 0.842 | 0.868 | 0.863 | 0.884 | 0.884 | |
| Leadtime 2 | rMILavg | 0.659 | 0.624 | 0.554 | 0.665 | 0.500 | 0.695 | 0.651 | 0.573 | 0.672 | 0.565 | 0.846 | 0.875 | 0.860 | 0.878 | 0.912 |
| nMIL | 0.664 | 0.675 | 0.740 | 0.710 | 0.751 | 0.699 | 0.611 | 0.738 | 0.639 | 0.721 | 0.825 | 0.889 | 0.914 | 0.909 | 0.886 | |
| Leadtime 3 | rMILavg | 0.674 | 0.606 | 0.622 | 0.543 | 0.578 | 0.694 | 0.682 | 0.620 | 0.715 | 0.622 | 0.819 | 0.787 | 0.808 | 0.750 | 0.853 |
| nMIL | 0.649 | 0.669 | 0.560 | 0.669 | 0.737 | 0.687 | 0.639 | 0.674 | 0.717 | 0.742 | 0.856 | 0.903 | 0.884 | 0.909 | 0.900 | |
| Leadtime 4 | rMILavg | 0.656 | 0.558 | 0.588 | 0.556 | 0.476 | 0.729 | 0.712 | 0.720 | 0.628 | 0.621 | 0.809 | 0.822 | 0.798 | 0.878 | 0.772 |
| nMIL | 0.676 | 0.693 | 0.670 | 0.712 | 0.631 | 0.754 | 0.584 | 0.736 | 0.735 | 0.725 | 0.872 | 0.888 | 0.894 | 0.916 | 0.874 | |
| Leadtime 5 | rMILavg | 0.669 | 0.676 | 0.590 | 0.567 | 0.575 | 0.710 | 0.588 | 0.616 | 0.548 | 0.570 | 0.828 | 0.845 | 0.810 | 0.733 | 0.889 |
| nMIL | 0.626 | 0.676 | 0.687 | 0.773 | 0.737 | 0.683 | 0.665 | 0.657 | 0.697 | 0.735 | 0.833 | 0.937 | 0.878 | 0.935 | 0.931 | |
In order to study the changes of performance with and without the nested structure, we show the F1 score with varying lead times and historical days from 1 to 5 for rMILavg and nMIL models in Table 3, respectively. We observe that with larger lead time (i.e., forecasting earlier than later), the nMIL model does not necessary lose forecasting accuracy; but is sometimes even better. This can be explained by the fact that several times protests are planned a few days in advance and that civil unrest unfold as a series of actions taken by multiple participating entities over a sequence of days. As the lead time increases, F1 score for forecasting initially drops and then increases back. This behavior is also noted in prior work by Ramakrishnan et. al [19], which includes protest related data from these countries. In comparison to the nMIL model, the rMILavg approach, which collapses the sequential structure encoded within the history of days seems to perform inconsistently with increasing lead time.
6.2 Do the precursors tell a story?
Quantitative Evaluation
Figures 4(a) and 4(b) show the distribution of the estimated probabilities for instances within positive and negative super bags for Argentina and Mexico, respectively. The instances within the negative super bags show lower probability estimates by the proposed model and the instances within the positive super bags show higher probability estimates. For Mexico, fewer instances within the positives are assigned high probabilities indicating strength of the proposed model to identify and rank the precursors.
Relative cosine similarity is computed as the pairwise normalized cosine similarity, scaled relative to each event. Figures 5(a) and 5(b) show the average cosine similarity value for the precursor documents (probability estimate greater than 0.7) with the target GSR documents. For Argentina, we observe that on average, the documents on day 5 have the highest semantic similarity to the target event documents (GSR). The documents on day 3 and day 10 have lower similarity compared to the target event.
In order to investigate the relationship between the semantic similarity and the estimated probability by the proposed models, we compare the distribution of relative cosine similarity and relative entity hit score of the precursor documents with the target GSR documents with respect to bag of words features. Entity words in each news document are extracted by an enrichment tool for natural language processing. The relative entity hit score is calculated as the the intersection of entity set of precursor document and the target event divided by the relative minimum length of these two sets.
Figures 6(a) and 6(b) show the fitted Gaussian distribution of relative cosine similarities for all documents (green lines) and precursor documents (blue lines) for Argentina and Mexico, respectively. Figures 7(a) and 7(b) show the distribution of relative entity hit score for Argentina and Mexico, respectively. These distribution figures demonstrate that the proposed model assigns higher probability to news articles with higher semantic similarity to the GSR articles representing the protests events. These results show the strength of our proposed models in identifying the precursor articles.
Case Studies
We present findings about the identified precursors based on the probability estimate by nMIL across three observed protests. In Figure 1, we present a protest event against government in Argentina, and the selected precursors before its occurrence with their estimated probabilities. The titles of news reports as precursors are shown in the timeline.
In Figures 9(a) and 9(b), we present story lines by precursors that were discovered for two different protest events in Argentina and Mexico, respectively. Figure 9(a) showcases the story line about a protest event in Argentina in December 2014. In this case, the police were protesting against government for better salaries. Before this event, clashes between police and gendarmerie (military policy) had occurred leading to involvement of several policemen from different parts of the country. The text from news articles demonstrate the tense situation between the police and government in La Pampa, Argentina identified as precursors.
Figure 9(b) shows another story line of a continuous protest event in Mexico regarding the infamous case of 43 missing students 22 2 https://en.wikipedia.org/wiki/2014_Iguala_mass_kidnapping. The resulting outrage triggered constant protests which were identified by our proposed model. The figure shows a timeline of how the events turned violent leading up to the burning of congressional offices and depicts how different communities joined the movement.
6.3 Can nMIL forecast event populations?
We also evaluated the performance of our nMIL approaches for predicting the event populations by solving a multi-class classification problem. In Table 4 we depict the weighted-average F1 score for event populations (here, with categories such as Government, Wages, Energy, Others drawn from the GSR). Due to space limitations, we only depict the performance of weighted average F1 score on event population across 1 to 5 historical days with lead time of 1.
| History Days | 1 | 2 | 3 | 4 | 5 | Average(Variance) | |
|---|---|---|---|---|---|---|---|
| Argentina | rMILavg | 0.512 | 0.512 | 0.473 | 0.417 | 0.457 | 0.474(1e-3) |
| nMIL | 0.523 | 0.552 | 0.515 | 0.485 | 0.537 | 0.524(7e-4) | |
| Mexico | rMILavg | 0.576 | 0.526 | 0.447 | 0.547 | 0.493 | 0.518(3e-3) |
| nMIL | 0.570 | 0.583 | 0.560 | 0.615 | 0.545 | 0.575(7e-4) |
The proposed multi-class nMIL model outperforms the multi-class rMILavg model. On average, for event population, nMIL outperformed rMILavg by and for Argentina and Mexico, respectively.
6.4 How sensitive is nMIL to parameters?
There are three main parameters in the proposed nMIL model, which are the regularization parameter , weight for super bag loss and threshold for instance level hinge loss . Figures 8(a) and 8(b) illustrate the performance of the proposed nMIL by varying and , respectively. The test accuracy for different values of and is relatively stable.


7 Conclusion and Future Directions
This paper presents a novel extension of the multi-instance learning framework for event forecasting and identifying precursors for protest events. Most existing multi-instance approaches solve problems in object detection in images, drug activity prediction or identify sentimental sentences in text reviews. In contrast, we provide a novel application of MIL algorithms that require a two-level nested structure for event forecasting and precursor modeling.
Specifically, we study the strengths of our developed methods on open source news datasets from three Latin American countries. Through extensive evaluation and analysis we show the strong forecasting performance of the proposed methods with varying lead time and historical data. We also show qualitatively via several case studies, the richness of the identified precursors for different protests across different cities. In the future, we plan to incorporate heterogeneous data sources like social media streams for event forecasting within the developed framework. We will also extend our nested multi-instance learning framework by exploring regularized multi-task learning approaches for enforcing similarity of learned parameters, while enforcing spatial and temporal constraints.
8 Acknowledgments
Supported by the Intelligence Advanced Research Projects Activity (IARPA) via DoI/NBC contract number D12PC000337, the US Government is authorized to reproduce and distribute reprints of this work for Governmental purposes notwithstanding any copyright annotation thereon. Disclaimer: The views and conclusions contained herein are those of the authors and should not be interpreted as necessarily representing the official policies or endorsements, either expressed or implied, of IARPA, DoI/NBC, or the US Government.
References
- [1] H. Achrekar, A. Gandhe, R. Lazarus, S.-H. Yu, and B. Liu. Predicting flu trends using twitter data. In IEEE Conference on Computer Communications Workshops (INFOCOM WKSHPS), pages 702–707, April 2011.
- [2] J. Amores. Multiple instance classification: Review, taxonomy and comparative study. Artificial Intelligence, 201:81–105, 2013.
- [3] S. Andrews, I. Tsochantaridis, and T. Hofmann. Support vector machines for multiple-instance learning. In Advances in neural information processing systems, pages 561–568, 2002.
- [4] M. Arias, A. Arratia, and R. Xuriguera. Forecasting with twitter data. ACM Transactions on Intelligent Systems and Technology (TIST), 5(1):8:1–8:24, Jan. 2014.
- [5] Y. Bengio, R. Ducharme, P. Vincent, and C. Janvin. A neural probabilistic language model. J. Mach. Learn. Res., 3:1137–1155, Mar. 2003.
- [6] J. Bollen, H. Mao, and X. Zeng. Twitter mood predicts the stock market. Journal of Computational Science, 2(1):1 – 8, 2011.
- [7] R. Caruana. Multitask learning. Machine Learning, 28(1):41–75, July 1997.
- [8] C. Cortes and V. Vapnik. Support-vector networks. Machine Learning, 20(3):273–297, Sept. 1995.
- [9] T. Gartner, P. A. Flach, A. Kowalczyk, and A. J. Smola. Multi-instance kernels. In ICML ’02: Proceedings of the Nineteenth International Conference on Machine Learning, pages 179–186, San Francisco, CA, USA, 2002. Morgan Kaufmann Publishers Inc.
- [10] J. He, W. Shen, P. Divakaruni, L. Wynter, and R. Lawrence. Improving traffic prediction with tweet semantics. In Proceedings of the Twenty-Third International Joint Conference on Artificial Intelligence, IJCAI, pages 1387–1393, 2013.
- [11] M. S. Hossain, P. Butler, A. P. Boedihardjo, and N. Ramakrishnan. Storytelling in entity networks to support intelligence analysts. In Proceedings of the 18th ACM SIGKDD International Conference on Knowledge Discovery and Data Mining, KDD, pages 1375–1383, New York, NY, USA, 2012.
- [12] D. Kotzias, M. Denil, N. de Freitas, and P. Smyth. From group to individual labels using deep features. In Proceedings of the 21th ACM SIGKDD International Conference on Knowledge Discovery and Data Mining, KDD, pages 597–606, New York, NY, USA, 2015.
- [13] S. Laxman, V. Tankasali, and R. W. White. Stream prediction using a generative model based on frequent episodes in event sequences. In Proceedings of the 14th ACM SIGKDD International Conference on Knowledge Discovery and Data Mining, KDD, pages 453–461, New York, NY, USA, 2008.
- [14] Q. V. Le and T. Mikolov. Distributed representations of sentences and documents. CoRR, abs/1405.4053, 2014.
- [15] G. Liu, J. Wu, and Z.-H. Zhou. Key instance detection in multi-instance learning. In ACML, volume 25 of JMLR Proceedings, pages 253–268. JMLR.org, 2012.
- [16] T. Mikolov, K. Chen, et al. Efficient estimation of word representations in vector space. CoRR, abs/1301.3781, 2013.
- [17] T. Mikolov, I. Sutskever, K. Chen, G. Corrado, and J. Dean. Distributed representations of words and phrases and their compositionality. CoRR, abs/1310.4546, 2013.
- [18] B. O’Connor, R. Balasubramanyan, B. R. Routledge, and N. A. Smith. From tweets to polls: Linking text sentiment to public opinion time series. In Proceedings of the Fourth International Conference on Weblogs and Social Media (ICWSM). The AAAI Press, 2010.
- [19] N. Ramakrishnan, P. Butler, S. Muthiah, and et al. “Beating the News” with EMBERS: Forecasting Civil Unrest Using Open Source Indicators. In Proceedings of the 20th ACM SIGKDD International Conference on Knowledge Discovery and Data Mining, KDD, pages 1799–1808, New York, NY, USA, 2014.
- [20] J. Ritterman, M. Osborne, and E. Klein. Using prediction markets and twitter to predict a swine flu pandemic. In Proceedings of the 1st International Workshop on Mining Social, 2009.
- [21] Y. Rong, H. Cheng, and Z. Mo. Why it happened: Identifying and modeling the reasons of the happening of social events. In Proceedings of the 21th ACM SIGKDD International Conference on Knowledge Discovery and Data Mining, KDD ’15, pages 1015–1024, New York, NY, USA, 2015. ACM.
- [22] A. Tumasjan, T. Sprenger, P. Sandner, and I. Welpe. Predicting elections with twitter: What 140 characters reveal about political sentiment. In Proceedings of the Fourth International AAAI Conference on Weblogs and Social Media, pages 178–185, 2010.
- [23] X. Wang, M. S. Gerber, and D. E. Brown. Automatic crime prediction using events extracted from twitter posts. In Proceedings of the 5th International Conference on Social Computing, Behavioral-Cultural Modeling and Prediction, SBP, pages 231–238, Berlin, Heidelberg, 2012.
- [24] X. Wang, Z. Zhu, C. Yao, and X. Bai. Relaxed multiple-instance SVM with application to object discovery. CoRR, abs/1510.01027, 2015.
- [25] N. Weidmann, E. Frank, and B. Pfahringer. A two-level learning method for generalized multi-instance problems. In The European Conference on Machine Learning and Principles and Practice of Knowledge Discovery in Databases, pages 468–479, 2003.
- [26] L. Zhao, F. Chen, C. Lu, and N. Ramakrishnan. Spatiotemporal event forecasting in social media. In Proceedings of the SIAM International Conference on Data Mining, Vancouver, BC, Canada, pages 963–971, 2015.
- [27] L. Zhao, Q. Sun, J. Ye, F. Chen, C.-T. Lu, and N. Ramakrishnan. Multi-task learning for spatio-temporal event forecasting. In Proceedings of the 21th ACM SIGKDD International Conference on Knowledge Discovery and Data Mining, KDD, pages 1503–1512, New York, NY, USA, 2015.
- [28] Z.-H. Zhou and J.-M. Xu. On the relation between multi-instance learning and semi-supervised learning. In Proceedings of the 24th International Conference on Machine Learning (ICML), volume 227, pages 1167–1174, 2007.