A pulsation analysis of K2 observations of the subdwarf B star PG 1142-037 during Campaign 1: A subsynchronously rotating ellipsoidal variable
Abstract
We report a new subdwarf B (sdB) pulsator, PG 1142-037, discovered during the first full-length campaign of K2, the two-gyro mission of the Kepler space telescope. Fourteen periodicities have been detected between 0.9 and 2.5 hours with amplitudes below 0.35 ppt. We have been able to associate all of the pulsations with low-degree, modes. Follow-up spectroscopy of PG 1142 has revealed it to be in a binary with a period of 0.54 days. Phase-folding the K2 photometry reveals a two-component variation including both Doppler boosting and ellipsoidal deformation. Perhaps the most surprising and interesting result is the detection of an ellipsoidal, tidally distorted variable with no indication of rotationally-induced pulsation multiplets. This indicates that the rotation period is longer than 45 days, even though the binary period is near 13 hours.
Keywords:
Stars: oscillations – Stars: subdwarfs1 Introduction
K2 is the follow-up to the very successful Kepler space telescope mission, using the two surviving reaction wheels to stabilise the pointing (Howell et al., 2014). In this configuration, the spacecraft can reliably track targets at coordinates falling close to the ecliptic plane, where solar radiation pressure and regular thruster firings help keep the pointing to within a few pixels. Fields are mostly determined by pointing stability demands, in coordination with observer-proposed programmes. An observing campaign on any given field can last up to around 90 days. As with the original Kepler mission, observers must propose individual targets within the selected fields for long cadence (LC, 30 minutes) or short cadence (SC, 1 minute) observations.
Our interest is asteroseismology of pulsating subdwarf B stars (sdB; also known as extreme horizontal branch stars), for which Kepler data have proven to be extremely useful. The near-continuous monitoring afforded by Kepler has revolutionized our ability to associate pulsation modes with pulsations. Subdwarf B stars pulsate in both gravity (V1093 Hya) and pressure (V361 Her) modes with periods near an hour or a few minutes, respectively. Most of the Kepler-observed sdB pulsators (sdBV) were mode pulsators (Østensen et al., 2010; Østensen et al., 2011), some also with mode periodicities. The detection of evenly-spaced mode periods (Reed et al., 2011) and rotationally-induced frequency multiplets (Baran et al., 2012) has allowed most periodicities to be associated with modes, predominantly of low-degree . Discoveries from these data include slow rotation periods (Reed et al., 2014, see Table 2 of) even in day binaries (Pablo et al., 2011; Pablo et al., 2012; Baran & Winans, 2012), including one with differential rotation (Foster et al., 2015); some high-degree () modes, including (Telting et al., 2014, See Fig. 9 of); some oscillations with stochastic properties (Østensen et al., 2014); and while evenly-spaced periods indicate smoother core-envelope transitions than anticipated (Reed et al., 2014, see discussion in), at least two sdB stars have trapped modes (Foster et al., 2015; Østensen et al., 2014).
In preparation for the K2 mission, we made a selection of UV-bright targets falling near the ecliptic plane based on photometry from the GALEX satellite (Martin et al., 2005). The brighter of these targets were observed spectroscopically from the INT, KPNO, NOT, and NTT starting in January 2014. The list contains 715 targets, and observations are ongoing, focusing on proposed K2 campaign fields.
Here we report the discovery of a variable star from our analysis of K2’s first campaign (C1) photometry, which spanned 93 days during May – August of 2014. The star, EPIC 201206621, is identified with PG 1142-037 (hereafter PG 1142) from the Palomar-Green survey which classified it as sdB-O with B (Green et al., 1986). It was observed using RC-Spec at the Kitt Peak National Observatory 4 m telescope during February of 2014 as part of our spectroscopic program described above. Two 900 second spectra were obtained which were sufficient to determine and using the same LTE models as described in §2.1, which placed it within the mode instability region. During 2014, PG 1142 was observed for 2.3 hours to search for photometric variability by MDR. No pulsations were detected to a noise level of 8.1 parts-per-thousand (ppt). PG 1142 was listed in Reed & Stiening (2004) as not having a main sequence companion earlier than M2 using 2MASS data.
2 Observations and data processing
PG 1142 was observed by K2 in SC mode which summed nine images into integrations. We downloaded pixel array files () from the Mikulski Archive for Space Telescopes. Unlike the main Kepler mission, K2 does not yet supply processed lightcurves, so investigators must extract fluxes from pixel data.
We used a set of custom scripts for extracting the light curve from the pixel files. First, we employed the PyFits library within Python to read fits tables and pull out timestamps and fluxes. We limited data points to those having quality flag values of zero, therefore we avoided points affected by the onboard systematics. Second, we extracted light curves and stellar profile positions using the standard iraf aperture photometry package phot after converting the pixel files into individual images using the KEPIMAGE program. This had the advantage that we could choose a small aperture which would follow the image center using the IMCENTROID task. Since no flat fielding is applied to the data, we de-correlated the fluxes with stellar profile positions to remove the most disturbing feature present in K2 data, the roughly six hour periodicity caused by thruster firings to keep the spacecraft accurately pointed.This de-correlation was done on 10-day chunks of data. Finally, we removed long-term ( days) trends with Akima splines, normalized using the original median flux in each 10-day chunk, subtracted 1, and multiplied by 1000 to have differential fluxes in part-per-thousand (ppt).
We also processed the data using the pyke (Still & Barclay, 2012) software packages kepmask, kepextract, kepflatten, and kepconvert as well as the K2-developed kepsff. While these routines work well, we found that our techniques described above provide lower noise and so we did not use pyke-processed data.
2.1 Spectroscopic Parameters
Once pulsations were detected, we started observing PG 1142 spectroscopically as part of our campaign dedicated to investigating the binary status of pulsating hot subdwarfs observed by Kepler (Telting et al., 2014, e.g.). In February, March, and June 2015 we obtained a total of 24 radial-velocity (RV) measurements of PG 1142, as listed in Table 1.
| Date | BJD | S/N | RV | Error |
| 2015-02-02T03:36:01.8 | 2457055.6539860 | 52.3 | -20.037 | 5.674 |
| 2015-02-02T06:05:15.2 | 2457055.7576212 | 66.3 | -92.296 | 7.049 |
| 2015-02-04T04:32:01.6 | 2457057.6930173 | 48.9 | 66.725 | 4.207 |
| 2015-02-04T06:23:54.7 | 2457057.7707205 | 55.7 | 21.640 | 7.752 |
| 2015-02-06T01:04:41.9 | 2457059.5491660 | 44.6 | -97.101 | 6.922 |
| 2015-02-07T01:16:57.7 | 2457060.5577485 | 27.4 | -66.534 | 10.827 |
| 2015-02-14T06:38:28.3 | 2457067.7814588 | 54.3 | -47.224 | 5.931 |
| 2015-02-15T01:20:05.8 | 2457068.5604078 | 44.8 | 51.260 | 6.892 |
| 2015-02-15T05:12:26.7 | 2457068.7217691 | 27.1 | -68.086 | 10.040 |
| 2015-03-01T23:31:21.3 | 2457083.4855331 | 46.9 | -33.843 | 11.161 |
| 2015-03-02T02:33:37.4 | 2457083.6121128 | 50.0 | 74.737 | 7.231 |
| 2015-03-04T01:51:41.2 | 2457085.5830472 | 43.6 | -91.444 | 5.336 |
| 2015-03-05T00:44:01.7 | 2457086.5360873 | 40.5 | -64.897 | 6.872 |
| 2015-03-12T04:46:23.1 | 2457093.7045330 | 51.8 | -82.345 | 5.677 |
| 2015-03-16T00:26:21.5 | 2457097.5239989 | 55.0 | -59.301 | 4.197 |
| 2015-03-17T02:40:42.8 | 2457098.6173076 | 25.7 | -49.665 | 7.195 |
| 2015-06-12T21:28:07.3 | 2457186.3951956 | 46.4 | 73.508 | 7.843 |
| 2015-06-12T22:46:09.4 | 2457186.4493808 | 55.7 | 80.049 | 6.347 |
| 2015-06-16T21:05:47.5 | 2457190.3793016 | 37.0 | -29.492 | 6.194 |
| 2015-06-16T21:25:36.2 | 2457190.3930589 | 35.3 | -25.492 | 8.038 |
| 2015-06-16T22:28:48.9 | 2457190.4369509 | 37.7 | -55.445 | 6.903 |
| 2015-06-16T22:49:07.5 | 2457190.4510538 | 43.5 | -62.600 | 6.493 |
| 2015-06-17T21:16:19.9 | 2457191.3865230 | 26.3 | 52.608 | 11.179 |
| 2015-06-17T23:14:12.0 | 2457191.4683685 | 56.4 | -21.937 | 6.596 |
All low-resolution spectra were collected with the ALFOSC spectrograph at the Nordic Optical Telescope (NOT), using a 0.5 arcsec slit with the new high-efficiency volume-phased holographic grism #18, covering the approximate wavelength range of 3530-5200 Å, with resolution R2000 (or 2.2Å) and dispersion of 0.82 Å/pix. The exposure time used was 900 seconds, except for one spectrum that was exposed 1500 seconds. The S/N of the spectra ranges from 26 to 66, with a median value of 46, depending on observing conditions.
All spectra were processed and extracted using standard iraf tasks. Radial velocities (RVs) were computed with fxcor, by cross-correlating with a synthetic template derived from a fit to a mean spectrum of the target (see below), while using the H, H, H, H8, and H9 lines from the observed spectra. After the first iteration, there was velocity residuals in phase with the signal and so we did an extra fxcor iteration on spectra that were shifted to correct for the first RV results. This procedure led to a final RV amplitude about 4% larger than obtained from the first try. The errors returned by the second fxcor run are more consistent with the RMS from the orbit fit (see §3.2), so we used these errors for the analysis in this paper. The median RV error is km s-1.
The final RVs were adjusted for the position of the target on the slit, judged from slit images taken just before and after the spectra. Table 1 lists the observations with their mid-exposure dates, and RV measurements with the final fxcor error.
We used the mean of the best 12 spectra (each with S/N>45), after shifting each to remove the orbit, and with final S/N180, to obtain the first high signal-to-noise determination of the atmospheric parameters of PG 1142. We determined and from the mean spectrum using the H/He LTE grid of Heber et al. (1999) for consistency with Østensen et al. (2010). We used all the Balmer lines from H to H14 and the four strongest He I lines for the fit. We find , , and (N(He)/N(H)). The errors listed on the measurements are the formal errors of the fit, which reflect the S/N of the mean spectrum. These values and errors are relative to the LTE model grid and do not reflect any systematic effects caused by the assumptions underlying those models. The model fit is shown in Fig. 1.

3 Data Analysis
3.1 Pulsation Analysis
93 days of near-continuous observations yields a 1/T resolution of Hz, which is independent frequencies up to the Nyquist. Initially, we used a detection threshold of (0.147 ppt) as indicated in Bevington & Robinson (2003) and then (0.175 ppt) as indicated in Baran et al. (2015). However, having processed the data several times using multiple methods, we noted periodicities which were consistently distinguished from random noise. Using the higher detection limit to construct period sequences (described below), we noticed that the lower amplitude periodicities also fit into the sequences, and so retained them, even though they fall below a justifiable detection limit. We include the S/N values in Table2 and note those frequencies with low values.

To determine the pulsation frequencies, amplitudes, and errors, we fitted Lorentzian profiles to the peaks. This has become our standard procedure when pulsations have substantial amplitude and/or frequency variability. The previous method of non-linear least-squares fitting and prewhitening is no longer effective as it assumes constant amplitudes, phases, and frequencies while the observations obviously do not posses these properties. Figure 3 shows a sliding FT of the two highest amplitude periodicities, for reference. We do not wish to imply that the pulsations are stochastically excited (see Østensen et al., 2014; Reed et al., 2007, for discussions),but use this tool as the most effective for determining frequency centers with the Lorentzian widths providing an indicator of line variability, regardless of its cause. The fitted periodicities are listed in Table 2 with other asteroseismically interesting quantities (described below).

The FT has 12 peaks above a detection limit. Three of these have long periods at Hz (12.99 hrs), its overtone at Hz and another at Hz, which is the residuals of the thruster firings (not included in Table 2). Five other frequencies persistently appeared near through our various reductions. All of these occur near period spacing sequences (see discussion below) and so we include them in Table 2. Figure 2 shows the FT with noise limits, artefacts, and binary signals and overtones indicated.
| ID | Freq | Period | Amp | S/N | |||||
|---|---|---|---|---|---|---|---|---|---|
| (Hz) | (sec) | (ppt) | |||||||
| fA | 21.37 (9) | 46761 (188) | 0.40 | ||||||
| fB | 42.78 (7) | 23377 (39) | 0.26 | ||||||
| f1 | 108.67 (9) | 9199.6 (6.9) | 0.12 | 3.5 | 2 | 57 | -0.01 | ||
| f2 | 111.05 (9) | 9004.7 (6.9) | 0.13 | 3.8 | 1 | 31 | -0.037 | ||
| f3 | 130.50 (7) | 7663.1 (4.2) | 0.21 | 6.2 | 1 or 2 | 26 | 47 | -0.047 | 0.006 |
| f4 | 135.41 (9) | 7396.4 (5.0) | 0.13 | 3.8 | 1 | 25 | -0.04 | ||
| f5 | 157.38 (9) | 6354.0 (3.7) | 0.34 | 10.0 | 1 | 21 | 0.064 | ||
| f6 | 164.65 (8) | 6073.6 (3.0) | 0.26 | 7.6 | 1 | 20 | 0.017 | ||
| f7 | 223.82 (9) | 4467.9 (1.8) | 0.19 | 5.6 | 1 | 14 | 0.020 | ||
| f8 | 226.55 (8) | 4414.0 (1.6) | 0.19 | 5.6 | 2 | 26 | -0.103 | ||
| f9 | 232.63 (12) | 4298.7 (2.2) | 0.13 | 3.8 | 2 | 25 | 0.148 | ||
| f10 | 263.36 (8) | 3797.1 (1.2) | 0.19 | 5.6 | 2 | 22 | -0.111 | ||
| f11 | 273.25 (8) | 3659.7 (1.0) | 0.24 | 7.1 | 1 or 2 | 11 | 21 | 0.002 | -0.003 |
| f12 | 296.12 (9) | 3377.2 (1.0) | 0.13 | 3.8 | 1 | 10 | -0.050 | ||
| f13 | 296.50 (9) | 3372.7 (1.0) | 0.18 | 5.3 | 1 | 10 | -0.070 | ||
| f14 | 297.44 (9) | 3362.0 (1.0) | 0.19 | 5.6 | 2 | 19 | 0.063 |
No consistent rotationally-induced frequency multiplets appear in these data, so we can only use asymptotic period spacings for mode identifications. A Kolmogorov-Smirnov (KS) test statistic was calculated using the periods in Table 2 with the results shown in Figure 4. From previous work with sdBV stars, we know that the sequences should appear near 250 s and the sequence should appear near 150 s (Reed et al., 2011), and indeed the strongest KS statistic appears near 265 s. Differencing the periods indicated that most of PG 1142’s periods are separated nearly by this value or a multiple of it. The sequence was then determined by assigning a relative overtone, , and calculating a linear regression of those periods and overtones. That fit was then used to find additional periods which fit the sequence. Nine of the 14 periods fit into this sequence with errors below 7%. According to asymptotic theory (Aerts et al., 2010, see ), the sequence is related to the sequence as and so we could determine which periods should be . Seven periods could be associated with the sequence, including two peaks which also fit the sequence. We cannot distinguish between or for these peaks (f3 and f11) and so Table 2 has listings for both. Figure 5 shows a period transform with the resultant asymptotic period sequences indicated. The linear regression solutions find period spacing sequences of and seconds for the and sequences, respectively. This results in all periodicities being identifed with spacings similar to other Kepler-observed mode pulsators (Reed et al., 2011).


3.2 Binary Analysis
PG 1142 has proven to be a very exciting target. The detection of fA and fB prompted follow-up spectroscopic observations (described in §2.1) to search for velocity variations, which were subsequently detected. Fitting the 24 RVs (in Table 1), and assuming a circular orbit, gives an orbital solution period of d (Hz), amplitude of km s-1, and phase of BJD (top panel of Fig. 6). The eccentricity was subsequently fitted at , showing it is negligible for our calculations. Using the values of km s-1 and P = 0.541 days from spectroscopy, the sdB canonical mass M1=0.47 and assuming , we get the minimum values for of and for the orbital separation . Of course we know this is not the inclination as no eclipses are evident in the lightcurve.
We attempted several phase-folding and binning combinations of the photometry to improve the period and phase, however the thruster firings, at roughly every six hours, and pulsations decrease the accuracy, and so the RV data are better for constraining the period. Still, the photometry show evidence of two-component variations, occuring at similar levels, in agreement with the FT. From the phasing of the variations, we can deduce the sources. A reflection-effect companion in the binary would produce a reflection effect maximum, which would occur during a Doppler-boosting zero point (halfway between maximum and minimum) or an ellipsoidal-effect minimum. A Doppler-boosting maximum would occur during an ellipsoidal-variable maximum. Figures 7 and 8 show the results of two-component fits to the folded lightcurve (described below). The phasing indicates that the components are Doppler boosting and ellipsoidal variations. These two components indicate that PG 1142 is most likely an sdB+WD binary.
We do not notice any eclipses in the folded lightcurve and the fitted Doppler and ellipsoidal amplitudes closely match the peaks in the FT, indicating that there is no additional contribution from eclipses. Using we calculate the inclination to be less than . As PG 1142 is likely an sdB+WD binary, if we use the canonical WD mass of , we calculate an inclination of and
| Property | Value | Comments |
|---|---|---|
| 27954(54) K | Combined spectrum | |
| 5.32(1) dex | Combined spectrum | |
| (n(He)/n(H)) | -2.87(3) dex | Combined spectrum |
| Period | 0.541089(20) days | RVs, circular orbits |
| 85(2) km s-1 | RVs, circular orbits | |
| Reduced of the fit | 1.4071 | RVs, circular orbits |
| Fit RMS | 7.8932 | RVs, circular orbits |
| 0.079(28) | RVs | |
| , | ||
| , | ||
| No observed eclipses. | ||
| , | ||
| , | ||
| 0.25(2) ppt | Folded lightcurve fit. | |
| 0.38(2) ppt | Folded lightcurve fit. | |
| Reduced of the fit | 1.08 | Folded lightcurve fit. |


A simple two-component sine fit was done to the phase-folded and binned lightcurve as shown in Fig. 7. The resulting solution has a reduced and fitted the ellipsoidal amplitude at ppt and the Doppler boosting at ppt. From the RV amplitude of km s-1 and following the procedure of Telting et al. (2012), the Doppler boosting can be calculated to be 0.39 ppt, which closely matches the photometric amplitude. The phasing of the Doppler and ellipsoidal signals appear exactly as expected in phase: maximum Doppler boosting coincides with an ellipsoidal maximum and the Doppler minimum with the other ellipsoidal maximum. This indicates that we are correctly interpreting the causes of variations.
We have also modelled the binary light curve using the LCURVE code (Copperwheat et al., 2010). We tested two scenarios with very different component masses, but both consistent with the measured orbital period and radial velocity amplitude of the sdB. We assumed a white dwarf radius of R⊙ and an effective temperature of 27 000 K for the sdB and 20 000 K for the white dwarf. Limb darkening and gravity darkening coefficients do not have a large effect on the light curves and were fixed at the values used for KPD 1946+4340 in Bloemen et al. (2011). For Scenario 1, we used a white dwarf mass of 0.6 M⊙ and an sdB mass of 0.47 M⊙. These masses imply a mass ratio of , and an inclination of deg. By fitting only the sdB radius, we found a best fit for R⊙. The best model has a reduced , which indicates that the model nearly perfectly explains the features in the observed light curve. For Scenario 2, we changed the white dwarf mass to 0.3 M⊙ and kept the sdB mass at the canonical value of 0.47 M⊙, which implies a mass ratio of and a very different inclination of deg. We found a best fit for R⊙, resulting in a light curve with reduced which was nearly indistinguishable from the best fit in Scenario 1. Both fits are shown in Fig. 8. From this test, we conclude that sensible system parameters can explain the observed radial velocity curve and K2 light curve, but in the absence of eclipses, model fitting the light curve does not provide useful constraints on crucial parameters such as the white dwarf mass and the inclination of the system.
4 Results and Discussion
We discovered PG 1142 to be a new sdB pulsator from 93 days of K2 data obtained during C1. In the photometry we detect 14 periodicities associated with pulsations and two others related to binarity. Using asymptotic period spacing, we were able to identify all the pulsations as low-degree modes.
One of our more surprising results is the lack of periodicities in the data, compared to other sdB pulsators. With 93 nearly-continuous days of data, we were expecting to find more periodicities. Of the 13 mode sdBV stars discovered using 30 days of data during Kepler’s survey phase (Østensen et al., 2010; Østensen et al., 2011), only three, all fainter than PG 1142, had fewer periodicities and even EQ Psc, using only nine days of K2 engineering data, shows more periodicities (Jeffery & Ramsay, 2014). Figure 9 shows the number of mode pulsations detected from Kepler survey-phase and K2 engineering observations. It would be expected that fainter stars would show fewer periods, having reduced S/N, and there is a very slight trend in that direction. Flux from (non-white dwarf) companions could also reduce the number of pulsations detected and the point types in the figure indicate those with companions. Again, it is mildly suggestive that companion flux impacts the results. Position within the instability strip could also affect the number of pulsations observed and so the right panel indicates the number of pulsations observed against . No obvious trend occurs. While it was expected that K2 data would have more noise than the main mission, these data contain three times as many points as survey-phase data, which should more than make up for the reduced S/N of individual measurements. As such, we are left to conclude that PG 1142 is one of the more sparse pulsators observed by the Kepler space telescope.
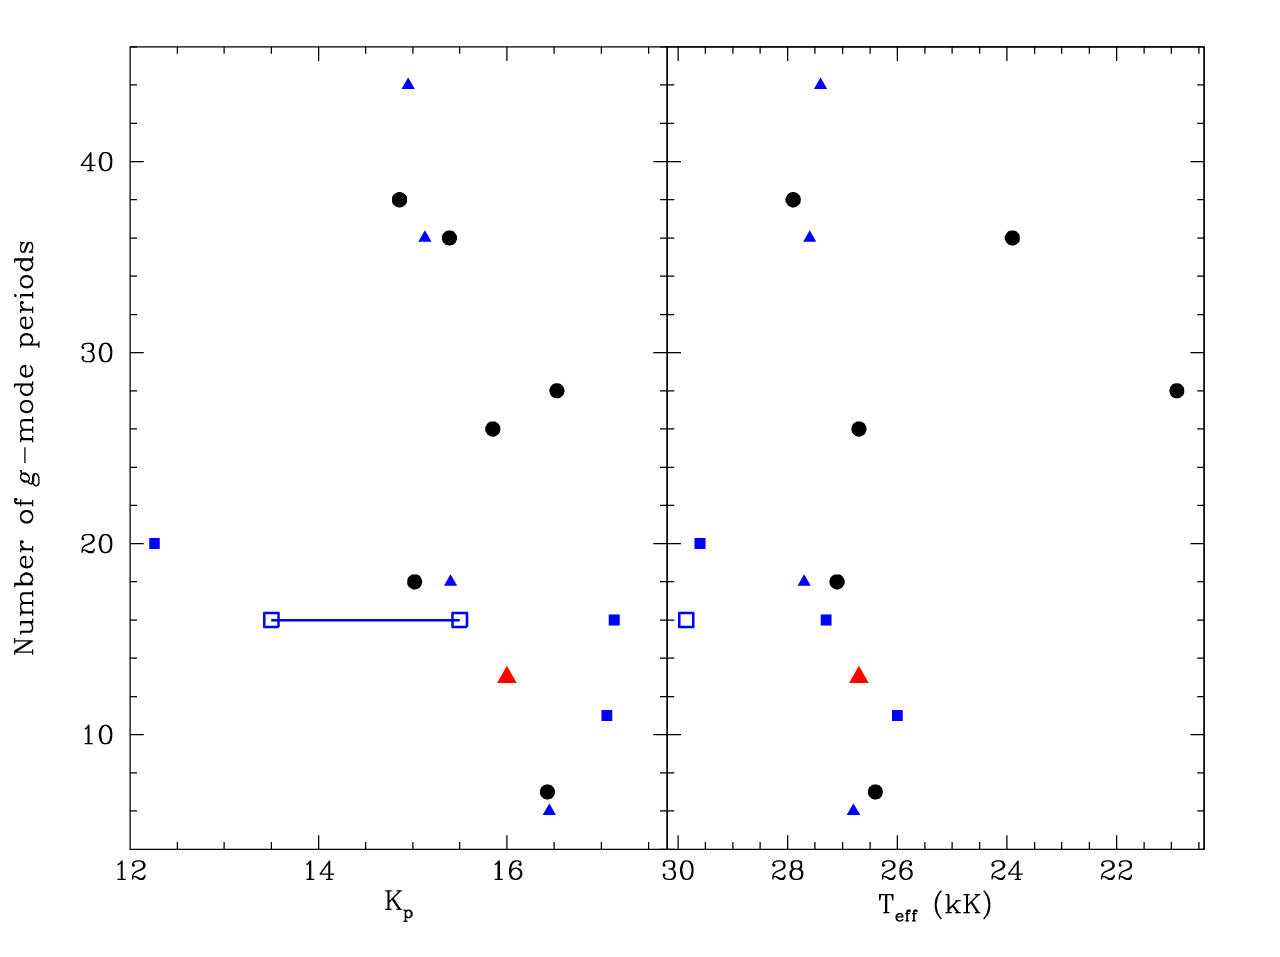
We also do not detect any obvious rotationally-induced frequency multiplets. If PG 1142 were tidally locked, the 0.54 day orbit would produce and 2 splittings in multiples of 10.7 and 17.8 Hz, respectively. The frequency differences appear roughly random and no frequency differences are within 1 Hz of the expected separations. Since all the frequencies (with the possible exception of f12) fit period sequences, the most likely explanation is that no frequency multiplets exist. This is suggestive that PG 1142 spins longer than days. It is possible that f13 and the low-amplitude f12 form an doublet. If this is the case, then the Hz separation would indicate a spin period of 14.6 days. While we feel this is unlikely and f12 is most likely a spurious frequency, it would still be subsynchronous to the binary period. Of the nine known rotation periods of sdBV stars observed with Kepler and listed in Table 1 of Reed & Foster (2014, and references therein), four would surely have been detectable from K2 data with three more having periods right around 45 days, which likely would have been detected. Only two have spin periods commensurate with the length of K2’s C1, making it unlikely multiplets would have been detectable with these data. From our experience with Kepler and sdB variables, only extremely low-inclination angles suppress multiplets (see Reed et al., 2004, for example) and for any reasonable range of masses, the resultant orbital inclinations are well-suited for detecting rotationally-induced multiplets. As such, the lack of observed multiplets indicate that PG 1142 has a long rotation period of at least 45 days.
From spectroscopy and the folded lightcurve, we determined that PG 1142 is in a close binary with a period of 0.54 d. We measured a Doppler boosting amplitude of 0.38 ppt which matches the orbital velocity of km s-1. We also measured an ellipsoidal variable amplitude of 0.25 ppt. As we do not see eclipses, the inclination must be and, assuming canonical sdB and WD masses, we calculated an inclination of . At this inclination, mutiplets should be easily observed if the rotation were commensurate with the orbital period. With the complete lack of observed multiplets implying a long rotation, this system is an excellent test for various tidal locking mechanisms (Pablo et al., 2012, e.g.) and, so far as we know, it is the first ellipsoidal variable which is likely rotating subsynchronously. With a rotation period days, PG 1142 has the longest period of our known subsynchronously rotating binaries; a particularly surprising result as it is the only one with tidal deformation indicative of a stronger gravitational field from the companion.
Our results for PG 1142 represent very useful data points to complete our understanding of sdB stars, and by extension, the cores of red clump and other horizontal branch stars. The 14 observationally identified modes will present challenges for model fitting. Even four years after our first examination of Kepler data, there are no model fits using observationally constrained mode identifications. Once structural models accurately indicate the internal structure (via asteroseismology matching), PG 1142 and the other subsynchronous binaries will be extremely useful for constraining mass and angular momentum transfer.
ACKNOWLEDGMENTS: Funding for this research was provided by the National Science Foundation grant#1312869. Any opinions, findings, and conclusions or recommendations expressed in this material are those of the author(s) and do not necessarily reflect the views of the National Science Foundation. JK, LR, AW, and HF were supported by the Missouri Space Grant Consortium, funded by NASA. ASB gratefully acknowledges a financial support from the Polish National Science Center under project No. UMO-2011/03/D/ST9/01914. This paper includes data collected by the Kepler mission. Funding for the Kepler mission is provided by the NASA Science Mission directorate. Data presented in this paper were obtained from the Mikulski Archive for Space Telescopes (MAST). STScI is operated by the Association of Universities for Research in Astronomy, Inc., under NASA contract NAS5-26555. Support for MAST for non-HST data is provided by the NASA Office of Space Science via grant NNX13AC07G and by other grants and contracts.
The spectroscopic observations used in this work were obtained with the Nordic Optical Telescope at the Observatorio del Roque de los Muchachos and operated jointly by Denmark, Finland, Iceland, Norway, and Sweden and the Mayall Telescope of Kitt Peak National Observatory, which is operated by the Association of Universities for Research in Astronomy under cooperative agreement with the National Science Foundation.
References
- Aerts et al. (2010) Aerts C., Christensen-Dalsgaard J., Kurtz D. W., 2010, Asteroseismology. Springer
- Baran et al. (2015) Baran A. S., Koen C., Pokrzywka B., 2015, MNRAS, 448, L16
- Baran et al. (2012) Baran A. S., Reed M. D., Stello D., Østensen R. H., Telting J. H., Pakštienë E., O’Toole S. J., Silvotti R., Degroote P., Bloemen S., Hu H., Van Grootel V., Clarke B. D., Van Cleve J., Thompson S. E., Kawaler S. D., 2012, MNRAS, 424, 2686
- Baran & Winans (2012) Baran A. S., Winans A., 2012, ActaAstron, 62, 343
- Bevington & Robinson (2003) Bevington P. R., Robinson D. K., 2003, Data reduction and error analysis for the physical sciences. McGraw-Hill
- Bloemen et al. (2011) Bloemen S., Marsh T. R., Østensen R. H., et al. 2011, MNRAS, 410, 1787
- Copperwheat et al. (2010) Copperwheat C. M., Marsh T. R., Dhillon V. S., Littlefair S. P., Hickman R., Gänsicke B. T., Southworth J., 2010, MNRAS, 402, 1824
- Foster et al. (2015) Foster H. M., Reed M. D., Telting J. H., Østensen R. H., Baran A. S., 2015, ApJ, 805, 94
- Green et al. (1986) Green R. F., Schmidt M., Liebert J., 1986, ApJS, 61, 305
- Heber et al. (1999) Heber U., Reid I. N., Werner K., 1999, A&A, 348, L25
- Howell et al. (2014) Howell S. B., Sobeck C., Haas M., Still M., Barclay T., Mullally F., Troeltzsch J., Aigrain S., Bryson S. T., Caldwell D., Chaplin W. J., Cochran W. D., Huber D., Marcy G. W., Miglio A., Najita J. R., Smith M., Twicken J. D., Fortney J. J., 2014, PASP, 126, 398
- Jeffery & Ramsay (2014) Jeffery C. S., Ramsay G., 2014, MNRAS, 442, L61
- Martin et al. (2005) Martin D. C., Fanson J., Schiminovich D., Morrissey P., Friedman P. G., Barlow T. A., Conrow T., Grange R., Jelinsky P. N., Milliard B., Siegmund O. H. W., Bianchi L., Byun Y.-I., et al., 2005, ApJL, 619, L1
- Østensen et al. (2014) Østensen R. H., Reed M. D., Baran A. S., Telting J. H., 2014, A&A, 564, L14
- Østensen et al. (2010) Østensen R. H., Silvotti R., Charpinet S., et al. 2010, MNRAS, 409, 1470
- Østensen et al. (2011) Østensen R. H., Silvotti R., Charpinet S., et al. 2011, MNRAS, 414, 2860
- Østensen et al. (2014) Østensen R. H., Telting J. H., Reed M. D., Baran A. S., Nemeth P., Kiaeerad F., 2014, A&A, 569, A15
- Pablo et al. (2011) Pablo H., Kawaler S. D., Green E. M., 2011, ApJL, 740, L47
- Pablo et al. (2012) Pablo H., Kawaler S. D., Reed M. D., Bloemen S., Charpinet S., Hu H., Telting J., et al. 2012, MNRAS, 422, 1343
- Reed & Foster (2014) Reed M., Foster H., 2014, in van Grootel V., Green E., Fontaine G., Charpinet S., eds, 6th Meeting on Hot Subdwarf Stars and Related Objects Vol. 481 of Astronomical Society of the Pacific Conference Series, Precision Observational Asteroseismology Using Kepler Spacecraft Data. p. 45
- Reed et al. (2011) Reed M. D., Baran A. S., Quint A. C., Kawaler S. D., O’Toole S. J., Telting J., et al. 2011, MNRAS, 414, 2885
- Reed et al. (2014) Reed M. D., Foster H., Telting J. H., Østensen R. H., Farris L. H., Oreiro R., Baran A. S., 2014, MNRAS, 440, 3809
- Reed et al. (2004) Reed M. D., Kawaler S. D., Zola S., Jiang X. J., Dreizler S., et al. 2004, MNRAS, 348, 1164
- Reed et al. (2007) Reed M. D., O’Toole S. J., Terndrup D. M., Eggen J. R., Zhou A.-Y., An D., Chen C.-W., Chen W. P., Lin H.-C., Akan C., Cakirli O., Worters H., Kilkenny D., Siwak M., Zola S., Kim S.-L., Gelven G. A., Harms S. L., Wolf G. W., 2007, ApJ, 664, 518
- Reed & Stiening (2004) Reed M. D., Stiening R., 2004, PASP, 116, 506
- Still & Barclay (2012) Still M., Barclay T., , 2012, PyKE: Reduction and analysis of Kepler Simple Aperture Photometry data, Astrophysics Source Code Library
- Telting et al. (2014) Telting J., Østensen R., Reed M., Kiæerad F., Farris L., Baran A., Oreiro R., O’Toole S., 2014, in van Grootel V., Green E., Fontaine G., Charpinet S., eds, 6th Meeting on Hot Subdwarf Stars and Related Objects Vol. 481 of Astronomical Society of the Pacific Conference Series, Low-Resolution Radial-Velocity Monitoring of Pulsating sdBs in the Kepler Field. p. 287
- Telting et al. (2014) Telting J. H., Baran A. S., Nemeth P., Østensen R. H., Kupfer T., Macfarlane S., Heber U., Aerts C., Geier S., 2014, A&A, 570, A129
- Telting et al. (2012) Telting J. H., Østensen R. H., Baran A. S., Bloemen S., Reed M. D., Oreiro R., Farris L., Ottosen T. A., Aerts C., Kawaler S. D., Heber U., Prins S., Green E. M., Kalomeni B., O’Toole S. J., Mullally F., Sanderfer D. T., Smith J. C., Kjeldsen H., 2012, A&A, 544, A1