A 20-Liter Test Stand with Gas Purification for Liquid Argon Research
Abstract
We describe the design of a 20-liter test stand constructed to study fundamental properties of liquid argon (LAr). This system utilizes a simple, cost-effective gas argon (GAr) purification to achieve high purity, which is necessary to study electron transport properties in LAr. An electron drift stack with up to 25 cm length is constructed to study electron drift, diffusion, and attachment at various electric fields. A gold photocathode and a pulsed laser are used as a bright electron source. The operational performance of this system is reported.
keywords
Liquid Argon; Purity; Electron Lifetime1 Introduction
Research and development (R&D) of the liquid argon time projection chamber (LArTPC) is at the technical frontier of neutrino physics. As the chosen technology of the short-baseline neutrino (SBN) program at Fermi National Accelerator Laboratory (FNAL) [1] and the Deep Underground Neutrino Experiment (DUNE) at the Long-Baseline Neutrino Facility (LBNF) [2], LArTPCs provide a key technology to search for light sterile neutrino(s) [3], to search for CP violation in the neutrino sector [2], and to determine the neutrino mass hierarchy [4]. Therefore, the fundamental properties of LAr are of particular interest for experimentalists.
Based on the development of the LAr ionization chamber [5] and the gas-filled time projection chamber [6], LArTPCs were introduced to neutrino physics in the period 1976 to 1978 by H. H. Chen [7] and by C. Rubbia [8] as a fine-grained tracking calorimeter. In LArTPCs, energetic charged particles produced in neutrino interactions ionize argon atoms as they traverse the LAr medium. These ionization electrons then travel along an externally applied electric field ( 500 V/cm) at a constant velocity towards position-sensitive detectors at the anode plane. The time difference between the creation of the ionization electrons and their arrival time, the arrival position, and the charge in the electron swarm carry important three-dimensional position and energy information of the initial energetic charged particles. The ionization electrons typically take a few milliseconds to drift a few meters in large neutrino detectors. During this drift, each ionization electron interacts continuously with atoms and molecules along its path. If electronegative impurities are present in the LAr, drifting electrons will be captured to form negative ions, which drift much more slowly than electrons, resulting in a decrease in the fast component of the charge detected at the anode. This reduces the signal-to-noise ratio and makes the collected charge dependent on drift distance in addition to ionization. In general, the free electron lifetime is used to characterize this attachment process, and a free electron lifetime longer than the drift time is typically required to avoid losing charge information. Therefore, high purity LAr with less than part-per-billion (ppb) electronegative impurities is essential. This level of impurity is usually several orders of magnitude lower than that of commercial LAr. Thus, a dedicated argon purification system is essential to study electron transport properties of LAr.
Most existing LAr test facilities, such as LAPD [9] and MTS [10] at FNAL, and ARGONTUBE [11] at Bern, utilize LAr purification to remove impurities (O2 and H2O) directly from the liquid by recirculating it through a purifier. This technique has the advantage that a large mass of argon can be processed in a short time. However, the implementation of LAr purification usually requires a cryogenic pump, which can be expensive to purchase and maintain and requires significant LAr plumbing. In this paper, we report the design and operational performance of a simple, cost-effective 20-liter liquid test stand constructed at Brookhaven National Laboratory (BNL), which relies solely on gas purification to achieve high purity LAr. This test stand is constructed specifically to measure electron transport properties in LAr. It is an upgrade of a liquid argon test stand reported in Ref. [12], providing better thermal stability and an improved drift stack apparatus.
This paper is organized as follows. In Sec. 2, we describe various components of our test stand including the cryogenic system, the laser and the photocathode, the electron drift stack, and the data acquisition system. In Sec. 3, we report the performance of our test stand including the thermal stability, purity, high voltage capability, and electron source characteristics. In Sec. 4, we will discuss future measurements and provide a summary.
2 System Description
2.1 Cryogenic System
The cryogenic system is composed of a 20-liter LAr dewar, a LAr condenser that is cooled with pressurized liquid nitrogen at 87 K, an argon purifier containing an oxygen absorber and a water adsorber, and the associated plumbing that connects these components. A schematic diagram of the apparatus is shown in Fig. 1.
| 1. capacitance level gauge |
| 2. resistance temperature detector |
| (RTD) probe |
| 3. optical tube for laser beam entrance |
| 4. pressure transducer |
| 5. heater |
| 6. pressure differential level gauge |
| 7. capacitance level gauge |
| 8. RTD probe |
| 9. pressure transducer |
| 10. sampling tube to gas analyzer |
| 11. activation gas inlet |
| 12. activation gas outlet |
| 13. dielectric mirror |
The main 20-liter LAr dewar is manufactured by CryoFab (part # CF9524) with multi-layer insulation (MLI) [13]. It has been pressure tested to 30 psig but the maximum allowable working pressure (MAWP) is limited to 8 psig by a relief valve to meet BNL safety requirements. The cylindrical dewar has internal dimensions of 24 inches in depth by 9.46 inches in diameter with an ellipsoidal bottom, for a total (empty) internal volume of 27.9 liters. A 12-inch diameter conflat flange, containing 15 feedthroughs, is used to seal the dewar at the top. These feedthroughs provide connections for the gas outlet and purified liquid inlet as well as all the test instruments including an evacuated optical tube for laser beam entrance, high and low voltage supply cables, a level gauge, temperature and pressure sensors, and signal cables. Four thin stainless steel baffle plates spaced at 1 inch intervals are installed below the top flange to provide thermal insulation between the LAr and the top flange. This set of baffles significantly reduces the heat transfer due to radiation and GAr convective flow. The effectiveness of the insulation is confirmed by temperature measurements of the upper surface of the top flange with LAr filled just below the bottom plate. The surface temperature remains at about 20 , preventing water condensation on the top of the flange. The LAr volume below the lowest baffle plate is 22.1 liters. A tube passing through the insulating vacuum space is installed at the bottom of the dewar as a port to fill and drain LAr and a connection to the bottom of the LAr to measure the head pressure.
In a LArTPC, LAr with high purity is essential in order to observe signals from drifting ionization electrons. Electronegative molecules, such as oxygen and water, attach drifting electrons. The resulting negative ions drift very slowly ( 105 times slower than electrons) and the slow signals they induce at the readout are outside the bandwidth of the detection electronics. In large systems, impurities have to be reduced to 0.1 ppb of oxygen equivalent to keep this attenuation of the signal to an acceptable level. In small systems, this requirement may be relaxed due to the shorter free electron drift times typically involved. In our system, the purifier is a 304 stainless steel tube, 13 inches long with a diameter of 2 inches, closed at the top by a conflat flange. The bottom is connected to a vacuum-jacketed tube that penetrates the top flange of the main dewar and conducts GAr into the purifier from the space above the LAr and below the baffle plates. It is filled with 1 kg of 13X molecular sieve 8-14 mesh beads and 3 kg of GetterMax-133 copper catalyst 3 3 mm tablets [14] for removing water and oxygen, respectively. The molecular sieve is filled at the bottom of the cylinder, and the GetterMax-133 is filled on the top of it. Water is removed by the selective molecular adsorption in the pores of the molecular sieve [15]. Oxygen is removed by the oxidative reaction with the copper. Both processes reduce the purification capacity as the active materials become saturated with the impurities. A regeneration procedure is required to restore the capacity of the materials before initial usage and after several fillings of the system with commercial LAr. This procedure is described in detail in Sec. 3.1. Appropriate valving of the purifier allows the regeneration to occur in situ.

The argon condenser is constructed of 304 stainless steel. An outer cylinder 6 inches in diameter and 18.5 inches in length contains the pressurized LN2, which is the source of refrigeration. The filling of the LN2 is controlled by a cryogenic solenoid valve (Gems D2063-LN2) with feedback of the LN2 level as measured by a capacitance level gauge. During operations, GAr evaporated from the LAr is condensed in an inner coaxial tube 2 inches in diameter, which is packed with coarse copper wool to improve the heat transfer between the GAr and the LN2 outside the inner tube. The entire condenser is insulated with 6 inches of Cryo-Lite cryogenic insulation [16]. Fig. 2 shows the phase diagram of argon with the boiling line of N2 superposed. The LN2 temperature is controlled by the pressure inside the condenser, which is maintained by a high precision, adjustable back pressure regulator (Equilibar EB1HF2-SS) [17]. The adjustment of the regulator sets the LN2 temperature, which in turn determines the LAr temperature and thus its pressure, as is indicated in Fig. 2. The condensed argon flows back to the bottom of the LAr dewar through a vacuum-jacketed tube penetrating the top flange. In order to increase the flow rate of the argon through the purifier, a heater with a resistance of 6 and 150 W maximum power dissipation is installed to one side near the bottom of the dewar.
The piping of the system is composed mainly of the LN2 filling tube, the LAr circulation loop, filling tube, and sampling tubes as shown in the schematic diagram in Fig. 1. The LN2 filling tube introduces LN2 to the LAr condenser through a flexible hose covered with 2-inch thick Cryo-Lite insulation. In the LAr circulation loop, LAr is vaporized by heat influx into the liquid through the imperfect insulation of the dewar walls. The gas produced flows through the vacuum-jacketed tube with its inlet below the baffle plates. After passing through the purifier, the gas exchanges heat with the copper wool cooled by the LN2 and is condensed back into pure liquid. The liquid then flows to the bottom of the condenser and back into the bottom of the main dewar by gravity. The heat of the GAr condensation is removed by the vaporization of LN2. Controlling the pressure of the LN2, controls both the temperature and the pressure of LAr, following the boiling curve (red line in Fig. 2). The LAr circulation loop components that are not vacuum-jacketed are insulated by 6-inch thick of Cryo-Lite. LAr is introduced into the dewar through the bottom filling tube from the supply dewar. Argon sampling lines are used to conduct gas samples into three gas analyzers (one each for H2O, N2, and O2) from three locations (downstream and upstream of the purifier, and from a 1/4-inch tube terminated in the LAr with a 1/32-inch orifice).
Crucial system operating parameters including temperatures, pressures, and levels of LAr and LN2 are continuously monitored throughout the entire operation. The temperatures for LAr and LN2 are measured by PT-100 RTD probes (Omega PR-10-2) with 0.01K precision [18]. These probes are calibrated in LN2 at the factory. A thermocouple is installed on the surface of the purifier to monitor the temperature during operation and activation. Another RTD sensor is installed on the top of the resistors in the heater (about 4 inches above the level of the RTD probe measuring LAr temperature) to provide another LAr temperature reading during operation. The pressures of LAr and LN2 are measured by Omega PX-209 transducers with a specified 0.25% accuracy [19]. The level of LAr and LN2 are measured by coaxial capacitance level gauges (Sycon SLL-N2). In addition, a differential pressure transducer (GP:50 216) [20] with 0.01 cm specified precision is installed to monitor the LAr level by measuring the pressure difference between the bottom and top of the dewar. The water concentration is measured by a Servomex DF-750e gas analyzer with a lowest detection level of 0.2 ppb. The oxygen and nitrogen concentrations are monitored by a Servomex DF-560e gas analyzer, with a lowest detection level of 0.2 ppb, and a Servomex K2001, with a lowest detection level of 10 ppb, respectively [21].
2.2 Electron Source: Photocathode and Laser System
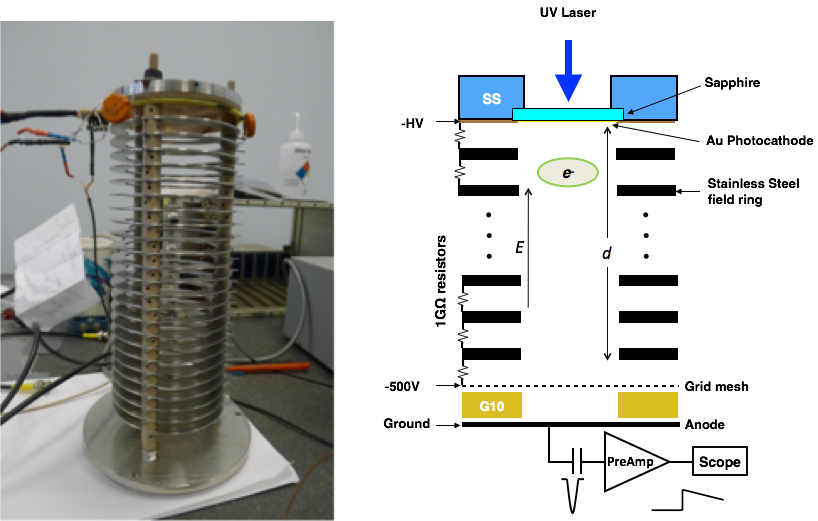
A photocathode immersed in the LAr, illuminated by a laser system, is used as a bright electron source. The laser-driven source typically has a small spatial dimension, on the order of m, and a pulse width on the order of 1 ns. The semi-transparent photocathode ( 50% UV transmission) is a 22-nm thick Au film evaporated onto a 1 mm thick, 10 mm diameter sapphire disk mounted in a stainless steel holder at the top of the drift stack as shown in Fig. 3. Photoelectrons are generated by irradiating the photocathode with a frequency quadrupled, 266 nm wavelength (4.66 eV) Nd:YAG laser (CNI MPL-F-266). As shown in Fig. 4, the laser is installed on an optical breadboard above the top flange of the dewar. The light path is formed with two dielectric mirrors. Along the light path, three mechanical flippers (Thorlab MMF001) are mounted in sequence to move a beam block, beam attenuator, and power meter (Thorlab S120VC) in and out of the light path. The mechanical flippers are controlled by the slow control system. The laser pulse is triggered by a signal generated by the control system. The laser operates stably at repetition rates between 1 kHz and 5 kHz. The trigger to the data acquisition system is initiated by one of the fast silicon photodiodes (Thorlab DET10A) located behind each dielectric mirror that receives the leakage photons. Photoelectrons are emitted into the LAr from the surface of the Au photocathode that is back-illuminated by the laser through an evacuated optical feedthrough tube sealed with sapphire optical windows. The laser beam is deflected into the optical feedthrough tube and steered onto the photocathode by a dielectric mirror at the top of the dewar as shown in Fig. 1. A lens installed between the mirror and the top sapphire window focuses the laser to a spot typically 150 m in diameter. The laser energy density on the photocathode is typically one order of magnitude lower than the damage threshold, measured to be about 6 mJ/cm2.


2.3 Electron Drift Stack
A drift stack has been constructed for the electron transport properties measurements, which is an improved version of the drift stack described previously in Ref. [12]. The field uniformity has been improved by a redesign of the rings and the cathode holder, and the charge noise has been reduced by integrating the pre-amplifier into the anode board and operating it in the LAr. The structure is similar to the LAr purity monitor implemented by ICARUS [22]. The photocathode holder assembly is composed of a 2 mm thick stainless steel plate with 10 mm aperture and 0.2 mm lip to hold the photocathode, which is clamped by another 1 mm thick stainless plate with 9.0 mm aperture. The photocathode is installed in the holder assembly with electric contacts to the holder as shown in Fig. 3. Negative high voltage is applied to the holder assembly. Field shaping rings with 1 mm thickness by 3.5 inch outer diameter and a 2.5 inch inner diameter are spaced 6 mm apart with three spacers made in Polyetheretherketone (PEEK) between each stage. A series of 1 G cryogenic compatible resistors make electrical contact with each ring and with the photocathode. The cathode and anode regions are separated by a grid made of stainless steel mesh with a wire width of 17 m on a 64 m pitch. This mesh is sandwiched between two 500 m thick G10 plates using Micro-Megas manufacturing technique [23]. The grid is installed on top of the anode board to screen the slow rise signal induced on the anode by the drifting electrons. The anode is a 1 inch diameter copper disk on a 3.5 inch diameter printed circuit board with the pre-amplifier circuit integrated at the outside edge of the same board. Drift distances from 6.5 mm to 250 mm in 7 mm steps can be achieved by adding or removing field shaping rings between the anode board and the photocathode.
2.4 High Voltage Power Supplies
Two high voltage power supplies are used in the system. The potential for the drift field is supplied by a Glassman model ER30 with an adjustable voltage range up to -30 kV. A Bertan model 1170 with a voltage range up -5 kV is used to establish the collection field between the grid mesh and the anode. In order to avoid collecting drifting electrons on the grid, the collection field must be significantly higher than the drift field. The collection field is typically set at 10kV/cm, which ensures grid transmission greater than 80% for drift fields below 1 kV/cm. The transmission has been computed by drifting electrons in an electric fields generated with Maxwell 3D for the measured grid geometry. The Glassman supply is connected to the drift stack with a custom HV feedthrough, consisting of a RG-8 cable cast into an epoxy housing that seals to the top flange. To avoid breakdown in the GAr, the conductor of the cable inside the dewar is hermetically sealed in Teflon insulation. The Bertan supply connection is through a commercial SHV conflat feedthrough mounted on the top flange and connected to a RG-58 cable.
2.5 Slow Control and Data Acquisition System
The slow control system consists of five functions. They are 1) monitoring and recording of system parameters, 2) controlling the HV supplies to establish specified drift and collection fields, 3) filling and level monitoring of the LN2 condenser, 4) laser and trigger control, and 5) system malfunction notification via email. Each function is implemented by an individual LabVIEW Virtual Instrument (VI) program. Three DAQ modules produced by National Instruments are utilized: two NI-6259 modules each with 16 channels of analog input/output at 16-bit precision and one NI-9217 module with 4 channels of RTD input at 24-bit precision. The NI-6259 module digitizes the analog output of sensors monitoring the key performance parameters of the system including pressures and levels of LAr and LN2. It also provides the analog output signal to drive the laser. The NI-9217 digitizes the various temperatures measured by RTD sensors. The cryogenic system monitoring VI continuously monitors and records the key performance parameters of the system including the pressures, temperatures, and levels of both LAr and LN2 every 60 seconds. The HV supply controller VI programs the voltages of the Glassman and Bertan supplies and monitors the voltage, current, and trip protection. The automatic condenser filling VI opens and closes the solenoid valve between the LN2 supply tank and the condenser with feedback from the level gauge to maintain the LN2 level in the condenser between specified set points. The laser driver VI provides the TTL pulse to trigger the laser and controls the mechanical flippers. The system alarm notification VI sends an email notification when the liquid nitrogen supply tank is empty.
As shown in Fig. 5, the charge of electrons arriving at the anode is converted to voltage by a charge sensitive pre-amplifier (BNL IO-538) which is mounted on the anode board immersed in LAr. This pre-amplifier has a sensitivity of 1 mV/fC, and a RMS noise of 1000 electrons at 87 K. The output of the pre-amplifier is amplified and shaped by an Ortec 572 NIM module. The voltage signals from the preamplifier, the shaping amplifier, and the fast silicon photodiode sampling the laser beam are recorded on an oscilloscope (Tektronix 4034B) triggered by the photodiode. The logic of the DAQ system is implemented as a LabVIEW VI which controls both the HV power supplies and the oscilloscope. It reads a table of HV settings and acquires and records data at each HV setting. A typical data set at 40 electric fields can be acquired in 15 minutes. The temperature variation over this period is less than 0.1 K.
3 System Operation and Performance
3.1 Cryogenic System Operation
The standard operation of the cryogenic systems involves the following steps.
- •
Testing for Leaks
Before filling with cryogens, the system is evacuated and tested for leaks with a vacuum helium leak check. This is necessary since leakage of air into the system is a source of impurities that lead to a loss of drifting electrons. This test requires no detectable helium leakage into the system with a calibrated detector with 1 10-8 standard cc/sec. sensitivity. - •
Pumping and Purging
Before filling with LAr, the system is evacuated to Torr and then filled with GAr with 99.999% purity to about 7 psig at room temperature in order to reduce the contamination in the dewar. This pump-and-purge cycle is repeated 2 - 3 times to dilute any contamination. - •
Cooling and Filling
The condenser is cooled to 100 K with LN2 to allow the condenser to be quickly filled once LAr is filled. The LAr supply dewar is connected to the supply tank with a flex hose insulated with Cryo-Lite and the system dewar is slowly cooled by flowing LAr into the bottom of the dewar. The flow is manually regulated during the cool down to maintain the system pressure below the 8 psig threshold of the relief valve. It takes about 1.5 hours to begin accumulating LAr in the dewar. It then requires another 20-30 minutes to fill the LAr to a level just below the lowest baffle plate. Once the LAr dewar is filled, the condenser is filled with LN2. - •
Continuous Operation
The evaporation of the pressurized LN2 in the condenser provides the cooling power to maintain the system at the targeted LAr temperature. Ideally, continuous and slow filling of LN2 is desired to provide constant cooling power to maintain a stable thermal condition in the system. However, since the LN2 transfer hose is not sufficiently well insulated, this mode consumes much more LN2 than an intermittent filling cycle, in which the transfer hose is on average at a higher temperature. We have therefore made a compromise between the desirability of thermal stability and the cost and nuisance of frequent LN2 dewar changes by operating in a intermittent fill mode. In the future we will obtain a vacuum jacked LN2 transfer hose. A cryogenic solenoid valve installed at the top of the condenser controls the filling cycle. A batch fill is initiated by opening the solenoid valve when the level of LN2 in the condenser falls to a low limit, and is terminated when the level of LN2 reaches a high limit. The entire batch filling process is controlled by the LabVIEW VI which compares the value measured by the capacitance level gauge installed in the condenser with stored limits, and opens and closes the solenoid valve accordingly.Fig. 6 shows a history of the LN2 level, pressure, and temperature during one day of operation. The low and high limits of LN2 level are set at 45% and 80% of the active length of the capacitance level gauge. The back pressure regulator is set at 28.5 psig to maintain the LN2 temperature at 87.9 K. Each peak on the pressure curve marks the beginning of a single fill. The increase in pressure during the fill is caused by the large flow rate of gas introduced into the condenser by the boiling LN2 in the hose and the warm top of the condenser. The back pressure regulator that controls this pressure has a non-zero compliance (pressure change per flow rate change), so with this large flow increase the pressure increases. The undershoot of the level below the low limit is due to the delay between opening the solenoid valve and the start of liquid arrival through the warm tubing into the condenser. The following sharp rise in the level is the actual filling of LN2. The slow decrease of the level is due to the evaporation of LN2 caused by condensation of the GAr as well as thermal leakage through the Cryo-Lite cryogenic insulation. This evaporation rate of LN2 is proportional to the total heat load of the system, which is measured to be about 46 W. Details of this measurement are discussed in Sec. 3.2.
Fig. 6 also indicates the temperatures of the LN2 and LAr during one day of operation. During the filling, the LN2 temperature slightly increases as a result of the increase of its pressure. The LAr temperature varies during the non-fill portion of the cycle due to the increased temperature of the LN2 during the fill followed by the slow decrease of thermal conductance of the condenser as the level of LN2 falls. The measurement time of electron transport properties in LAr is typically 15 minutes. During this time the temperature of LAr is maintained stable within 0.1 K as shown in Fig. 6, With the batch fill set between 45% to 80% of the active length of the capacitance level gauge, a complete filling cycle is 1.5 hours as shown in Fig. 6.
- •
System Purification
Impurities inside the main dewar are continuously removed by passing GAr through the purifier and returning the pure condensed LAr to the dewar. As the molecular sieve and the copper tablets absorb impurities, they become saturated and they rapidly cease to remove impurities. When the water and oxygen concentration begin to increase during circulation, the molecular sieve and the copper tablets must be regenerated to restore their effectiveness. To begin the regeneration process, the purifier cylinder is heated (with commercial electrical heating tape) to 190 . High purity argon gas is then flowed through the purifier for several hours, until the water concentration in the exhaust gas measured the Servomex DF-760e moisture analyzer falls below 100 part-per-million (ppm). This removes most of the water from the molecular sieve. Finally, the gas is changed to a mixture of high purity argon gas with 2% hydrogen, and this gas is flowed at a rate of 5 standard liters per minute until the water concentration of the exhaust gas is reduced to a few ppm. The complete process generally takes between 24 to 48 hours.

3.2 System Heat Load
An understanding of the system’s heat load is useful for optimizing cryogenic operations. The head load has been calculated with the Finite Element Analysis (FEA) tool CFDesign using a model including materials, insulation type, environmental boundary conditions, and GAr convection in the gas volume. This calculation gives a total power input of 50 Watts. This value is in agreement with two direct measurements. In the first, the heat input is deduced from the rate of LN2 consumed during the evaporation portion of one filling cycle. With the filling range set at 45% to 80% of the active length of the capacitance level gauge, 1.6 L of LN2 is evaporated during each cycle. This is equivalent to 48 Watts at the latent heat of vaporization of LN2 of J/g at 87 K. In the second measurement, the heat load is deduced from the change in the duration of the evaporation cycle when additional heat influx into the system. For this purpose, a heater immersed in the LAr (as described in Sec. 2.1) is used. The principle is as follows. During each evaporation cycle, the total heat removed is , where is the heat introduced by the heater, is the total heat load of the system (with the heater off), and is the time between the opening and closing of the solenoid valve. We thus expect
| (1) |
Therefore, the system’s heat load can be measured by varying the heater power and measuring the period of a filling cycle. The result of this measurement is shown in Fig. 7. The heat load is found by this method to be 46 5 Watts, consistent with the heat load of 48 Watts obtained by the previous method.
3.3 Argon Purity

The mass exchange rate for gas purification alone is typically small compared to the rate that can be obtained with liquid purification, since cryogenic pumps can easily achieve large liquid flow rates through purifiers in large LAr systems (such as LAPD [9]). However, the rate of outgassing of impurities depends strongly on the temperature [10]. At LAr temperature, the outgassing rate is negligible. Impurities in the system are then contributed only by outgassing from the surfaces of the GAr volume, which are at a higher temperature. Therefore, gas purification effectively removes impurities at their source. Although gas purification takes longer to clean dirty LAr, it can in principle maintain high purity liquid, provided that care is taken in the design of the system to minimize the direct transfer of impurities from the gas into the liquid (as, for example, by condensing gas directly into the liquid).
The water concentration is measured as a function of time after the initial fill from the supply tank as shown in the left panel of Fig. 8. There are two exponential decay processes during the purification. The first process, with a small time constant, occurs just after the initial fill. This is caused by the initial purging of the sampling tubing and the detector chamber volume in the gas analyzer. The second process, with a much longer time constant, is the purification of the liquid volume. The data are fitted by the function:
| (2) |
where is the water concentration in the unit of ppb; is the ultimate water concentration at infinite cleaning time; is the time; and are the amplitudes for the slow and fast process in units of ppb; and are the time constants of the fast and slow cleaning process, respectively. The fit gives the hours and hours. The fact that the ultimate water concentration approaches the limit of detection is an indication of the effectiveness of the gas purification system. Similarly, the measured oxygen concentration as a function of time is shown in the right panel of Fig. 8. The results demonstrate that gas purification is sufficient for reducing the water and oxygen concentration to 1 ppb. The achieved high purity LAr has also been confirmed in the electron transport properties measurement, as the free electron lifetime is found to exceed 400 s.
The reduction of nitrogen concentration is shown in Fig. 9. Although nitrogen has negligible influence on the free electron lifetime, its concentration is limited in practical LArTPCs to the order of a few ppm level in order to avoid quenching the production of scintillation light [24]. A similar fit with Eq. (2) shows hours and hours. The ultimate N2 concentration approaches 0.5 ppm, which is several orders of magnitude higher than those of water and oxygen. This is due to the fact that the molecular sieve adsorbs much less nitrogen than water, and quickly saturates. Therefore, the ultimate nitrogen concentration depends primarily on the quality of the commercial LAr supply.
Typically, the commercial LAr contains impurity concentrations on the order of ppm for water, oxygen and nitrogen. During operation, it typically takes about a week to reach the required purity level of 1.0 ppb level for water and oxygen. These concentrations are further reduced with continuous gas purification and ultimately reach the lowest detection levels of the analyzers. The effectiveness of the gas purification can potentially be used to optimize the purification procedure in large LArTPCs. For example, gas purification alone might be used as the primary method to maintain LAr purity after initial liquid purification during filling, significantly reducing the average power needed for the cyrogenic facilities. We note that this is in contrast to present practise and experience [25]. We intend to explore the limits of this optimization with the construction of a 1-ton LAr system in the future.
3.4 Photocathode Quantum Efficiency
The performance of the photocathode has been reported previously in [12] with a different experimental setup. The quantum efficiencies (QE) measured for our gold photocathodes in vacuum and LAr conditions are shown in Fig. 10. The QE is defined as the number of electrons collected by the anode per number of UV photons irradiating the back surface of the photocathode. The number of photons is determined by the laser power, as measured by the power meter, and the repetition rate. For the QE measurements, the anode is placed at the minimum drift distance of 6.5 mm away from the photocathode in order to minimize the impact of the finite free electron lifetime. The number of electrons is then determined by the amplitude of the charge-sensitive pre-amplifier signal. The pre-amplifier is calibrated with a known voltage pulse coupled through a known capacitor.
As shown in Fig. 10, QE measured in vacuum with this apparatus is significantly lower than reported in Ref. [12]. The results in Ref. [12] were obtained under two significantly different conditions: the entire setup is baked up to 90 and pumped to Torr, and the electron current measured is leaving the cathode. Since our main 20-liter dewar is vacuum insulated, no significant baking procedure is practical. In addition, the 20-liter dewar can only be pumped down to Torr with an order of magnitude larger volume (20 L vs. 2 L). 11 1 The surface area of this system is significantly larger, which naturally causes more outgassing. Without baking and in the poorer vacuum, surface contamination of the photocathode causes the QE in vacuum to be lower in this setup. However, since the contamination added by the argon is presumably similar in both systems, the QEs in LAr are closer for the two sets of measurements. The decline of QE at higher fields in our setup is presumably due to the decreasing transparency of the grid (absent in the results from Ref. [12]) as the drift field increases. As shown in Sec. 2.4, we have calculated the transparency for electrons drifting through our grid; a similar effect should occur in vacuum. The general increase in observed QE with field (after accounting for grid transparency) as shown by the QEs measured in Ref. [12] is caused by backscattering of electrons in the gold (for the vacuum case) and, additionally, in the LAr. It can be noticed that the QE increases faster in LAr than in vacuum. Overall, the number of electrons produced per pulse is 105 in LAr which is sufficient for the electron transport properties studies.
4 Discussion and Conclusion
In this paper, we describe the design and operational performance of a 20-liter LAr test stand with a gas purification system. Excellent thermal stability has been achieved, which is crucial for studies of electron transport properties in LAr. In addition, this system also demonstrates that high purity LAr can be obtained with only a gas purification system, which is simple in construction and low in cost. The measurements of electron transport properties, impurity exchange rates between GAr and LAr, and outgassing rates at low temperatures are continuing with this apparatus and will be reported in future publications.
Acknowledgements.
This works is supported by Laboratory Directed Research and Development (LDRD) of Brookhaven National Laboratory and U.S. Department of Energy, Office of Science, Office of High Energy Physics and Early Career Research program under contract number DE-SC0012704.Appendix
The piping and instrumentation diagram (P&ID) of our system is shown in Fig. 11 for reference.
References
- [1] M. Antonello et al. A Proposal for a Three Detector Short-Baseline Neutrino Oscillation Program in the Fermilab Booster Neutrino Beam. 2015, arXiv:1503.01520.
- [2] C. Adams et al. The Long-Baseline Neutrino Experiment: Exploring Fundamental Symmetries of the Universe. 2013, arXiv:1307.7335.
- [3] K. N. Abazajian et al. Light Sterile Neutrinos: A White Paper. 2012, arXiv:1204.5379.
- [4] X. Qian and P. Vogel. Neutrino Mass Hierarchy. Prog. Part. Nucl. Phys., 83:1, 2015, arXiv:1505.01891.
- [5] W. J. Willis and V. Radeka. Liquid argon ionization chambers as total absorption detector. Nucl. Instrum. Meth., 120:221, 1974.
- [6] D. R. Nygren. The Time Projection Chamber: A New 4 pi Detector for Charged Particles. eConf, C740805:58, 1974.
- [7] H. H. Chen, P. E. Condon, B. C. Barish, and F. J. Sciulli. A Neutrino detector sensitive to rare processes. I. A Study of neutrino electron reactions. FERMILAB-PROPOSAL-0496, 1976.
- [8] C. Rubbia. The liquid argon time projection chamber: A new concept for neutrino detector. CERN-EP/77-08, 1977.
- [9] M. Adamowski et al. The Liquid Argon Purity Demonstrator. JINST, 9:P07005, 2014, arXiv:1403.7236.
- [10] R. Andrews, W. Jaskierny, H. Jostlein, C. Kendziora, S. Pordes, and T. Tope. A system to test the effects of materials on the electron drift lifetime in liquid argon and observations on the effect of water. Nucl. Instrum. Meth., A608:251–258, 2009.
- [11] A. Ereditato, C. C. Hsu, S. Janos, I. Kreslo, M. Messina, C. Rudolf von Rohr, B. Rossi, T. Strauss, M. S. Weber, and M. Zeller. Design and operation of ARGONTUBE: a 5 m long drift liquid argon TPC. JINST, 8:P07002, 2013, arXiv:1304.6961.
- [12] Y. Li et al. Measurement of Longitudinal Electron Diffusion in Liquid Argon. Nucl. Instrum. Meth., A816:160–170, 2016, arXiv:1508.07059.
- [13] Cryofab: Cf series. http://www.cryofab.com/products/Cryogenic-Dewar-Flasks. Accessed: 02/02/2016.
- [14] Catalyst central: Products/gettermax 133. http://www.catalyst-central.com/product. Accessed: 03/27/2016.
- [15] K Mavrokoridis, R G Calland, J Coleman, P K Lightfoot, N McCauley, K J McCormick, and C Touramanis. Argon purification studies and a novel liquid argon re-circulation system. JINST, 6(08):P08003, 2011.
- [16] Lydall: Cryo-lite cyogenic insulation. http://www.lydallpm.com/products/low-temperature-insulation/cryolite-cryogenic-insulation/overview/. Accessed: 02/02/2016.
- [17] Equilibar: Back pressure regulator. https://www.equilibar.com/back-pressure-regulators/. Accessed: 02/02/2016.
- [18] Omega: General purpose rtd(pt100) probes. http://www.omega.com/pptst/PR-10.html. Accessed: 03/27/2016.
- [19] Omega: Solid state pressure transducer. http://www.omega.com/pptst/PX209_PX219.html. Accessed: 03/27/2016.
- [20] Gp:50: Model 216/316 low range high line differential pressure transducer. http://www.gp50.com/product/model-216-316-low-range-high-line-differential-pressure-transducer-automotive-testing/. Accessed: 03/27/2016.
- [21] Servomex: gas analyzers. http://ww3.servomex.com/gas-analyzers. Accessed: 02/02/2016.
- [22] G. Carugno, B. Dainese, F. Pietropaolo, and F. Ptohos. Electron lifetime detector for liquid argon. Nucl. Instrum. Meth., A292:580–584, 1990.
- [23] Y. Giomataris, Ph. Rebourgeard, J.P. Robert, and G. Charpak. Micromegas: a high-granularity position-sensitive gaseous detector for high particle-flux environments. Nucl.Instrum.Meth., 376(1):29 – 35, 1996.
- [24] B. J. P. Jones, C. S. Chiu, J. M. Conrad, C. M. Ignarra, T. Katori, and M. Toups. A Measurement of the Absorption of Liquid Argon Scintillation Light by Dissolved Nitrogen at the Part-Per-Million Level. JINST, 8:P07011, 2013, arXiv:1306.4605. [Erratum: JINST8,E09001(2013)].
- [25] M. Antonello et al. Experimental observation of an extremely high electron lifetime with the ICARUS-T600 LAr-TPC. JINST, 9(12):P12006, 2014, 1409.5592.