THz conductivity of Sr1-xCaxRuO3
Abstract
We investigate the optical conductivity of Sr1-xCaxRuO3 across the ferromagnetic to paramagnetic transition that occurs at . The thin films were grown by metalorganic aerosol deposition with onto NdGaO3 substrates. We performed THz frequency domain spectroscopy in a frequency range from 3 cm-1 to 40 cm-1 (100 GHz to 1.4 THz) and at temperatures ranging from 5 K to 300 K, measuring transmittivity and phase shift through the films. From this we obtained real and imaginary parts of the optical conductivity. The end-members, ferromagnetic SrRuO3 and paramagnetic CaRuO3, show a strongly frequency-dependent metallic response at temperatures below 20 K. Due to the high quality of these samples we can access pronounced intrinsic electronic contributions to the optical scattering rate, which at 1.4 THz exceeds the residual scattering rate by more than a factor of three. Deviations from a Drude response start at about 0.7 THz for both end-members in a remarkably similar way. For the intermediate members a higher residual scattering originating in the compositional disorder leads to a featureless optical response, instead. The relevance of low-lying interband transitions is addressed by a calculation of the optical conductivity within density functional theory in the local density approximation (LDA).
I Introduction
The optical response of a material provides access to its electronic behavior in a broad window of energy scales[1]. High-frequency ultraviolet and visible light spectroscopies probe interband transitions, which give rise to an onset in the frequency-dependent optical absorption, whereas infrared and THz spectroscopies at lower energies provide access to more subtle aspects of the collective low-frequency response of an electron gas. One of the most interesting aspects of the collective behavior are quantum phase transitions (QPTs)[2, 3]. Due to the absence of a characteristic scale near the QPT, one expects the optical response of such a material to be characterized by power laws. Power-law conductivity was found in several quantum-critical materials, such as MnSi[4, 1] and in cuprates close to optimal doping[1]. It was also observed in perovskite ruthenates[5, 6, 7, 8, 1], the subject of the present paper.
The perovskite-structured ruthenate system Sr1-xCaxRuO3 is a candidate material for a ferromagnetic QPT[9, 10, 11]. Its undoped parent compound SrRuO3 is an itinerant ferromagnet with ordering temperature K and is of great interest for both fundamental physics as well as applications[12], whereas the other parent compound, CaRuO3, is a paramagnetic metal. CaRuO3 has been argued to be close to the magnetic critical point as revealed by temperature dependence of dc resistivity[13] below 30 K and logarithmic term in the temperature-dependent specific heat[14]. Very recently, the observation of Shubnikov-de-Haas oscillations and resistivity below 1.5 K revealed that a fragile Fermi liquid is recovered at low temperatures. In SrRuO3 the Fermi liquid is more robust with resistivity up to about 10 K[13, 15].
THz and infrared optical studies on both compounds[5, 6, 7, 8] revealed an unusual optical response with the optical conductivity distinct from that of the Drude behavior that is given by
| (1) | |||||
| (2) |
with the Drude scattering time and zero-frequency conductivity[16]. A recent optical study on clean CaRuO3 samples revealed Drude behavior[17] consistent with Fermi liquid concepts, but only up to a frequency of 0.6 THz. Starting from 0.6 THz an abrupt increase of the optical scattering rate was found. A possible origin of this behavior is the coupling to a critical low-energy fluctuation.
A different point of view was offered in a very recent dynamical-mean-field theory study of CaRuO3[18], which pointed out the importance of low-lying interband transitions. Namely, the orthorhombic distortion of the cubic perovskite lattice leads to a series of mini-gaps (with the gap size of the order of THz), which significantly affect the optical response. A related tetragonal ruthenate Sr2RuO4 that occurs in a non-distorted structure does not show low-frequency deviations and exhibits a standard Fermi liquid optical response[19], instead. One needs to add however, that Sr2RuO4 was also argued to be further away from the quantum critical point[14].
In the present work we address the evolution of the optical response of Sr1-xCaxRuO3 as a function of composition, across the magnetic phase transition. We have grown thin films, and for the compositions and (denoted by solid symbols on the phase diagram in the inset of Fig. 1) the THz response was measured. The end-members of the series are sufficiently clean to exhibit optical conductivity that corresponds to a strongly frequency-dependent scattering rate. We investigate the optical response also theoretically within density functional theory in the local-density approximation. The calculated optical scattering rate for both CaRuO3 and SrRuO3 shows strong frequency dependence even though frequency-independent scattering is put into the calculation; this suggests the relevance of low-lying interband transitions.

The paper is structured as follows: in Sec. II we present the details of the sample growth and the experimental setup. In Sec. III we show the measured optical conductivities and the associated optical scattering rate. In Sec. IV we present the optical conductivity as calculated within the LDA approximation and discuss the relevance of the interband transitions with respect to the experimental results. In Sec. V we summarize and conclude, and in the Appendix we analyze the scaling properties of the measured conductivities.
II Samples and Experimental Setup

The epitaxial Sr1-xCaxRuO3 thin films were grown in Göttingen by metalorganic aerosol deposition (MAD) [21, 22]. We investigated the four different compositions SrRuO3, Sr0.6Ca0.4RuO3, Sr0.2Ca0.8RuO3, and CaRuO3, all deposited on NdGaO3(110) substrates. The thin films grow epitaxially on the substrate with the same [110] orientation. NdGaO3 is the substrate of choice: its lattice constant matches the thin films well, and its dielectric properties are convenient for transmittivity measurements. More precisely, for SrRuO3 the substrate leads to 1.7% of compressive strain[23, 24, 25] and for CaRuO3 to about -0.4% of tensile strain [12, 26, 17]. Our measurements of the lattice constant perpendicular to the substrate are consistent with the results referenced above (not shown). Another popular substrate, SrTiO3 has a very large frequency- and temperature-dependent dielectric function, which makes optical measurements difficult[27, 28].
| thickness(nm) | (K) | RRR | (cm) | (cm) | |
|---|---|---|---|---|---|
| 0 | 70 | 150 | 15 | 194 | 185 |
| 0.4 | 80 | 60 | 3.8 | 259 | 290 |
| 0.8 | 77 | - | 5.4 | 215 | 230 |
| 1 | 40 | - | 31 | 230 | 237 |
Some relevant sample properties are listed in table 1. All four samples are of high quality and clearly metallic, as evident from the resistivity curves and residual resistivity ratios (RRR) between 300 K and 0 K (extrapolated value) in Fig. 1 and table 1. While the SrRuO3 and CaRuO3 have high RRRs of 15 and 31, respectively, the higher disorder in the and samples enhances the scattering and reduces the RRR to 4 and 5.
The transmittivity and phase response of all samples was investigated in Stuttgart in a THz frequency domain spectrometer with a Mach-Zehnder interferometer[29, 30]. Fig. 2 shows raw data of CaRuO3 at 300 K and 5 K; for comparison, the transmittivity raw data of an empty NdGaO3 substrate are also plotted. A frequency range from around 3 cm-1 to 40 cm-1 was covered by measurements with five different backward wave oscillator sources. The prominent Fabry-Pérot type oscillations in the transmitted signal are typical to the raw data of metallic thin films on dielectric substrates and caused by the substrate, as indicated schematically in the inset of Fig. 2. The contribution of the film is a modulation of these substrate resonances: the difference between the data of bare NdGaO3 and CaRuO3 on NdGaO3 in Fig. 2(a) is caused by the film. While the pure NdGaO3 spectra are almost temperature independent, there is a strong temperature dependence in the thin-film samples. Already in the raw data we see a considerably lower transmittivity at 5 K than at 300 K due to an increased conductivity in the metallic film. The optical conductivity is evaluated directly from the raw data: since both transmittivity and phase are measured, no Kramers-Kronig analysis is required. Each Fabry-Pérot maximum is analyzed to obtain the complex conductivity and at its peak frequency.[16, 30] From these values, a frequency-dependent scattering rate can be calculated using the extended Drude formalism:
| (3) |
with being the plasma frequency, and the (free-)electron charge and mass and the charge carrier density.[16, 31]
III Results

Fig. 3 shows the frequency-dependent real and imaginary parts of the conductivity of all samples. The absolute values of are characteristic of metals and of the order of 104 cm-1. At temperatures above 100 K, all samples show nearly frequency-independent real and low imaginary parts: the scattering rate exceeds our measured frequency range. A maximum in has been observed in the mid-infrared at these temperatures. [1, 7] In our data there is no visible onset of this maximum, drops monotonically.[32]

In Fig. 1 we compare the THz response at our low-frequency limit (in particular the real part of the frequency-dependent resistivity ) with results from dc measurements. There is very good agreement between these two data sets. This suggests that at least in this temperature range there are no additional features in the optical conductivity at lower frequencies. Considering that dc resistivity current paths and THz beam spots probe do not necessarily probe the same sample areas, Fig. 1 also documents the homogeneity of the films.
III.1 SrRuO3
The and spectra of SrRuO3 for exemplary temperatures are shown in Fig. 3 (a) and (e), respectively. The spectrum, rather flat at high temperatures, changes upon cooling: below 40 K, develops a drop towards higher frequencies that moves to lower frequencies, down to around 12 cm-1 with decreasing temperature. In terms of the Drude model the drop indicates the scattering rate . To be consistent with a Drude interpretation, should show a maximum at the corresponding frequency, passing through our spectral range as a function of temperature[33] and leaving monotonous frequency-dependent behavior in the limiting cases, namely increasing for high temperatures and decreasing for low temperatures, as found in our data. To address the low-temperature properties of SrRuO3 in more detail, Fig. 4 shows for all measured temperatures below 40 K. In addition, we show Drude fits following eq. 1 for a few temperatures.


Within the measurement accuracy, the Drude fits describe the conductivity data well above 20 K. However, at lower temperatures, the conductivity of SrRuO3 deviates from the Drude fit because at high frequencies is not reduced further but remains constant.
This plateau for frequencies above 20 cm-1 is present in all spectra of Fig. 4 and becomes more evident with decreasing temperature. Since the plateau cannot be described as part of a single Drude term, the fit at 5 K only includes the points below 30 cm-1. For further analysis we use the extended Drude formalism, eq. 3. The obtained scattering rate is shown in Fig. 5(a) for the same temperatures as in Fig. 3. Above 40 K the scattering rate is basically constant as a function of frequency, corresponding to a simple Drude behavior. Below 20 K, Fig. 5(a) indicates a pronounced frequency dependence of the scattering rate, an increase towards higher frequencies.
Deviations from Drude behavior were noticed earlier by Dodge et al [6]. Our of SrRuO3 qualitatively follows this: flat for high temperatures with a broad low-frequency peak emerging at lowest temperatures. The high quality of our samples, achieved with MAD [22], leads to 2-3 times higher absolute values of at low temperatures compared to earlier experiments [6], which enables us to charactrerize those deviations in better detail.
For this purpose we turn to Fig. 6, where the scattering rate at 5 K is plotted. It is mostly frequency independent below 20 cm-1, in the range below the plateau in . Above 20 cm-1 it increases strongly with frequency, approximately by a factor of three between 20 cm-1 and 35 cm-1. This increase roughly corresponds to a quadratic FL-like frequency dependence, as indicated by the straight line in Fig. 6. However, the transition from a flat to a steep slope in this double-logarithmic plot is much too abrupt to fit the FL prediction in the entire frequency range. Clearly, simple Fermi-liquid considerations are not sufficient to explain the observed low-temperature frequency dependence of the scattering rate. The low-lying interband transitions[18] that can reproduce such a steep onset of optical scattering rate are discussed in Sec. IV.
III.2 Sr0.6Ca0.4RuO3 and Sr0.2Ca0.8RuO3
The conductivity spectra of the doped samples are shown in Fig. 3 (b), (c), (f), and (g). For both compositions, is almost constant, and is much smaller than ; this suggests a conventional metallic conductivity where the scattering rate is much higher than the studied spectral range. A weak frequency dependence only emerges at the lowest temperatures. Upon cooling, both and increase, which is consistent with a decrease in scattering rate. From the comparison of all samples in Fig. 3 we find that the conductivity of the doped samples is substantially lower than of the undoped ones. This we attribute to compositional disorder, which significantly increases the residual scattering. As expected, this effect is more pronounced for Sr0.6Ca0.4RuO3, where the disorder due to the composition will be particularly strong. This scenario is consistent with the comparatively small increase of the conductivity upon cooling, and correspondingly with the small residual resistivity ratio. Unlike in the undoped samples there is no strong roll-off in at low frequencies. The extended Drude analysis yields a mostly frequency-independent scattering rate (Fig. 5), substantially higher at low temperatures than in the pure compounds (Fig. 6).

Therefore the strong disorder scattering in the doped samples dominates their transport properties at low temperatures, which makes it impossible to deduce signatures of electronic correlations from the THz data at this stage. This is unfortunate, as Sr0.2Ca0.8RuO3 is located close to the QPT from ferromagnetism to paramagnetism, and here the influence of quantum-critical fluctuations to the electronic scattering would be of particular interest.
That the high scattering rate at low temperatures in these two samples indeed stems from the disorder is illustrated by a comparison with the pure compounds in Fig. 7. The main plot shows the scattering rate as a function of temperature, determined from the extended Drude analysis at 7 cm-1, for all samples of this study. The scattering rates of Sr0.6Ca0.4RuO3 and Sr0.2Ca0.8RuO3 basically are shifted to higher values when compared to SrRuO3, and this temperature-independent offset is stronger for Sr0.6Ca0.4RuO3. The inset of Fig. 7 shows the scattering rate as a function of Ca content for three exemplary temperatures. At the lower temperatures, the dome-shape dependence with minimal scattering for the pure compounds at the two outer ends and a maximum around the center is evident.
III.3 CaRuO3
CaRuO3 exhibits a similar behavior as SrRuO3: at high temperatures, is almost constant throughout our spectral range and is very small (see Fig. 3(d) and (h)). This is consistent with a frequency-independent scattering rate as shown in Fig. 5(d). Upon cooling, and continuously increase; down to approximately 40 K the frequency dependence of as well as is weak. This changes at lower temperatures (see Fig. 8): at frequencies below 10 cm-1, strongly increases while at higher frequencies it is rather constant or even slightly decreasing.

At the lowest temperatures, e.g. 5 K, this leads to a pronounced roll-off in between 5 cm-1 and 10 cm-1, followed by a non-Drude-like plateau. The frequency-dependent scattering rate, extracted from the extended Drude analysis, is shown in in Fig. 5(d), and the 5 K one is compared to the other compositions in Fig. 6.
The optical data on CaRuO3 was discussed earlier by Schneider et al., [17] and it was found to be inconsistent with Drude or FL behavior [35] above 15 cm-1 or so. The deviations from Drude behavior are displayed also on Fig. 8. The high quality of the CaRuO3 sample is evident from the low scattering rate at lowest temperatures, as clearly discernible from the comparison with the other samples in Fig. 7. With increasing temperature, this low-frequency scattering rate increases more strongly than for SrRuO3 (and the intermediate samples) due to stronger electronic correlations in the absence of ferromagnetism[37].
In previous optical studies on CaRuO3, Lee et al. mainly focused on data above 40 cm-1 in a large temperature range without measuring many low temperatures [7]. This study has substantial overlap in temperature and frequency range with Kamal et al. [8]. Our conductivity spectra match these two previous works well and are consistent if quantitative shifts due to our enhanced film quality are taken into account. In our study, the most pronounced frequency and temperature dependence of the conductivity is located at the lowest energies: temperatures below 20 K and frequencies below 10 cm-1, beyond the limits of the previous works. Scaling plots were proposed and were controversially discussed in Lee et al.[7] and Kamal et al.[8]. To compare with these earlier works, we replotted our data in the suggested form, see Appendix. Our data on SrRuO3 does not scale well. For CaRuO3, the scaling seems to be obeyed, but as was discussed in Ref. 8, the accessible frequency and temperature ranges are too narrow and the noise level too high to draw any firm conclusions.
IV Low frequency optical conductivity within LDA
Very recently it was argued that low-lying optical interband transitions, which are activated by orthorhombic distortions, might affect the optical response at unexpectedly low frequencies. In particular, a dynamical mean-field theory (DMFT) study[18] argued that the low frequency deviation from Drude optics in CaRuO3 occurs already at the level of band theory. As a test for the effects of the band structure in the simplest possible setting, we calculated the optical conductivity of SrRuO3 and CaRuO3 (in their bulk structure) using LDA as implemented in the Wien2k package. [38, 39] In this approach, the current matrix elements are evaluated from the band structure and the optical conductivity is evaluated for a frequency-independent scattering rate as described by a self energy . Similar approach was used in iron-based superconductors[40, 41] where also interband contributions were found to be important.
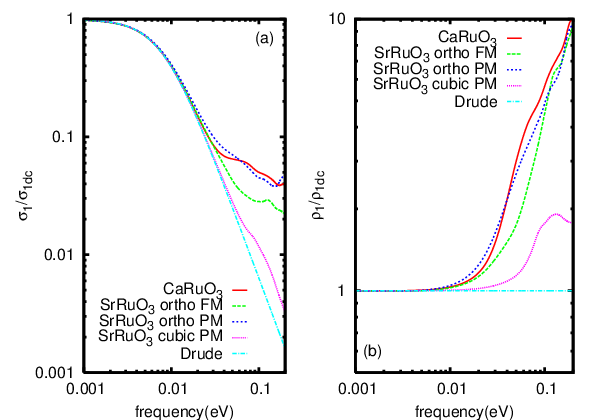
The frequency-dependent real part of the optical conductivity, normalized to the zero-frequency value, is displayed in Fig.9. One sees that the calculated optical conductivities for orthorhombic structures deviate from the Drude behavior at very low frequencies of the order of 20 meV. These deviations originate in low-lying interband transitions across mini-gaps that are opened up by orthorhombic distortions. Nonmagnetic SrRuO3 shows very similar behavior to CaRuO3 but with obvious deviations from Drude behavior at even lower frequencies, which is due to the fact that the orthorhombic distortion is smaller there. The shift of the bands due to the exchange splitting in ferromagnetic SrRuO3 (with moment 1.6 ) diminishes these deviations. The calculated optical conductivity in the cubic structure deviates from the Drude behavior starting at a higher frequency and in a much less pronounced way.
For easier comparison with the experimental data, we extracted also , which is proportional to the optical scattering rate as defined by the extended Drude formalism. This presents a very clear influence of the band-structure effect. Although the actual scattering rate put into the calculation is frequency independent, the inferred optical scattering rate (that attempts to describe the response of a multi-band system in terms of the response of a single-band one) exhibits a strong frequency dependence.
In these calculations, SrRuO3 and CaRuO3 show a deviation
from the Drude dynamics at a similar frequency of about meV. To
compare this value to the frequency in the experiment, one needs to
additionally divide the value by the corresponding renormalizations.
In CaRuO3, the measured specific heat is about 7 times above the
value found in the band theory.[42] Therefore the expected
frequency for the deviation from Drude dynamics is 20 meV/7 3 meV
( 0.7 THz 24 cm-1) and consistent with the experiment.
In SrRuO3 the renormalization is smaller, about 4 judging from the specific heat.[43] Furthermore, mostly the minority carriers (with the plasma frequency eV) and not the majority carriers (that correspond to small Fermi surfaces of the almost completely filled bands and the plasma frequency eV) contribute to the conductivity and within LDA+DMFT it was found[18] that the renormalization for these minority carriers is smaller, only about 2.
From these considerations, the deviation from Drude behavior through band structure effects would only be expected at a frequency scale above our experimental range. However, one needs to keep in mind that the growth of SrRuO3 on NdGaO3 substrate modifies the structure substantially[23, 24], which may decrease the corresponding scale. This should be tested in future theoretical calculations or experimentally by growth on different substrates.
V Conclusions and outlook
The optical conductivity of the four samples SrRuO3, Sr0.6Ca0.4RuO3, Sr0.2Ca0.8RuO3, and CaRuO3 of the material system Sr1-xCaxRuO3 with a QPT at were investigated with THz spectroscopy. The transmittivity and phase data revealed metallic behavior for all samples. The doped samples have a comparably high scattering rate due to compositional disorder, and their THz properties can be described within a simple Drude picture. The SrRuO3 and CaRuO3 samples, in contrast, at low temperatures have low scattering rates consistent with the high RRRs that could be achieved by MAD growth. At low temperatures, SrRuO3 and CaRuO3 can be described by a Drude response with constant scattering rate only up to approximately 20 cm-1. By calculating the optical response within the band theory we have shown that the deviations from Drude behavior may be caused by low-lying interband transitions. Especially for CaRuO3 the calculated response is very similar to the measured one, whereas for SrRuO3 the calculated scattering rate deviates at a frequency that is too high to account for our measurements. A possible origin of this discrepancy is a deviation of the thin-film structure from the bulk-one for which the calculations were made, an issue that needs to be explored in future work.
On the experimental side, future studies should on the one hand attempt to reach lower temperatures [30, 44, 45] and frequencies [46, 47] in particular to check if the crossover to a scattering rate quadratic in frequency that would indicate the elusive FL optical response [48, 49, 50, 51, 31] can be found. Furthermore, optical measurements on our MAD-grown samples at higher frequencies, in the infrared range, should be performed to allow direct comparison with previous studies of samples with somewhat lower RRR at infrared frequencies and to further investigate the nature of the non-Drude plateau. At these larger frequencies not only the band-effects but also the genuine contribution from correlations [18] will contribute.
Further improvement in sample growth can be envisaged, too. While the scattering rate for doped samples with random arrangement of Sr and Ca atoms will remain too high to reveal interesting behavior in our frequency range, further improvements of the residual scattering of CaRuO3 thin films have recently been achieved by growth on NdGaO3 substrates with vicinal cut [17]. THz studies on such samples might be more difficult due to birefringence in the substrate,[52, 53] but finally such studies might reveal even more clearly the unconventional scattering rate of CaRuO3 at THz frequencies.
VI Appendix - Scaling analysis
Previous optical studies found that data for SrRuO3 and CaRuO3 can be combined into a scaling plot following eq.
| (4) |
with scaling function .[8, 7] Such scaling of an experimentally accessible response can be a strong indication for quantum-critical behavior,[54, 55] but the initial suggestion[7] that the apparent scaling of in SrRuO3 and CaRuO3 should be interpreted as quantum critical was later rebutted.[8] To present our data in the context of the scaling analysis of those previous works, we plot vs. in Fig. 10, which should lead to data collapse if eq. 4 were appropriate to describe the data. While our high-temperature spectra collapse into a small region of the scaling plot for both samples, below 40 K the samples differ strongly: in the case of CaRuO3, within the experimental error, all temperatures collapse to one scaling curve, which slightly broadens for lower temperatures. For SrRuO3 the spectra fail to collapse below 40 K. Although CaRuO3 and SrRuO3 show similar features in their optical conductivities and scattering rates, they are different with respect to the low-energy scaling behavior. Our low-frequency and low-temperature spectra of SrRuO3 cannot be scaled by expression 4, while it works well for CaRuO3.

.
References
- [1] D. N. Basov, R. D. Averitt, D. van der Marel, M. Dressel, and K. Haule, Rev. Mod. Phys. 83, 471 (2011).
- [2] T. Vojta, Ann. Phys. 9, 403 (2000).
- [3] H. v. Löhneysen, A. Rosch, M. Vojta, P. Wölfle, Rev. Mod. Phys. 79, 1015 (2007).
- [4] F. P. Mena, D. van der Marel, A. Damascelli, M. Fäth, A A. Menovsky, J. A. Mydosh Phys. Rev. B 67, 241101 (2003).
- [5] P. Kostic, Y. Okada, N. C. Collins, Z. Schlesinger, J. W. Reiner, L. Klein, A. Kapitulnik, T. H. Geballe, M. R. Beasley, Phys. Rev. Lett. 81, 2498 (1998).
- [6] J. S. Dodge, C. P. Weber, J. Corson, J. Orenstein, Z. Schlesinger, J. W. Reiner, M. R. Beasley, Phys. Rev. Lett. 85, 4932 (2000).
- [7] Y. S. Lee, J. Yu, J. S. Lee, T. W. Noh, T. H. Gimm, H. Y. Choi, C. B. Eom, Phys. Rev. B 66, 041104 (2002).
- [8] S. Kamal, D. M. Kim, C. B. Eom, J. S. Dodge, Phys. Rev. B 74, 165115 (2006).
- [9] G. Cao, S. McCall, M. Shepard, J. E. Crow, Phys. Rev. B 56, 321 (1997).
- [10] P. Khalifah, I. Ohkubo, H. M. Christen, D. G. Mandrus, Phys. Rev. B 70, 134426 (2004).
- [11] D. Fuchs, C.L. Huang, J. Schmalian, M. Wissinger, S. Schuppler, K. Grube, and H. v. Löhneysen, Eur. Phys. J. Special Topics 224, 1105 (2015).
- [12] G. Koster, L. Klein, W. Siemons, G. Rijnders, J. S. Dodge, C. B. Eom, D. H. A. Blank, and M. R. Beasley, Rev. Mod. Phys. 84, 253 (2012).
- [13] L. Capogna, A. P. Mackenzie, R. S. Perry, S. A. Grigera, L. M. Galvin, P. Raychaudhuri, A. J. Schofield, C. S. Alexander, G. Cao, S. R. Julian, Y. Maeno, Phys. Rev. Lett. 88 (2002) 076602.
- [14] G. Cao, O. Korneta, S. Chikara, L. E. DeLong, P. Schlottmann,Sol. State. Comm. 148 (2008) 305.
- [15] A. P. Mackenzie, J. W. Reiner, A. W. Tyler, L. M. Galvin, S. R. Julian, M. R. Beasley, T. H. Geballe, A. Kapitulnik, Phys. Rev. B 58 (1998) 13318(R).
- [16] M. Dressel and G. Grüner Electrodynamics of Solids, Cambridge University Press (2002).
- [17] M. Schneider, D. Geiger, S. Esser, U. S. Pracht, C. Stingl, Y. Tokiwa, V. Moshnyaga, I. Sheikin, J. Mravlje, M. Scheffler, and P. Gegenwart, Phys. Rev. Lett. 112, 206403 (2014).
- [18] H. T. Dang, J. Mravlje, A. Georges, and A. J. Millis, Phys. Rev. Lett. 115, 107003 (2015).
- [19] D. Stricker, J. Mravlje, C. Berthod, R. Fittipaldi, A. Vecchione, A Georges, and D. van der Marel, Phys. Rev. Lett. 113, 087404 (2014).
- [20] M. Schneider, V. Moshnyaga, and P. Gegenwart, Phys. Status Solidi B 247, 577 (2010).
- [21] A. Sidorenko, P. Petrenko, A. Weidinger, M. Zeitler, B. Rauschenbach, R. Tidecks, K. Samwer, V. Moshnyaga, and I. Khoroshun, Appl. Phys. Lett. 74, (1999).
- [22] M. Schneider, V. Moshnyaga, P. Gegenwart, J. Phys.: Conf. Ser. 200, (2010).
- [23] R. Aso, D. Kan,Y. Shimakawa, H. Kurata, Cryst. Growth Des. 14, 2128, (2014).
- [24] A. T. Zayak, X. Huang, J. B. Neaton, K. M. Rabe Pys. Rev. B 77 214410, (2008).
- [25] W. Lu, W. Song, P. Yang, J. Ding, G. Moog Chow, and J. Chen, Scientific Reports 5, 10245 (2015).
- [26] A. Vailionis, W. Siemons, G. Koster, Appl. Phys. Lett. 93, 051909 (2008).
- [27] D. Geiger, M. Scheffler, M. Dressel, M. Schneider, P. Gegenwart, J. Phys.: Conf. Ser. 391, 012091 (2012).
- [28] M. M. Felger, M. Dressel, M. Scheffler Rev. Sci. Instrum. 84, 114703 (2013).
- [29] B. P. Gorshunov, A. A. Volkov, A. S. Prokhorov, I. E. Spektor, Phys. Solid State 50, 2001 (2008).
- [30] U. S. Pracht, E. Heintze, C. Clauss, D. Hafner, R. Bek, S. Gelhorn, D. Werner, M. Scheffler, M. Dressel, D. Sherman, B. Gorshunov, K. S. Il’in, D. Henrich, M. Siegel, IEEE Trans. THz Sci. Technol. 3, 269 (2013).
- [31] M. Scheffler, K. Schlegel, C. Clauss, D. Hafner, C. Fella, M. Dressel, M. Jourdan, J. Sichelschmidt, C. Krellner, C. Geibel, F. Steglich, Phys. Status Solidi B 250, 439 (2013).
- [32] Our measured data start with dc measurements (), followed by frequencies from around 5 cm-1 to 40 cm-1. We find that at the lowest frequencies it becomes increasingly difficult to obtain precise values for the concuctivity because of stray radiation: a fraction of the comparatively broad THz beam can reach the detector without interfering with the sample and therefore cause a higher experimentally determined transmittivity. This becomes most evident at high conductivity values because the absolute signal strength is already very low. In our measurements with highest (found in the undoped samples at low temperatures) the lowest frequency point is lower than expected. We attribute this feature to stray radiation and do not interpret it in terms of a physical property of the sample.
- [33] M. Dressel and M. Scheffler, Ann. Phys. (Leipzig) 15, 535 (2006).
- [34] At the highest frequencies, correspondingly at the shortest wavelength, the THz phase measurement is more difficult, thus leading to less reliable data in and , which in our case might be particularly the case for the measurements on the rather thick SrRuO3 sample, with its low overall THz transmitted signal, above 40 cm-1
- [35] C. Berthod, J. Mravlje, X. Deng, R. Žitko, D. v. d. Marel, and A. Georges Phys. Rev. B 87, 115109 (2013)
- [36] K. Yoshimura, T. Imai, T. Kiyama, K. R. Thurber, A. W. Hunt, K. Kosuge, Phys. Rev. Lett. 83, 4397 (1999).
- [37] H. T. Dang, J. Mravlje, A. Georges, A. J. Millis, Phys. Rev. B 91, 195149 (2015).
- [38] P. Blaha, K. Schwarz, G. Madsen, D. Kvasnicka, and J. Luitz, WIEN2k, An Augmented Plane Wave + Local Orbitals Program for Calculating Crystal Properties (Technische Universitat Wien, Vienna, 2001).
- [39] C. Ambrosch-Draxl and J. Sofo, Comp. Phys. Comm. 175, 1 (2006).
- [40] L. Benfatto, E. Cappelluti, L. Ortenzi, L. Boeri, Phys. Rev. B 83, 224514 (2011).
- [41] M. J. Calderon, L. de Medici, B. Valenzuela, E. Bascone, Phys. Rev. B 90, 115128 (2014).
- [42] M. Shepard, S. McCall, G. Cao, J. E. Crow, J. Appl. Phys. 81, 4978 (1997).
- [43] P. B. Allen, H. Berger, O. Chauvet, L. Forro, T. Jarlborg, A. Junod, B. Revaz, G. Santi, Phys. Rev. B 53, 4393 (1996).
- [44] N. Bachar, U. S. Pracht, E. Farber, M. Dressel, G. Deutscher, and M. Scheffler, J. Low. Temp. Phys. 179, 83 (2015).
- [45] D.N. Basov, S.V. Dordevic, E.J. Singley, W.J. Padilla, K.S. Burch, J.E. Elenewski, L.H. Greene, J. Morris, and R. Schickling, Rev. Sci. Instrum. 74, 4703 (2003).
- [46] M. Scheffler and M. Dressel, Rev. Sci. Instrum. 76, 074702 (2005).
- [47] K. Steinberg, M. Scheffler, and M. Dressel, Rev. Sci. Instrum. 83, 024704 (2012).
- [48] M. Dressel, J. Phys.: Condens. Matter 23, 293201 (2011).
- [49] U. Nagel, T. Uleksin, T. Rõõm, R. P. S. M. Lobo, P. Lejay, C. C. Homes, J. Hall, A. W. Kinross, S. Purdy, T. J. Williams, G. M. Luke, T. Timusk, PNAS 109 (2012).
- [50] A. V. Chubukov, D. L. Maslov, Phys. Rev. B 86, 155136 (2012).
- [51] D. L. Maslov, A. V. Chubukov, Phys. Rev. B 86, 155137 (2012).
- [52] M. Scheffler, J. P. Ostertag, and M. Dressel, Opt. Lett. 34, 3520 (2009).
- [53] J. P. Ostertag, M. Scheffler, M. Dressel, and M. Jourdan, Phys. Rev. B 84, 035132 (2011).
- [54] A. Schröder, G. Aeppli, R. Coldea, M. Adams, O. Stockert, H. v. Löhneysen, E. Bucher, R. Ramazashvili, P. Coleman, Nature 407, 351 (2000).
- [55] O. Stockert, H. v. Löhneysen, W. Schmidt, M. Enderle, M. Loewenhaupt, J. Low Temp. Phys. 161, 55 (2010).