New Observations of Balmer Continuum Flux in Solar Flares
Instrument Description and First Results
keywords
Flares, white light Spectrum, continuum Flares, spectrum1 Introduction
Spectral observations of solar flares have been carried out in lines of various species, but also in the continua ranging from EUV up to microwaves. Several recent studies indicate that the continuum radiation represents a significant portion of the total energy which is deposited in the lower atmospheric layers e.g. by the electron beams (Watanabe et al., 2013; Kerr and Fletcher, 2014; Milligan et al., 2014). Among these continua, the most intriguing is the optical continuum detected between the hydrogen Balmer-jump region and near infrared spectral bands. Flares exhibiting such emissions are called ’white-light flares’ (WLF). Neidig (1989) defined solar WLF as components of flares that are visible in the optical continuum or integrated light. The WLF emission appears as patches, waves, or ribbons often containing bright kernels smaller than 3 arcsec. Neidig and Cliver (1983) also stated that WLFs are associated with more energetic EUV and X-ray flares. Jess et al. (2008) measured 300% increase in solar white light continua lasting 2 min and being co-temporal and co-spatial with the flare event. They suggested that the creation of white-light emission is a common feature of all solar flares including less energetic ones. This is in contrast to Fletcher et al. (2007) and Fletcher and Hudson (2007) who claimed that the mechanisms of small WLFs are still open to debate.
However, the detection of WLFs is difficult because they are short-lived events usually co-temporal with the impulsive onset of flares and not well correlated with e.g. the H line kernels. Moreover, there are apparently two types of WLFs which have different spectral signatures (Ding, 2007): (I) optical continuum enhancement over a broad wavelength range which is assigned to a photospheric temperature increase below the temperature-minimum region (photospheric H- continuum), and (II) hydrogen recombination continua produced mainly in the flaring chromosphere. The latter continua span a wide range of wavelengths, from EUV (Lyman continuum) up to infrared. Having good spectral coverage by ground-based or space instruments, one could in principle disentangle between these two types of WLFs. But this is not usually the case in optical flare observations where typically one or a few wavelength channels are used, like three narrow-band channels on the Solar Optical Telescope (SOT) of Hinode (Kerr and Fletcher, 2014). While the broad-band continuum is frequently fitted by a black-body curve in order to estimate its temperature (see the above references), such a fit leads to too low enhancement of the Balmer continuum which contradicts the numerical simulations (Kleint et al., 2015). Various attempts have been made to detect the Balmer continuum enhancement during flares, but the results are rather controversial. In some case the Balmer jump was detected (e.g. Zirin and Neidig, 1981; Hiei, 1982), in others only a smooth transition from the so-called ’blue continuum’ (Donati-Falchi, Falciani, and Smaldone, 1985; Kowalski et al., 2015) to the Balmer continuum was detected (see also summary by Neidig, 1989). Many flare spectra with good spectral resolution have been collected at the Ondřejov Observatory during the sixties, but Švestka (1966) claimed that there was no evidence of the Balmer-continuum enhancement. However, this might be because of the photographic technique used at that time. Only recently, Heinzel and Kleint (2014) have found a clear signature of the continuum enhancement in the far wing of Mg ii h-line during an X1-class flare observed by the Interface Region Imaging Spectrograph (IRIS) satellite and they attributed this emission to the Balmer continuum. This is promising, but in order to determine reliably the spectral shape of the continuum, we need simultaneous observations of the Balmer continuum in more than one narrow-band channel. We therefore started a systematic observing program of detecting the Balmer continuum from ground and we designed a novel instrument as described in this paper.
2 Instrument
As mentioned above, WLFs are usually short-lived brightenings and thus it is very difficult to detect them at the right position (with the spectrograph slit) and at the right time. It is also difficult to detect them in the integrated solar flux by observing the Sun as a star - the contrast is too low because of the bright optical continuum of the whole solar disk (contrary to EUV continua observed by the Extreme Ultraviolet Variability Experiment (EVE) on the Solar Dynamics Observatory (SDO); see Milligan et al. (2014) and references therein.) Note that on cool dMe stars the situation is much more favorable; see Kowalski et al. (2013). We therefore suggest to use a special instrumental setup which allows us to detect the optical spectra in certain wavelength range only from a limited area of the solar disk covered by an active region where the flare occurrence is expected. We have considered the following requirements for the ground-based feeding telescope and for the new post focal spectroscopic instrument:
- •
high ratio D/f of the objective to have enough light ( and are the diameter and focal length, respectively)
- •
stable guiding system to follow selected active region for a long time
- •
continuous imaging of the active region through the H filter
- •
imaging of the diaphragm position on the H filtergram
- •
broad-band spectrometer with high sensitivity in the continuum
- •
high cadence up to 50 recordings per second
- •
an accurate image selector that picks up a proper target region on the solar disk
Note that the seeing issues, extremely important for slit instruments, are not critical here because of the flux integration of the whole active-region/flare area. During the device development period we found that all the above mentioned parameters of the experiment are important, but the most critical is the way how the area to be measured is selected in the optical system.
As the ground-based telescope we used the large horizontal telescope Horizontal Sonnen Forschungs Anlage 2 (HSFA2) of the Ondřejov Observatory described by Kotrč (2009) with a Jensch-type coelostat located 6 m above the ground and with the main objective mirror =50/3500, where both and are in cm. The diameter of the solar disk at the focal plane of the HSFA2 telescope is 32 cm. A new device called the Image Selector was placed into the focal plane of the telescope (see Figure \irefschema) to feed both the H filter and the spectrometer HR4000 (see below).

The light from the telescope HSFA2 enters the Image Selector through an inclined glass wedge, which is covered with coatings to reduce the light above 400 nm where the signal becomes much stronger compared to the Balmer limit region. Behind the wedge, there is a rotating wheel with seven circular diaphragms each having a central entrance hole and an outer rim which is highly polished to ensure the back-reflection of unused light. The internal shell of each diaphragm has a conical shape to reduce the parasitic light. The diaphragms have the holes 4, 8, 10, 12, 14, 16, and 18 mm in diameter which correspond to 23, 46, 57, 69, 80, 92, and 103 arcsec of the focal image, respectively. Only light from the portion of the solar image which is projected onto the diaphragm hole enters the flux detection optics. This is achieved by using a collecting lens (vertical line with two arrows in Figure 1) and an optical fiber behind it which feeds the spectrometer HR4000. The grating and the detector of the spectrometer were selected to have up to 0.02 nm (FWHM) spectral resolution covering 350 – 440 nm spectral range. The spectrometer has a linear CCD detector with 3648 pixels. Depending on the amount of light, the spectrometer can achieve a cadence of up to 50 frames per second. The spectrometer HR4000 is a low-cost low-dispersion compact instrument made for laboratory and educational purposes by Ocean Optics Co., USA (the instrument comes with the software and can be easily connected to a PC). It detects very well the solar continuum radiation and also resolves the strongest Fraunhofer lines which typically go into emission during flares.
Part of the light is reflected from the first optical surface (the front side of the wedge) of the Image Selector and together with the enhanced reflection from the circular rim of the diaphragm, the beam enters the H telescope - this provides information about the flaring activity within the monitored region. The inner circle of the bright circular rim projected onto the H images delimits the region where the spectral flux is measured. The anti-reflection coatings both on the glass-wedge surfaces and on the collecting lens feeding the optical fiber reduce the scattered light to minimum. The usual cadence of the H monitoring is about one image per second. The rotation of the diaphragm wheel, the spectrometer itself, and the H telescope are controlled by a PC which also stores all the data. Spectra are corrected for dark frames and are flat-fielded.
3 Measurements
We used the following scheme of observations. According to a solar flare prediction and actual activity we have selected an active region and projected it to the center of a diaphragm of an appropriate size. Before that, dark frames and flat-field images were taken. Then the selected active region was tracked and the exposure times both at the spectrometer detector and the H camera were set up. As the amount of light changes considerably with the altitude of the Sun, the flat field images and the exposure times have to be adjusted for new data series.
Shortly after the active region NOAA 12087 appeared above the south-east limb, three X-class flares were detected by the Geostationary Operational Environmental Satellites (GOES). None of them was accompanied by CME. The first two, X2.2 (SOL2014-06-10T11:42) and X1.5 (SOL2014-06-10T12:52) flares, were observed with our instrument on 10 June 2014, but not from the beginning of the flare. In addition, their positions close to the eastern limb (S19E81 and S20E89) complicated the integrated flux measurements due to the emission lines from the nearby limb region. On 11 June 2014 the AR 12087 was at S18E57 (-755 arcsec, -297 arcsec; =0.39) and was of Hale class, with five spots and produced an X1.0 flare (SOL2014-06-11T09:06). This flare was observed during all its duration, in total 25 min 25 s, including several minutes of pre-flare phase.
In Figure \irefslit-jaw four H filtergrams from reflection on the Image Selector during the flare of 11 June (SOL2014-06-11T09:06) are shown. Note the bright circular reflection from the polished front of the diaphragm of diameter 10 mm (57 arcsec) which was selected for this active region. The south-eastern solar limb was positioned to the left of the flare position, S18E57. On the first image (top left) no flare in H was yet detected.

A small portion of light from the solar image is reflected from the front surface of the Image Selector, and together with the circular reflection on the front part of the diaphragm it enters the H camera. During the flare evolution we observed the developing bright kernels in H with a cadence 1 secs. The spectrometer cadence was 11 spectra per second while its integration time was 30 ms.
One of the three flare kernels (the most south-western one) was projected on the front part of the diaphragm and thus it had no contribution to the spectral flux measurement. Without moving the image of the solar disk during the flare observation we kept the background radiation unchanged. This is particularly important when the flare is close to the solar limb.
In Figure \irefexcesy-all we can see examples of the net increase in the spectral flux as collected by the Image Selector and detected by the spectrometer. The spectral excess was prominent during the flare from 350 nm up to 410 nm. In the upper pair of images the measurement before the flare onset can be seen. Note the Ca ii lines in absorption. But later, around the flare maximum, both the calcium as well as higher Balmer-series lines were visible in emission. We thus see that selected Fraunhofer lines changed their shapes gradually from absorbtion to emission (see the right column in Figure \irefexcesy-all).
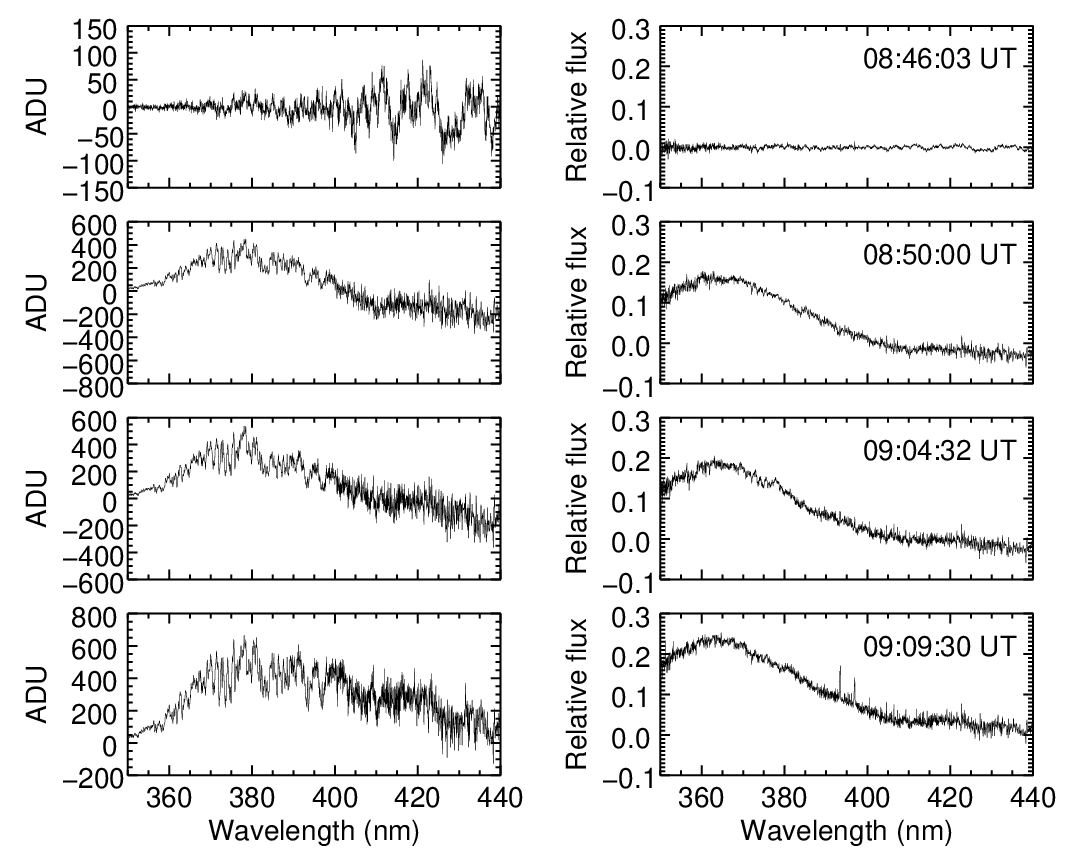
The maximum spectral increase occurs at the wavelength 364.6 nm which is the Balmer limit (Balmer jump) and the wavelengths shorter than that is known as the Balmer continuum. The spectral flux excess during the flare was detected in all the measured range of wavelengths below 410 nm, which is often called a ”blue continuum” (Donati-Falchi, Falciani, and Smaldone, 1985). Both the net and the relative excess can be seen at the lower three pairs of spectra in Figure \irefexcesy-all.
We studied also the light curve of the Balmer-continuum channel and compared it with the light curve of the H signal. The latter was defined as the maximum signal in ADU (analog-to-digital converter unit) in the H camera. This value is taken as a proxy of the H signal. It is reliable before it reaches the maximum value equivalent to the 8 bit camera, then the signal becomes saturated. Both these light curves can be seen in the lower part of Figure \irefcomposed. Unfortunately for this flare we found no other observation of H light curve with a comparable time resolution.

4 Analysis
In each processed H image we marked the circle delimiting the measured area. Inside the circle we specify flare kernels as an area where we measured the signal equal to at least the double median value in the whole image. Then the ratio of the number of pixels in the flare kernels to the total number of pixels inside the measured area gives the ratio between the flare area and that covered by the Image Selector circular diaphragm. For the analyzed flare this was in the interval 3.0 - 5.8 %. The measured relative excess of the continuum flux at 350 nm was between 13 - 17 %, while at the maxima of the curve it was between 17 - 21 % (see Figure \irefexcesy-all). Assuming that the flare kernels emitting in the Balmer continuum were of the same size as those in H, the reconstructed relative excess of the Balmer continuum should be in the range from 230 to 550 % and this will be even larger for smaller kernels.
To compare the measured spectral flux enhancement with the models of Heinzel and Kašparová (2015) we calibrated our measurements using the continuum intensities tabulated by Allen (1976). The intensity of the quiet Sun is related to the signal measured before the first signatures of a flare. After the flaring kernels have appeared on H images, we subtracted the spectral signal in the Balmer-continuum channel for the quiet Sun from the signal in the same channel at the flare time. Finally we divided this value with the ratio between the flaring area and the whole measured circular area as calculated from the respective H image. After taking into account the center-to-limb variations, we obtained the intensity of the flare kernels. The recalculated specific intensity of the Balmer continuum at 350 nm in this flare was from 9 to 15 (or from 14 to 23) erg s-1 cm-2 sr-1 Hz-1 according to selected type of calibration. These values are consistent with the intensity enhancement at 350 nm, computed by Heinzel and Kašparová (2015) for the static flare models of Ricchiazzi and Canfield (1983) with a flux of 1011 erg s-1 cm-2, spectral index 3-5, and coronal pressure 102-103 dyn cm-2. Such models are representative of a strong flare with the electron beam precipitating to chromospheric layers. However, in this exploratory study we did not intend to analyze our new measurements around the Balmer limit at 364.6 nm for the following reasons. It is well known that during flares, highest members of the Balmer series merge together due to significant Stark broadening and a quasi-continuum is formed in front of the Balmer limit as a result of the lowering of the hydrogen ionization potential (see Donati-Falchi, Falciani, and Smaldone (1985) and references therein). Detailed discussion on the formation of the Balmer continuum around the limit can be found in Kowalski et al. (2015). Based on our measurements, we interpret the flare continuum enhancement at 364 nm as the emission of optically-thin Balmer recombination continuum not affected by rather complex processes which take place around the Balmer-continuum limit. Our result is consistent with the analysis of IRIS spectra taken during an X-class flare in the near-UV wavelengths - see Heinzel and Kašparová (2015). The models which fit best our observations have the optical thickness at the Balmer jump lower than unity at =0.39 (position of our flare), typically between 0.1 - 0.7. This is the optical thickness of the chromospheric layer in which the Balmer-continuum enhancement is produced. However, the total optical thickness of the Balmer continuum including the whole photosphere is much larger than unity. In the case of stellar flares (dMe stars) it is likely that the chromospheric Balmer continuum is optically thick in models with strong fluxes, stronger than considered in our modeling (see e.g. Kowalski et al., 2015).
The light curves of the Balmer continuum and of the H proxy were observed since 08:43 UT, i.e. 16 min before the H flare steep rise till 9:10 UT. In Figure \irefcomposed we can compare them with the X-ray light curves as measured by the Reuven Ramaty High-Energy Solar Spectroscopic Imager (RHESSI; Lin et al., 2002). During the event all the light curves varied substantially, but, there is no precise correlation between them. The Balmer-continuum emission slightly decreased at 8:47 UT (8 min before the flare started in H). A similar decrease was also detected in the Lyman continuum with the SDO/EVE spectrometer which detects the total flux from the whole flare region (R.Milligan, private communication). Then the Balmer-continuum sharply increased from 530 to 650 ADU peaking at 8:50 UT. This local maximum of the Balmer continuum flux coincided with a gradual rise of the 3 - 12 keV channel of RHESSI signal having its maximum at 8:52 UT. Thus the first Balmer continuum changes occured about 10 - 12 min before the flare in H began. We can see a rough coincidence among the 12-25 keV signal, H intensity, and the Balmer continuum peaks around 08:51 UT. The 25-100 keV peak coincided with the double peak in Balmer continuum flux. The differences can be due to different integration areas of RHESSI and our Image Selector on the solar disk containing the flare kernels. In Figure 2 we see that one bright H kernel appeared around the flare maximum just on the bright rim of the Image Selector and this represents a missing signal in the Balmer-continuum flux around this time where we get a decrease between the two peaks in Figure 4. The Balmer signal at the RHESSI hard X-ray maximum is about 650 units. This corresponds to two kernels within the diaphragm, so that a mean signal from one kernel is more than 300 units. Adding this value as a missing signal from the third kernel will increase the total signal to more than 900 units and thus will produce a clear peak of the Balmer signal at time of the hard X-ray maximum. Note that Heinzel and Kleint (2014) found a good correlation between Balmer-continuum enhancement and RHESSI signal.
5 Summary and Conclusions
We have developed a new post-focal instrument called the Image Selector, attached to a broad-band spectrograph HR4000 for measurements of the spectral flux during solar flares. The basic idea behind this experiment is to integrate the continuum flux from the whole flare area. This eliminates problems with detecting a WLF kernel on the spectrograph slit and also avoids difficulties caused by the seeing. Our setup is similar to that for observing the Sun as a star, but by using only a small area around the flare instead of the whole solar disk, we substantially increase the continuum enhancement contrast detected during flares. Moreover, we are recording the broad-band continuum spectra which was done recently only in case of flare stars. The Image Selector technique has proven to be sensitive enough to detect solar flux increase in the spectral region of the hydrogen Balmer continuum. Relative excess of the Balmer continuum flux (irradiance) in the measured X1.0 flare reached at least 230 % - 550 % as compared to the pre-flare situation. The reconstructed Balmer continuum specific intensity (radiance) at 350 nm for this flare was from 9 to 15 (or from 14 to 23) erg s-1 cm-2 sr-1 Hz-1, according to the selected type of calibration. This is in good agreement with theoretical synthetic spectra computed by Heinzel and Kašparová (2015, in preparation) who predicted Balmer-continuum enhancement in a strong flare heated by the electron beam precipitating into lower atmospheric layers and is also consistent with recent detections by IRIS (Heinzel and Kleint, 2014). We have also shown the temporal variations of the Balmer-continuum flux and compared them with the H proxy light curve and with RHESSI hard X-ray fluxes, but more observations are certainly needed to estimate the precise degree of correlations. We found temporal changes in Balmer continuum flux starting even 16 min before the onset of the flare in H. If it is found out to be true, this information could be used for a short time prediction of the flare activity in a given active region. During the impulsive phase of the flare (i.e. after the flare onset), the hydrogen continua are formed by radiative recombination while the H line formation is mostly due to collisional (thermal and non-thermal) excitation. Before the flare onset in H, the situation can be more complex and this will require new simulations.
Having an instrument with high cadence measurements of the spectral flux in blue continua emitted from a limited flaring region, we would be able to study individual spectral regions responsible for different mechanisms of the creation of the continua. Then, using a statistically larger set of observations we could sort out individual WLFs into group I or II.
As our first observational results are very promising, we plan to install behind the Image Selector another similar Ocean Optics spectrometer to cover longer wavelengths. This will allow us to detect the hydrogen Paschen continuum including the Paschen limit, as well as the whole optical continuum which can be enhanced due to a photospheric temperature increase (H- continuum). Both such low-cost low-dispersion spectrometers will operate simultaneously, together with the H imaging. Because of its compactness and low weight, it will be possible to mount this system on other solar telescopes. Such relatively simple observations will help to clarify the role of the continuum emission during solar flares and to prove the statement of Jess et al. (2008) that the WLF emission is a common feature of all solar flares including less energetic ones. It will be promising to use the Optical and Near-infrared Solar Eruption Tracer (ONSET) telescope (Fang et al., 2013). A very interesting observations mentioned by Cheng et al. (2015) and Hao et al. (2012) show that the 3600 Å flare kernel is much smaller than the H one. If our analysis is applied, it will lead to a strong Balmer-continuum intensity enhancement as derived from the flux, consistent with our discussion in Section 4. Future joint observations with our instrument and with ONSET would be very valuable. Further observations of the optical flare continua should bring a new insight into the role of accelerated particles, ionization and recombination processes, the flare heating, and its overall energetics.
Acknowledgements
The research leading to these results has received funding from the EC Program FP7/2007-2013 under the F-CHROMA grant agreement No. 606862, and funding from the People Program - Marie Currie Actions of FP7/2007-2013 under the REA grant agreement No. 295272 (Radiosun). Grant from the Czech Funding Agency (GACR) No. P209/12/1652 also partially supported this project.
References
- Allen (1976) Allen, C.W.: 1976, Astrophysical Quantities, 3rd edn. Athlone Press, London. ADS.
- Cheng et al. (2015) Cheng, X., Hao, Q., Ding, M.D., Liu, K., Chen, P.F., Fang, C., Liu, Y.D.: 2015, A two-ribbon white-light flare associated with a failed solar eruption observed by ONSET, SDO, and IRIS. ApJ 809, 46. DOI. ADS.
- Ding (2007) Ding, M.D.: 2007, The origin of solar white-light flares. In: Heinzel, P., Dorotovič, I., Rutten, R.J. (eds.) The Physics of Chromospheric Plasmas, ASP Conf. Ser. 368, 417. ADS.
- Donati-Falchi, Falciani, and Smaldone (1985) Donati-Falchi, A., Falciani, R., Smaldone, L.A.: 1985, Analysis of the optical spectra of solar flares. IV - The ’blue’ continuum of white light flares. A&A 152, 165. ADS.
- Fletcher and Hudson (2007) Fletcher, L., Hudson, H.S.: 2007, Impulsive flare energy transport by large-scale Alfven waves and the electron acceleration problem. AGU Fall Meeting Abstracts, B1278. ADS.
- Fletcher et al. (2007) Fletcher, L., Hannah, I.G., Hudson, H.S., Metcalf, T.R.: 2007, Energy deposition in white light flares with TRACE and RHESSI. In: Heinzel, P., Dorotovič, I., Rutten, R.J. (eds.) The Physics of Chromospheric Plasmas, ASP Conf. Ser. 368, 423. ADS.
- Hao et al. (2012) Hao, Q., Guo, Y., Dai, Y., Ding, M.D., Li, Z., Zhang, X.Y., Fang, C.: 2012, Understanding the white-light flare on 2012 March 9: Evidence of a two-step magnetic reconnection. A&A 544, L17. DOI. ADS.
- Heinzel and Kleint (2014) Heinzel, P., Kleint, L.: 2014, Hydrogen Balmer continuum in solar flares detected by the Interface Region Imaging Spectrograph (IRIS). ApJ 794, L23. DOI. ADS.
- Hiei (1982) Hiei, E.: 1982, A continuous spectrum of a white-light flare. Sol. Phys. 80, 113. DOI. ADS.
- Jess et al. (2008) Jess, D.B., Mathioudakis, M., Crockett, P.J., Keenan, F.P.: 2008, Do all flares have white-light emission? ApJ 688, L119. DOI. ADS.
- Kerr and Fletcher (2014) Kerr, G.S., Fletcher, L.: 2014, Physical properties of white-light sources in the 2011 February 15 solar flare. ApJ 783, 98. DOI. ADS.
- Kleint et al. (2015) Kleint, L., Battaglia, M., Reardon, K., Sainz Dalda, A., Young, P.R., Krucker, S.: 2015, The fast filament eruption leading to the X-flare on 2014 March 29. ApJ 806, 9. DOI. ADS.
- Kotrč (2009) Kotrč, P.: 2009, The modernized Horizontal Spectrograph at the Ondřejov Observatory. Central European Astrophys. Bull. 33, 327. ADS.
- Kowalski et al. (2013) Kowalski, A.F., Hawley, S.L., Wisniewski, J.P., Osten, R.A., Hilton, E.J., Holtzman, J.A., Schmidt, S.J., Davenport, J.R.A.: 2013, Time-resolved properties and global trends in dMe flares from simultaneous photometry and spectra. Astrophys. J. Suppl. 207, 15. DOI. ADS.
- Kowalski et al. (2015) Kowalski, A.F., Hawley, S.L., Carlsson, M., Allred, J.C., Uitenbroek, H., Osten, R.A., Holman, G.: 2015, New insights into white-light flare emission from radiative-hydrodynamic modeling of a chromospheric condensation. Sol. Phys.. DOI. ADS.
- Lin et al. (2002) Lin, R.P., Dennis, B.R., Hurford, G.J., Smith, D.M., Zehnder, A., Harvey, P.R., Curtis, D.W., Pankow, D., Turin, P., Bester, M., Csillaghy, A., Lewis, M., Madden, N., van Beek, H.F., Appleby, M., Raudorf, T., McTiernan, J., Ramaty, R., Schmahl, E., Schwartz, R., Krucker, S., Abiad, R., Quinn, T., Berg, P., Hashii, M., Sterling, R., Jackson, R., Pratt, R., Campbell, R.D., Malone, D., Landis, D., Barrington-Leigh, C.P., Slassi-Sennou, S., Cork, C., Clark, D., Amato, D., Orwig, L., Boyle, R., Banks, I.S., Shirey, K., Tolbert, A.K., Zarro, D., Snow, F., Thomsen, K., Henneck, R., McHedlishvili, A., Ming, P., Fivian, M., Jordan, J., Wanner, R., Crubb, J., Preble, J., Matranga, M., Benz, A., Hudson, H., Canfield, R.C., Holman, G.D., Crannell, C., Kosugi, T., Emslie, A.G., Vilmer, N., Brown, J.C., Johns-Krull, C., Aschwanden, M., Metcalf, T., Conway, A.: 2002, The Reuven Ramaty High-Energy Solar Spectroscopic Imager (RHESSI). Sol. Phys. 210, 3. DOI. ADS.
- Milligan et al. (2014) Milligan, R.O., Kerr, G.S., Dennis, B.R., Hudson, H.S., Fletcher, L., Allred, J.C., Chamberlin, P.C., Ireland, J., Mathioudakis, M., Keenan, F.P.: 2014, The radiated energy budget of chromospheric plasma in a major solar flare deduced from multi-wavelength observations. ApJ 793, 70. DOI. ADS.
- Neidig (1989) Neidig, D.F.: 1989, The importance of solar white-light flares. Sol. Phys. 121, 261. DOI. ADS.
- Neidig and Cliver (1983) Neidig, D.F., Cliver, E.W.: 1983, A catalog of solar white-light flares, including their statistical properties and associated emissions, 1859 - 1982. AFGL-TR-83-257, Air Force Geophysics Laboratory, Hanscom AFB, Massachusetts. ADS.
- Ricchiazzi and Canfield (1983) Ricchiazzi, P.J., Canfield, R.C.: 1983, A static model of chromospheric heating in solar flares. ApJ 272, 739. DOI. ADS.
- Švestka (1966) Švestka, Z.: 1966, Optical observations of solar flares. Space Sci. Rev. 5, 388. DOI. ADS.
- Watanabe et al. (2013) Watanabe, K., Shimizu, T., Masuda, S., Ichimoto, K., Ohno, M.: 2013, Emission height and temperature distribution of white-light emission observed by Hinode/SOT from the 2012 January 27 X-class solar flare. ApJ 776, 123. DOI. ADS.
- Zirin and Neidig (1981) Zirin, H., Neidig, D.F.: 1981, Continuum emission in the 1980 July 1 solar flare. ApJ 248, L45. DOI. ADS.