Comment on “Dynamics distortions and polaronic effects in the paramagnetic state of ”[J. Appl. Phys. 2014, 115, 223905]
Recently, the authors of ref. [1], reported dynamics distortion and polaronic effects in the paramagnetic state of manganites. In this comment we want to complete the phase diagram(Fig3[1]) and point out of occurring spin-glass state in this manganite which is not intended for x=0.15 doping.
The authors of ref. [1] reported a decrease of antiferromagnetism at higher Al doping (x>0.15) at low temperatures. They proposed transition to a spin glass (SG) state due to higher spin disorder. Also they claimed ferromagnetic metallic behavior at x=0.15 doping, while this sample shows a very weak metal-insulator transition in Fig2a [1], and at lower temperatures, is completely insulator. Thus, we examined if it is in spin glass (SG) state due to its insulation behavior at low temperatures. Also this state at lower temperature in x=0.15 sample, has not been considered in to the phase diagram (Fig3[1]).
In other words, their phase diagram is not complete. Therefore we have investigated the subject of SG in this comment. Bulk sample of x=0.15 in our compound, were synthesized using sol-gel method.
One of the features of SG system is the dependence of its ac susceptibility on the applied field and frequency. In this sample, this behavior results in a sharp drop in the real part of the ac susceptibility at low temperatures, and the appearance of a peak in its imaginary part. The frequency-independent peaks named as Hopkinson peaks are typical feature in many ferromagnetic materials, but the second peak positions, shift to higher temperatures with increasing frequency. So, to verify SG state presence, we have measured the imaginary ac susceptibility of the (x=0.15) sample on the constant field and different frequencies.
Figure 1 shows the temperature dependence of the imaginary part (Out of phase) of the ac susceptibility at different frequencies. The temperature dependence of ac susceptibility of this sample measured in an applied field of 10 Oe, after cooling in the absence of zero field (ZFC). As can be seen from Figure 1, there is SG behavior below a certain temperature (see inset in Fig.1).
The first peak temperature that is frequency independent, represents the Curie temperature, while the second peak temperature, represent the freezing temperature , that shifts towards higher temperatures with increasing frequency. This change by frequency is characteristic of SG phase. For further investigation of the SG nature at x=0.15 doping, we have checked the ’s dependence on frequency by conventional critical slowing down model which is as follows[2]:

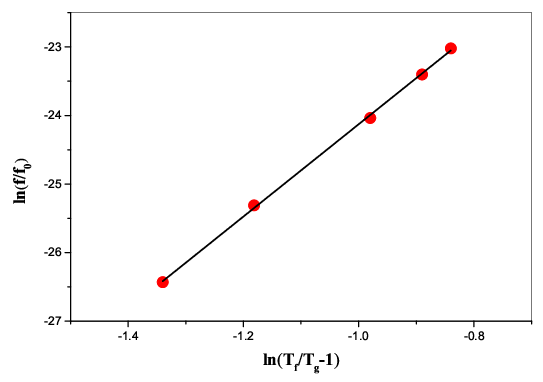
where, is the dc value of for , is a constant in order of and is dynamic critical exponent. The Fig. 2 shows the best fit of this model. The estimated values are within the realm of three dimensional SGs that dose not coincide with ref. [1]
References
- [1] M. A. B. Narreto, H. S. Alagoz, J. Jeon, K. H. Chow, and J. Jung, Journal of Applied Physics 115, 223905 (2014).
- [2] J. Liu, W. Xie, K. A. G. Jr, G. J. Miller, and V. K. Pecharsky, Journal of Physics: Condensed Matter 26, 416003 (2014).