On the covering fraction variability in an EUV mini-BAL outflow from PG 1206+459
Abstract
We report on the first detection of extreme-ultraviolet (EUV) absorption variability in the Ne viii 770,780 mini-broad absorption line (mini-BAL) in the spectrum of the quasar (QSO) PG 1206+459. The observed equivalent width (EW) of the Ne viii doublet shows a 4 variation over a timescale of 2.8 months in the QSO’s rest-frame. Both members of the Ne viii doublet exhibit non-black saturation, indicating partial coverage of the continuum source. An increase in the Ne viii covering fraction from to is observed over the same period. The Ne viii profiles are too highly saturated to be susceptible to changes in the ionization state of the absorbing gas. In fact, we do not observe any significant variation in the EW andor column density after correcting the spectra for partial coverage. We, thus, propose transverse motions of the absorbing gas as the cause of the observed variability. Using a simple model of a transiting cloud we estimate a transverse speed of 1800 km s-1. For Keplerian motion, this corresponds to a distance between the absorber and the central engine of 1.3 pc, which places the absorber just outside the broad-line region. We further estimate a density of 5 cm-3 and a kinetic luminosity of – erg s-1. Such large kinetic powers suggest that outflows detected via EUV lines are potentially major contributors to AGN feedback.
Keywords:
galaxies: active – quasar: absorption line – quasar: individual: PG 1206+4591 Introduction
Broad absorption line (BAL; line spread, few1000 km s-1) and mini-BAL (few100 km s-1) systems detected via UV absorption troughs blue-shifted with respect to the QSO’s emission redshift are thought to originate in an equatorial wind that is launched from the accretion disk near the central supermassive black hole (Murray et al., 1995; Arav et al., 1995; Proga et al., 2000, SMBH; e.g.,). The mass, momentum, and energy carried by such winds are increasingly invoked as the primary feedback mechanisms to explain the evolution of SMBH (Silk & Rees, 1998; King, 2003; King, 2005) and their host-galaxies (Begelman & Nath, 2005; Di Matteo et al., 2005). For example, it has been shown that an outflow with a kinetic power of a few per cent of the Eddington luminosity provides sufficient feedback to quench star formation, thus coupling the evolution of the host-galaxy and the growth of the central SMBH (Di Matteo et al., 2005). QSO outflows can also be responsible for metal enrichment in the interstellar medium (ISM), in the circumgalactic medium (CGM), and even in the intergalactic medium (Wiersma et al., 2011, IGM;). Therefore, the study of QSO outflows via BAL and mini-BAL systems is immensely important. In particular, the incidence rate, outflow velocity, variability timescale, and covering fraction () of the absorption troughs provide essential clues about the location, geometry, and energetics of the flow.
It is now well known that BAL systems show variability in absorption profiles over a time period of 1–10 yrs in the QSO rest-frame (e.g., Barlow, 1994; Srianand & Petitjean, 2001; Lundgren et al., 2007; Gibson et al., 2008; Capellupo et al., 2011; Filiz Ak et al., 2013; Vivek et al., 2012; Vivek et al., 2014, and references therein). Filiz Ak et al. (2013) found a BAL fraction of 50–60 per cent that exhibit variability over time-scales of 1–4 yrs in the QSO’s rest-frame. Additionally, BAL variability is found to be larger for longer timescales (Gibson et al., 2008; Capellupo et al., 2011; Vivek et al., 2014, e.g.,). For example, Capellupo et al. (2011) have found variability in 40 per cent of BAL absorbers on timescales of yr with that fraction increasing to 65 per cent on timescales of 4–8 yr in the QSO rest-frame. BAL variability is generally explained by: (a) change in due to motions of the absorber across the line of sight andor (b) change in the ionization state of the gas. In either case, it is possible to determine the dynamics and location of the absorber with respect to the central engine under some assumptions. Note that the above explanations hold for mini-BAL variability as well.
While BAL variability is well studied via several ongoing monitoring campaigns by different groups with a fairly large number of objects, very little is known for mini-BALs. In fact, variability in mini-BAL absorption is studied only in a handful of cases (Hamann et al., 1997; Narayanan et al., 2004; Misawa et al., 2007; Rodríguez Hidalgo et al., 2011; Misawa et al., 2014, i.e.,). Interestingly, Misawa et al. (2007) have demonstrated that the aforementioned causes for line variability cannot reproduce the rapid, simultaneous variation in multiple troughs of the mini-BAL system detected towards HS 1603+3820. Instead, they proposed that a clumpy “screen” of gas with variable optical depth and covering fraction, located between the continuum source and the absorbing gas, mimics the variation in the ionizing continuum. The variability study of a sample of seven mini-BALs was recently presented by Misawa et al. (2014). Assuming that the observed variations result from changes in the ionization state of the mini-BAL gas, they have inferred lower limits to the gas density of cm-3, corresponding to upper limits on the distance of the absorbers from the central engine of few kpc. Note that unlike BAL systems, absorption line parameters can be more robustly determined for mini-BAL systems because (a) the QSO continuum is easily identifiable even in the presence of mini-BALs, (b) doublets are not self-blended due to relatively narrow line profiles, and (c) the kinematic structure is often discernible due to lack of heavy line-saturation (Muzahid et al., 2012, see e.g.,). Mini-BAL systems are thus excellent tools for measuring outflow properties, e.g., density, metallicity, outflow mass, mass-flow rate, and kinetic luminosity that are essential for quantifying the so called “AGN feedback” (Arav et al., 2013).
Recently, in an archival Hubble Space Telescope () Cosmic Origins Spectrograph (COS) study, we have reported a new population of associated absorbers detected via absorption from EUV ions (e.g., Ne viii, Na ix, and Mg x) in the spectra of intermediate- QSOs (Muzahid et al., 2013, hereafter M13). We have found that a significant fraction (40 per cent) of the intermediate- QSOs exhibit outflows observable via EUV lines. These absorbers are very highly ionized with ionization parameters (i.e. 0.51.0) consistent with their being intermediate to X-ray “warm absorbers” (Halpern, 1984) and BALs. The velocity spreads (100–800 km s-1) of the Ne viii absorption lines suggest that they are mini-BALs. Here we present a fortuitous case from the sample presented in M13 in which the QSO (PG 1206+459) was observed at three different epochs. PG 1206+459 is an UV-bright QSO with a -band magnitude of 15.4 and has an emission redshift of 1.163. The multi-epoch spectroscopic observations of the QSO allowed us to study variability of the O iv, N iv, and Ne viii absorption. We found a 4 variation in the Ne viii equivalent width. This is the first case of EUV mini-BAL variability reported so far. This article is organized as follows: In Section 2 we present observations and data reduction of the QSO PG 1206+459. Absorption line analysis and the QSO’s properties are presented in Section 3. In Section 4 we discuss the implications of our findings. In Section 5 we briefly summarized our main results. Throughout this article we adopt a flat CDM cosmology with , , and km s-1 Mpc-1. Unless specified otherwise, the EWs are given in the observed frame whereas the timescales are in the QSO’s rest-frame.
| Gratinga | Tiltc | Date of | MJDe | Epoch | |||
|---|---|---|---|---|---|---|---|
| (Å) | (sec) | Observation | |||||
| G160M | 1600 | 1 | 2361.2 | 2009-12-29 | 55194.5 | 1 | |
| G160M | 1600 | 2 | 3137.2 | 2009-12-29 | 55194.5 | 1 | |
| G160M | 1623 | 3 | 3137.2 | 2009-12-29 | 55194.5 | 1 | |
| G160M | 1623 | 4 | 3137.2 | 2009-12-29 | 55194.5 | 1 | 11 |
| G160M | 1600 | 1 | 3137.2 | 2010-01-05 | 55201.5 | 2 | |
| G160M | 1600 | 2 | 3137.2 | 2010-01-05 | 55201.5 | 2 | |
| G160M | 1600 | 3 | 3137.2 | 2010-01-05 | 55201.5 | 2 | |
| G160M1 | 1600 | 4 | 3137.0 | 2010-01-05 | 55201.5 | 2 | 10 |
| G160M | 1623 | 1 | 2361.2 | 2010-06-14 | 55361.5 | 3 | |
| G160M | 1623 | 2 | 3137.1 | 2010-06-14 | 55361.5 | 3 | |
| G160M | 1623 | 3 | 3137.2 | 2010-06-14 | 55361.5 | 3 | |
| G160M | 1623 | 4 | 3137.2 | 2010-06-14 | 55361.5 | 3 | 12 |
| G130M | 1309 | 1 | 2406.2 | 2010-01-04 | 55200.5 | 2 | |
| G130M | 1309 | 3 | 3137.2 | 2010-01-04 | 55200.5 | 2 | |
| G130M | 1309 | 4 | 3137.2 | 2010-01-04 | 55200.5 | 2 | |
| G130M | 1327 | 1 | 3137.2 | 2010-01-04 | 55200.5 | 2 | |
| G130M | 1327 | 3 | 3137.2 | 2010-01-04 | 55200.5 | 2 | |
| G130M | 1327 | 4 | 2406.2 | 2010-01-05 | 55201.5 | 2 | 27 |
Notes– aGrating used.
bCentral wavelength.
cFixed-pattern offset position.
dExposure time in second.
eModified Julian date corresponding to the observation date.
f per resolution element of the coadded data at 1575 Å for G160M grating and at 1230 Å for G130M grating.
1This exposure () was bad and not used for co-addition.
2 Observations and Data Reduction
Far-UV (FUV) spectra of the UV-bright QSO PG 1206+459 ( = 1.163) were obtained using COS Cycle-17 observations, under program ID: GO-11741 (PI: Todd Tripp). These observations consist of G130M and G160M grating integrations at a medium spectral resolution of 20,000 (FWHM 18 km s-1). The data were retrieved from the archive and reduced using the STScI CALCOS v2.21 pipeline software. The reduced data were flux calibrated. To increase the spectral signal-to-noise ratio (), spectra from individual exposures were aligned and coadded using the IDL code “coadd_x1d” developed by Danforth et al. (2010). The properties of COS and its in-flight operations are discussed by Osterman et al. (2011) and Green et al. (2012). The coadded spectra are significantly oversampled, with six raw pixels per resolution element. We thus binned the data by six pixels. This improves the spectral per pixel by a factor of . All our measurements and analyses were performed on the binned data. The binning does not affect our EW andor measurements since the absorption lines of interest are much broader than the spectral resolution. Continuum normalization was done by fitting the line-free regions with smooth low-order polynomials. Since there is no Ly forest crowding at low- and the absorption lines of interest do not fall on top of any emission lines, the continua were very well defined in most part. COS wavelength calibration is known to have uncertainties at the level of 10–15 km s-1 (Savage et al., 2011; Meiring et al., 2013). Using molecular hydrogen absorption lines, Muzahid et al. (2015b) have noted that while in majority of the cases wavelengths are accurate within 5 km s-1, large offsets (10 km s-1) are often noticeable at the edges of the COS spectra. We noticed that the wavelength calibration uncertainty is usually 5 km s-1 for PG 1206+459. However, the uncertainty increases to 10 km s-1 at the edge of the spectra as also noted by Muzahid et al. (2015b).
Besides COS, we have used the Space Telescope Imaging Spectrograph (STIS) spectrum of PG 1206+459. The STIS spectrum was obtained using the E230M grating under program ID: 8672 (PI: Chris Churchill). We refer the reader to Ding et al. (2003) for the full details on the STIS observations. The spectrum is only used for calculating rest-frame 1350 Å flux.
In Table 1 we summarize the details of the observations. It is clear from the table that the G160M observations were taken in three different epochs. Epoch-1 and Epoch-2 are separated by 7 days, corresponding to 3.2 days in the QSO’s rest-frame. Epoch-1 and Epoch-3 are separated by 6 months (2.8 months in the QSO’s rest-frame). We note that the G160M spectrum covers only the N iv 765, O iv 787, and Ne viii 770,780 transitions from the mini-BAL outflow we studied here. Unfortunately, other important high-ionization species (e.g., Na ix 681,694, Mg x 609,624) fall in the wavelength range covered by the G130M grating and are observed only once.
3 Analysis
3.1 Properties of the absorber
The mini-BAL outflow from QSO PG 1206+459 ( 1.163) was first reported in M13 as a part of our COS survey of intrinsic absorbers detected via Ne viii 770,780 doublet transitions. The absorption redshift of 1.02854 corresponds to an outflow velocity of 19,200 km s-1. Both members of the Ne viii doublet are detected with . The Ne viii absorption is spread over 360 km s-1 with a total column density of cm-2. A very weak Ly line is detected with 14 in the STIS spectrum. Interestingly, no singly or doubly ionized species are detected from this absorber. Besides Ne viii, we have reported the presence of several other high-(Ar viii, Na ix, Mg x) and low-(O iv, N iv, O v, N v) ionization species (see Fig. 7 of M13). But only N iv 765, Ne viii 770,780, and O iv 787 lines have multi-epoch coverage.
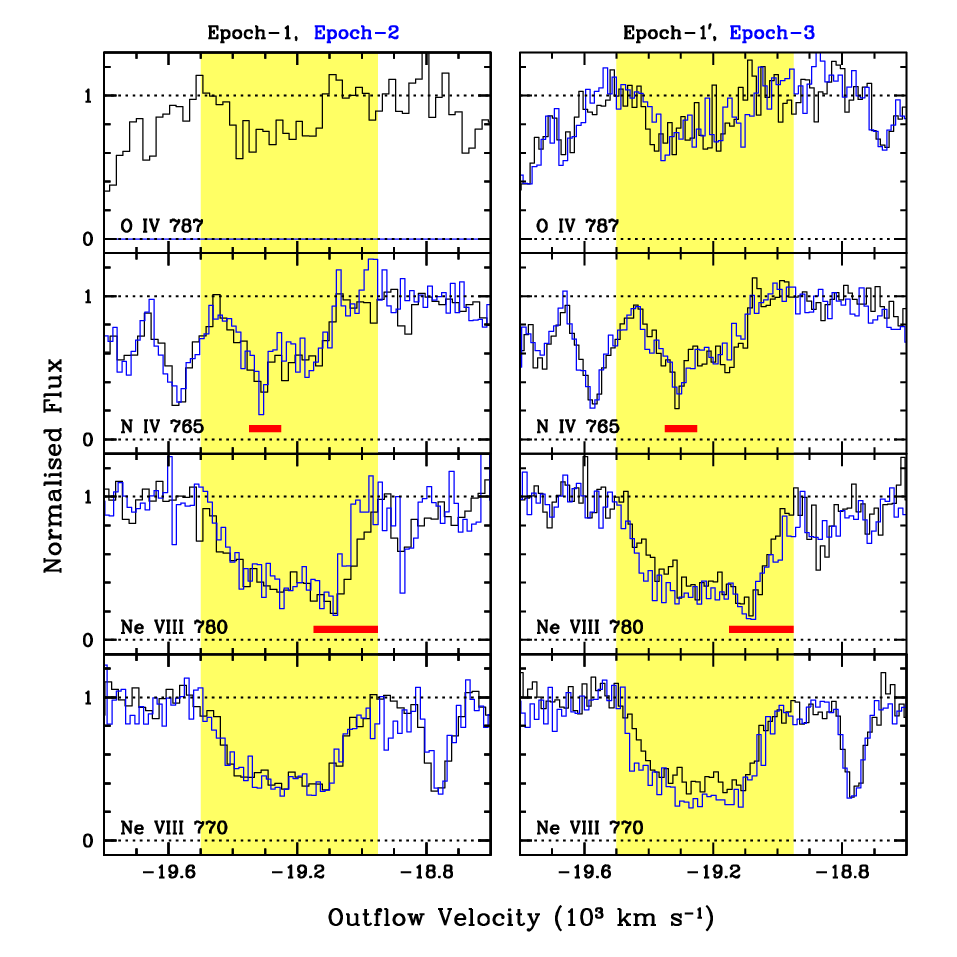
In Fig. 1 we show the absorption profiles of N iv 765, O iv 787, and Ne viii 770,780 transitions for the three different epochs. No significant variation in any of these absorption troughs between Epoch-1 and Epoch-2 (separated by 3.2 days in the QSO’s rest-frame) is apparent from the figure. To quantify the degree of variability in an absorption, we measure EWs at different epochs and define absorption variability significance as follows:
| (1) |
where, and are the equivalent width and its error, respectively, as measured in j-th epoch. Note that a positive indicates an increase in EW at later epoch. We have estimated that the error in the observed EW due to the continuum placement uncertainty is on the order of . We, thus, introduce the factor in the denominator in Eq. 1 to take care of the continuum placement uncertainty (Misawa et al., 2014, see also).
Next, we choose a set of 39 strong absorption lines that are detected with in all three epochs in the wavelength ranges 1440--1587 Å and 1623--1775 Å11 1 We do not use lines within 20 Å from both blue- and red-end of the spectra due to wavelength calibration uncertainty.. Details of these lines are given in Appendix A. Note that all but three of these lines, i.e., NIV , Ne viii 770 and 780 lines from the mini-BAL22 2 O iv 787 is not considered here since it is not covered in Epoch-2 data., are intervening and should not show any considerable variation with time. For all these absorption lines we have calculated . The top panel of Fig. 2 shows the distribution of as measured between Epoch-1 and Epoch-2 (). It is apparent from the figure that none of the absorption lines, including the three from the mini-BAL system, shows variability with a significance of 2. A Gaussian fit to the distribution gives a mean of and a standard deviation of . A 2 variation, thus, is not significant for the data we have. Since there is no considerable variation in any absorption we co-add the Epoch-1 and Epoch-2 data in order to increase the spectral SN. The resultant data, with marginally improved SN of 14 per resolution element, are shown as Epoch- in Fig. 1. The Epoch- spectrum has spectral coverage of 1150–1800 Å. For interested readers we have shown the Epoch- spectrum in Appendix B.

In the bottom panel of Fig. 2 we show the distribution as calculated between Epoch- and Epoch-3 (). Here also we find that none, but two of the absorption lines, shows variability with a significance of 2. A Gaussian fit to the distribution results in similar and values as we obtained for the distribution. The two absorption lines showing 4 variation are the Ne viii 770 and 780 of the mini-BAL outflow (see Appendix A). Clearly, the variations are statistically significant and cannot be attributed to some systematic uncertainties. The N iv line, however, does not show any considerable variability between Epoch- and Epoch-3, e.g., shows only a variation. Moreover, the O iv line shows only a 0.2 variation between Epoch-1 and Epoch-3.
In a situation when an absorber covers the background continuum emitting region only partially with a covering fraction of , then the observed and “true” optical depths () are related via:
| (2) |
Here is the observed normalized flux. Here we assume that the background source is partially covered by a homogeneous absorber with a constant . However, can be strongly dependent on velocity along the absorption trough (Arav et al., 2008, e.g.,). In the case of a doublet with rest-frame wavelengths of and , and oscillator strengths of and , the normalized fluxes of and at any velocity with respect to the line centroid are related by:
| (3) |
where, , which is close to 2 for the Ne viii doublet (Petitjean & Srianand, 1999; Srianand & Shankaranarayanan, 1999, see e.g.,). Using Eq. 3 we have calculated the Ne viii covering fraction as a function of outflow velocity as shown in Fig. 3 (Muzahid et al., 2012; Muzahid et al., 2013, see also). The median value obtained for the Epoch- data is , whereas it is for the Epoch-3 data. The error bars correspond to the standard deviations of values measured in each pixel. Note that the median values are determined from the core of the absorption, i.e., only using the pixels with highest optical depths marked by the horizontal bars. Nevertheless, it is evident from the figure that the Epoch-3 data show higher values as compared to the Epoch- data in almost every pixel over the entire velocity range.
Finally, in order to evaluate whether the Ne viii column density has increased with time, we perform EW measurements in the covering fraction corrected spectra (i.e. the spectra obtained by inverting the Eq. 2). For both the Epoch- and Epoch-3 data we measure EWobs(Ne viii 770) = Å. Thus, no significant change in Ne viii equivalent width is noticeable in the partial coverage corrected spectra. A change in without a significant change in EW is possible in the flat part of the curve-of-growth. However the fact that we do not see any change in the wings of the profile indicates no considerable change in over the course of 2.8 months in the QSO’s rest-frame.

3.2 Properties of the background QSO
The UV bright QSO PG 1206+459 has a -band magnitude of 15.4. The Catalina Real-Time Transient Survey (Drake et al., 2009, CRTS;) light-curve, shown in Fig. 4, indicates very little fluctuation in the -band magnitude and hence in the continuum flux. In addition, no significant variation in the UV continuum is seen in the COS data. We found a maximum of only 30 per cent variation in the UV flux between Epoch- and Epoch-3. Using the Mg ii emission line width, Chand et al. (2010) have estimated a black hole mass of for this QSO which corresponds to a Schwarzschild radius of cm. Following Hall et al. (2011), we estimate the diameter of the disk within which 90 per cent of the 2700 Å continuum is emitted, 50 cm33 3 We note that the and the rest-frame 3000 Å luminosity of the present source are, respectively, 3 times lower and 5 times higher than the one studied by Hall et al. (2011). The facts ensure that the disk temperatures, and hence the size of the continuum emitting regions, are consistent with each other at 15 per cent level.. From the rest-frame 1350 Å flux (i.e., 5 erg cm-2 s-1 ), measured from the STIS spectrum, we obtain the broad line region (BLR) size of 0.7–0.9 pc by adopting the (1350Å) relation given in Kilerci Eser et al. (2015).
4 Discussion
We report on the variability in Ne viii absorption originating from a mini-BAL outflow from the QSO PG 1206+459 ( = 1.163). The absorber is detected at = 1.02854 corresponding to an outflow velocity of 19,200 km s-1. The mini-BAL system, with Ne viii absorption kinematically spread over 360 km s-1 and with a total column density of , was first reported in M13 (see their Table 2). Here we report a 4 variation in the observed EWs of the Ne viii and absorption lines over a timescale of 2.8 months in the QSO’s rest-frame. Such variations cannot be attributed to systematic uncertainties since the neighboring unrelated, intervening absorption do not vary with such a high significance. This is the first reported case of an EUV mini-BAL variability. However, we did not observe any considerable variation in the Ne viii absorption troughs on a timescale of 3.2 days in the QSO’s rest-frame. Additionally, two other low-ionization species (O iv and N iv) with multi-epoch observations do not exhibit any appreciable variation at any time, e.g., show variations. Note that the mini-BAL absorbers in the sample of Misawa et al. (2014) show variability over a similar timescale. Thus a 4 absorption variability in Ne viii over 2.8 months in the QSO’s rest-frame is somewhat extreme. However, we point out that the mini-BAL absorbers in their sample are detected via Si iv, C iv, and N v absorption lines which have ionization potentials similar to N iv and O iv. The lack of significant variability in N iv and O iv lines in the present system, therefore, is consistent with the observations of Misawa et al. (2014).
As mentioned in Section 1, the change in ionization state of the absorber and the change in due to absorber’s motions are the two most plausible reasons for absorption variability. Below we discuss the two scenarios in detail.
4.1 Variability due to change in ionization
Variation in the optical depth of an absorption line (i.e. variability) naturally occurs due to the change in ionization state of the absorbing gas. The change in ionization state of photoionized gas can be induced via a change in the ionizing continuum. In the “screening gas” scenario of Misawa et al. (2007), the change in optical depth of “screening gas” can also lead to absorption line variability. Nevertheless, variation in the continuum flux is thought to be the most probable reason for the variation in the optical depth of “screening gas”. Here we have found that the -band magnitude andor the UV continuum of the background QSO do not show any significant variation (Section 3.2). The weak variation (up to 30%) seen in the UV continuum will not change the Ne viii column density appreciably. This is because reaches at its peak around ionization parameter of 1 and shows a very little change over a wide range in around the peak, i.e., 0.5–1.5 (see Fig. 12 of M13 for example). Thus a maximum of 30% change in induced by the change in the UV continuum, assuming the shape of the ionizing spectrum is not changing, will not be discernible. Furthermore, the total column density of Ne viii as given in M13 (i.e. , after correcting for the partial coverage) indicates that the profiles are too heavily saturated to be susceptible to the change in the ionization state. Finally, the lack of any considerable variation in the “true” Ne viii EWs, as measured from the partial coverage corrected spectra, and the lack of any change in the wings of the Ne viii profile (Section 3.1) indicates that it is highly unlikely that the observed line variation is due to the change in ionization state of the absorbing gas.

4.2 Variability due to absorber’s motion
Motions of the absorbing gas cloud, transverse to the line of sight, could result in a change in and hence in the “apparent” optical depth of absorption. In Section 3.1 we have shown that the of the gas phase giving rise to the Ne viii absorption shows an increase from to over a timescale of 2.8 months in the QSO’s rest-frame. Such an increase in value can occur primarily because of the two reasons: (i) transverse expansion of the absorbing gas cloud, andor (ii) absorber’s bulk motions across the line of sight.
4.2.1 Expansion across the line of sight
If the entire absorber is already within our cylinder of sight then any transverse motion will lead to a decrease in in contrast to what we observe here. Nevertheless, a gas cloud, without a significant transverse motion, can expand in size and consequently increase the covering fraction. In this scenario, in Epoch-1, the transverse size of the absorbing gas cloud is estimated to be cm. An increase in radius from to , due to expansion, will increase the covering fraction from to via the relation: . The fact that the Ne viii covering fraction increases from 0.59 to 0.72 in the rest-frame 2.8 months allows us to estimate an expansion rate of 720 km s-1. If this were adiabatic expansion at the speed of sound then it would imply a temperature of K. But such a high temperature is incompatible with the ionization states of metals that we observe in the absorber.
More than 14 absorption troughs from eight different low- (e.g. O iv, N iv, N v) and high-(e.g. Ne viii, Na ix, Mg x) ions are detected from this system (see Fig. 7 of M13). Interestingly, in M13 we have shown that these ions exhibit ionization potential (IP) dependent covering fractions with higher ions covering more of the continuum emitting region. For example, the N iv and O iv have values of 0.4 and 0.2, respectively, as opposed to 0.6 we measured for the Ne viii. Such observations clearly suggest multiphase structure of the absorber with different ions having different projected area across the line of sight. Different phases of a multiphase photoionized absorber are often found to have very different densities and temperatures causing pressure gradients in the absorbing gas (Muzahid et al., 2012, e.g.). Such pressure gradients could, eventually, lead to an expansion.
It is evident from Fig. 12 of M13 that peaks at 1.0, whereas, and peaks at . Note that the photoionization equilibrium temperatures for the high- and low-ionization phases are and K, respectively. At these temperatures, the gas-pressures for both the phases are at least 2 orders of magnitude higher than the corresponding radiation pressures, for the whole range of densities. Therefore, the total pressure, dominated by the gas-pressure, of the low-ionization phase is a factor of 10 higher than that of the high-ionization phase. As a consequence, it is natural for the low-ionization gas phase to exhibit a more rapid expansion than the Ne viii bearing gas. However, we do not find any appreciable variability in the N iv andor O iv absorption. Hence, the expansion scenario, although highly plausible in case of a multiphase absorber, cannot explain our observations. In view of the above arguments, we disfavor the expansion interpretation for the change in in this system.

4.2.2 Bulk motions across the line of sight
In a scenario in which an absorber is entering to our cylinder of sight, due to a rotational motion around the central SMBH, can explain the phenomenon of increase in with time. In Fig. 5 we present a simple model in which a cloud with a radius of is transiting a continuum emitting disk with a radius of . Since the absorber covers 60–70% of the background source, we reasonably assume . The common area between the cloud and the disk, under such an approximation, can be expressed as
| (4) |
leading to a covering fraction of
| (5) |
Here, is the center-to-center projected separation between the disk and the absorber, and is a dimensionless parameter defined as . Note that can vary from 0 to and can have values between 0 and 2. The right panel of Fig. 5 shows how changes with . The observed increase in value from 0.59 to 0.72, as shown by the horizontal dotted lines, corresponds to 0.2 leading to cm. The transverse speed of the absorber is therefore, 1800 km s-1. Note that the transverse speed is 10 times smaller than the radial outflow velocity we measured from the spectra (i.e. 19,200 km s-1). If we assume that the can be matched to a Keplerian velocity (McGraw et al., 2015, see e.g.,), then the derived distance between the absorber and the central engine is cm 1.3 pc. This suggest that the outflowing gas is located just outside the BLR region. With the observed radial velocity the cloud will move only pc in the radial direction over the course of the 2.8 months. Clearly, the is too small, as compared to the , to cause any significant change in the photon flux due to the change in the distance between the QSO and the absorber.
A detailed photoionization model for this absorber was presented in M13. Here we recall the important model parameters: i.e., 1, metallicity of 1.0, and total hydrogen column density of . Inserting pc in Eq. 4 of M1344 4 , where , is the monochromatic luminosity of the QSO at the Lyman continuum in units of erg s-1 Hz-1., we calculate the density of the Ne viii bearing gas to be cm-3. Given the density, the line of sight thickness of the cloud turns out to be cm. On the other hand, since the absorber covers at least 60 per cent of the continuum emitting region, the minimum transverse size of the absorber is cm. Evidently, , which is suggestive of a “sheet-like” geometry.
In a standard thin-shell model, the kinetic luminosity of an outflow can be expressed as , where, is the proton mass, accounts for the mass of helium, and and are, respectively, the global and local covering fractions (Muzahid et al., 2015a, see Appendix C of). In M13 we have shown that 40 per cent of the intermediate redshift QSOs exhibit highly ionized outflows detected via the Ne viii absorption. Therefore, can be taken as 0.4 for the general population. However, we note that the outflow velocity (19,200 km s-1) we measure for this system is very rare. Only one out of 20 QSOs shows such a high outflow velocity. We, thus, conservatively use for our calculations. The is related to the clumpiness of the absorbing material. For simplicity, is taken to be unity for the highly ionized diffuse gas. Using the distance 1.3 pc, derived from our simple model, we estimate a kinetic luminosity of erg s-1. The value increases to erg s-1 if we assume . Note that the of erg s-1 is among the highest kinetic luminosities measured till date (Dunn et al., 2010, see Table 10 of). Such large kinetic luminosities suggest that the outflows detected via the Ne viii absorption are potentially major contributors to AGN feedback.
It is now important to address whether we could explain the lack of variability in the low-ionization lines, i.e. O iv and N iv, with our simple model. Naively one would expect that the low-ionization gas phase would trace a high density, compact region. In M13, using O iv and transitions, we determined the O iv covering fraction to be 0.2. Therefore, the transverse size of the low-ionization gas phase, giving rise to O iv (and N iv) absorption, is only a factor of 2 smaller than the Ne viii bearing gas. The fact that all the high- and low-ionization lines coincide in velocity, possibly, indicates that the gas phases are co-spatial with the low-ionization lines stemming from the core of the absorber with a lower value. While such a scenario is reasonable, the difference in transverse sizes is not quite significant.
We recall that according to Eq. 1, the change in EW, and hence in , depends on the EW itself. From Fig. 1 it is evident that the both O iv (EW Å) and N iv (EW Å) lines are much weaker than the Ne viii (EW Å). Thus, one possibility here is that variations in those weak lines, O iv in particular, are below our detection limit. In order to check that, we estimated the value for O iv in the partial coverage corrected spectra. However, we did not find any significant variation. Higher SN multi-epoch observations are essential for reaching a firm conclusion on the degree of variability of these ions. As noted earlier, the lack of appreciable variation in the low-ionization species over a timescale of 2.8 months, however, is consistent with the recent observations by Misawa et al. (2014).
5 Summary
We have studied the variability of the Ne viii 770, 780 doublet originating from a mini-BAL outflow with an ejection velocity of 19,200 km s-1 from the UV bright QSO PG 1206+459 ( 1.163). This is the first case of mini-BAL variability detected in EUV transitions. The Ne viii doublet shows variability with a 4 significance over a timescale of 2.8 months in the QSO’s rest-frame. However, no significant variation is observed over a shorter timescale of 3.2 days. Additionally, we did not observe any appreciable variation in lower ionization O iv and N iv lines.
We have explored three different possibilities for the observed variability: (a) change in the ionization conditions, (b) expansion of the absorber, and (c) bulk motion of the absorbing gas across the line of sight. From the lack of variability in the partial coverage corrected spectra and estimated large column density of Ne viii ( cm-2) we rule out the possibility of a change in ionization conditions. The expansion scenario leads to an unreasonably high gas temperature that is inconsistent with the ionization state of the detected metal lines. Besides, we note that the low-ionization lines should exhibit a more rapid expansion than the Ne viii in contrast to what we observed here. We favored a scenario in which the absorbing gas is entering into the cylinder of sight and hence showing an increase in covering fraction. Using a simple model of a transiting cloud, with a size on the order of the continuum emitting region, we derived the transverse speed, distance from the central engine, density, and kinetic luminosity of the outflow. In order to explain the lack of variability in the low-ionization lines, we preferred a multiphase structure of the absorbing gas in which the low-ionization species stem from the core of the absorber with lower values and presumably already in the cylinder of sight. Nonetheless, the transverse size of the low-ionization gas phase is only a factor of 2 smaller than that of the high-ionization phase, posing an apparent tension to our favored scenario. High SN, multi-epoch observations are needed for a firm conclusion on the variability of the weak, low-ionization lines.
Eight different ions with a wide range in IPs (i.e. 40–400 eV) are detected in this absorber (see Fig. 7 & 8 of M13). A study of both short-term and long-term variability with multi-epoch observations, in future, for more than 10 absorption troughs would provide further insights on the dynamics and the structure of this intriguing mini-BAL outflow.
Acknowledgements: We would like to thank the anonymous referee for constructive suggestions which improved the manuscript. SM thankfully acknowledges IUCAA (India) for providing hospitality where a part of the work was done. SM also thanks Chris Culliton for useful discussion and carefully reading an earlier version of the manuscript. JC and ME acknowledge support from grant AST–1312686 from the National Science Foundation.
Appendix A Summary of equivalent widths and measurements
| (Å) | (Å) | (Å) | (Å) | (Å) | (Å) | ||
|---|---|---|---|---|---|---|---|
| (1) | (2) | (3) | (4) | (5) | (6) | (7) | (8) |
| 1460.7441 | 1462.1398 | 0.230.02 | 0.210.02 | 0.6 | 0.200.02 | 0.160.02 | 1.3 |
| 1463.0298 | 1464.7288 | 0.440.02 | 0.430.02 | 0.5 | 0.450.02 | 0.420.02 | 0.9 |
| 1464.6884 | 1467.8639 | 1.270.03 | 1.260.03 | 0.1 | 1.240.02 | 1.240.03 | 0.0 |
| 1468.5472 | 1470.6407 | 0.850.03 | 0.790.03 | 1.7 | 0.820.02 | 0.770.02 | 1.7 |
| 1471.0566 | 1472.1326 | 0.620.01 | 0.590.02 | 1.4 | 0.640.01 | 0.620.01 | 1.2 |
| 1474.4214 | 1475.6957 | 0.910.01 | 0.890.02 | 1.1 | 0.910.01 | 0.910.01 | 0.5 |
| 1475.6957 | 1477.9813 | 1.170.02 | 1.170.03 | 0.0 | 1.180.02 | 1.190.02 | 0.4 |
| 1479.3688 | 1480.5581 | 0.130.02 | 0.190.02 | 1.8 | 0.130.02 | 0.150.02 | 0.7 |
| 1481.4803 | 1483.7620 | 0.430.03 | 0.440.03 | 0.1 | 0.450.02 | 0.440.03 | 0.3 |
| 1484.2960 | 1486.0920 | 0.810.02 | 0.810.02 | 0.0 | 0.820.02 | 0.850.02 | 1.2 |
| 1501.3752 | 1502.8315 | 0.290.03 | 0.250.03 | 1.1 | 0.290.02 | 0.260.02 | 0.8 |
| 1503.6245 | 1504.5574 | 0.220.02 | 0.230.02 | 0.4 | 0.240.01 | 0.200.02 | 1.7 |
| 1508.1309 | 1511.7717 | 0.370.04 | 0.390.05 | 0.3 | 0.400.03 | 0.380.04 | 0.3 |
| 1513.8568 | 1515.2911 | 0.260.03 | 0.200.03 | 1.5 | 0.230.02 | 0.230.02 | 0.2 |
| 1515.5824 | 1517.8801 | 1.470.02 | 1.440.03 | 1.0 | 1.460.02 | 1.490.02 | 1.1 |
| 1517.8801 | 1519.3525 | 0.990.02 | 0.990.02 | 0.2 | 1.000.01 | 1.010.02 | 0.3 |
| 1522.9287 | 1524.4659 | 0.420.03 | 0.440.03 | 0.4 | 0.420.02 | 0.380.03 | 1.2 |
| 1525.8251 | 1527.4271 | 0.640.03 | 0.620.03 | 0.6 | 0.620.02 | 0.630.03 | 0.4 |
| 1530.4724 | 1531.2815 | 0.210.02 | 0.150.03 | 1.8 | 0.180.02 | 0.180.02 | 0.3 |
| 1532.8252 | 1534.3689 | 0.360.03 | 0.330.03 | 0.7 | 0.360.02 | 0.380.03 | 0.4 |
| 1536.3785 | 1538.2524 | 0.700.03 | 0.710.03 | 0.3 | 0.730.02 | 0.750.03 | 0.5 |
| 1547.2039 | 1548.5242 | 0.380.03 | 0.430.03 | 1.1 | 0.380.02 | 0.400.03 | 0.4 |
| 1548.8058 | 1551.0970 | 0.800.04 | 0.730.04 | 1.1 | 0.740.03 | 0.690.04 | 1.1 |
| 1551.1261 | 1553.3009 | 0.780.04 | 0.720.05 | 1.0 | 0.740.03 | 0.720.04 | |
| 1561.0355 | 1564.2556 | 1.210.05 | 1.230.06 | 0.3 | 1.180.04 | 1.430.04 | |
| 1564.8542 | 1565.9384 | 0.310.03 | 0.280.04 | 0.5 | 0.290.02 | 0.300.03 | 0.3 |
| 1580.8251 | 1584.6600 | 1.480.06 | 1.270.09 | 1.9 | 1.390.05 | 1.690.05 | |
| 1633.3333 | 1635.2345 | 0.650.04 | 0.660.05 | 0.1 | 0.690.03 | 0.630.04 | 1.1 |
| 1635.5581 | 1639.5630 | 1.180.07 | 1.070.08 | 1.1 | 1.140.05 | 1.050.06 | 1.1 |
| 1644.7046 | 1647.4554 | 0.330.06 | 0.390.07 | 0.6 | 0.370.05 | 0.300.06 | 1.0 |
| 1652.1115 | 1655.0240 | 0.500.06 | 0.620.07 | 1.3 | 0.550.05 | 0.560.06 | 0.1 |
| 1669.7450 | 1672.0913 | 0.900.05 | 0.830.05 | 1.0 | 0.850.04 | 0.830.05 | 0.3 |
| 1693.5436 | 1694.5145 | 0.230.04 | 0.220.04 | 0.1 | 0.240.03 | 0.200.03 | 0.8 |
| 1710.5782 | 1713.4303 | 1.030.07 | 1.070.07 | 0.5 | 1.050.05 | 1.140.06 | 1.2 |
| 1718.1025 | 1720.0240 | 0.610.06 | 0.560.07 | 0.5 | 0.600.05 | 0.610.06 | 0.2 |
| 1726.7717 | 1728.6649 | 0.690.06 | 0.710.06 | 0.3 | 0.670.05 | 0.720.05 | 0.7 |
| 1734.0371 | 1736.1002 | 0.900.06 | 0.980.06 | 0.9 | 0.920.05 | 1.000.05 | 1.2 |
| 1739.0291 | 1743.6892 | 2.410.13 | 2.560.09 | 0.9 | 2.470.07 | 2.410.08 | 0.6 |
| 1750.1213 | 1751.5032 | 0.650.05 | 0.700.05 | 0.7 | 0.690.04 | 0.620.05 | 1.1 |
Notes– List of 39 strong absorption lines that are detected in Epoch-1, Epoch-2, and Epoch-3 data with . Columns 1 and 2 are the lower and upper bounds of wavelengths, respectively, within which EWs are measured. Columns 3 and 4 are the observed EWs in Epoch-1 and Epoch-2 data, respectively. Columns 6 and 7 are the observed EWs in Epoch- and Epoch-3 data, respectively. The 1 errors in EW measurements (i.e. ) are calculated after incorporating the continuum placement uncertainties. Columns 5 and 8 are the values as defined in Eq. 1. aN iv 765, bNe viii 770, and cNe viii 780 absorption lines from the mini-BAL outflow studied here.
Appendix B Full Spectrum of PG 1206+459

References
- Arav et al. (2013) Arav, N., Borguet, B., Chamberlain, C., Edmonds, D., & Danforth, C., 2013, MNRAS, 436, 3286
- Arav et al. (1995) Arav, N., Korista, K. T., Barlow, T. A., & Begelman, 1995, Nature, 376, 576
- Arav et al. (2008) Arav, N., Moe, M., Costantini, E., Korista, K. T., Benn, C., & Ellison, S., 2008, ApJ, 681, 954
- Barlow (1994) Barlow, T. A., 1994, PASP, 106, 548
- Begelman & Nath (2005) Begelman, M. C. & Nath, B. B., 2005, MNRAS, 361, 1387
- Capellupo et al. (2011) Capellupo, D. M., Hamann, F., Shields, J. C., Rodríguez Hidalgo, P., & Barlow, T. A., 2011, MNRAS, 413, 908
- Chand et al. (2010) Chand, H., Wiita, P. J., & Gupta, A. C., 2010, MNRAS, 402, 1059
- Danforth et al. (2010) Danforth, C. W., Stocke, J. T., & Shull, J. M., 2010, ApJ, 710, 613
- Di Matteo et al. (2005) Di Matteo, T., Springel, V., & Hernquist, L., 2005, Nature, 433, 604
- Ding et al. (2003) Ding, J., Charlton, J. C., Churchill, C. W., & Palma, C., 2003, ApJ, 590, 746
- Drake et al. (2009) Drake, A. J., Djorgovski, S. G., Mahabal, A., et al., 2009, ApJ, 696, 870
- Dunn et al. (2010) Dunn, J. P., Bautista, M., Arav, N., et al., 2010, ApJ, 709, 611
- Filiz Ak et al. (2013) Filiz Ak, N., Brandt, W. N., Hall, P. B., et al., 2013, ApJ, 777, 168
- Gibson et al. (2008) Gibson, R. R., Brandt, W. N., Schneider, D. P., & Gallagher, S. C., 2008, ApJ, 675, 985
- Green et al. (2012) Green, J. C., Froning, C. S., Osterman, S., et al., 2012, ApJ, 744, 60
- Hall et al. (2011) Hall, P. B., Anosov, K., White, R. L., Brandt, W. N., Gregg, M. D., Gibson, R. R., Becker, R. H., & Schneider, D. P., 2011, MNRAS, 411, 2653
- Halpern (1984) Halpern, J. P., 1984, ApJ, 281, 90
- Hamann et al. (1997) Hamann, F., Barlow, T. A., & Junkkarinen, V., 1997, ApJ, 478, 87
- Kilerci Eser et al. (2015) Kilerci Eser, E., Vestergaard, M., Peterson, B. M., Denney, K. D., & Bentz, M. C., 2015, ApJ, 801, 8
- King (2003) King, A., 2003, ApJ, 596, L27
- King (2005) —, 2005, ApJ, 635, L121
- Lundgren et al. (2007) Lundgren, B. F., Wilhite, B. C., Brunner, R. J., Hall, P. B., Schneider, D. P., York, D. G., Vanden Berk, D. E., & Brinkmann, J., 2007, ApJ, 656, 73
- McGraw et al. (2015) McGraw, S. M., Shields, J. C., Hamann, F. W., Capellupo, D. M., Gallagher, S. C., & Brandt, W. N., 2015, MNRAS, 453, 1379
- Meiring et al. (2013) Meiring, J. D., Tripp, T. M., Werk, J. K., Howk, J. C., Jenkins, E. B., Prochaska, J. X., Lehner, N., & Sembach, K. R., 2013, ApJ, 767, 49
- Misawa et al. (2014) Misawa, T., Charlton, J. C., & Eracleous, M., 2014, ApJ, 792, 77
- Misawa et al. (2007) Misawa, T., Eracleous, M., Charlton, J. C., & Kashikawa, N., 2007, ApJ, 660, 152
- Murray et al. (1995) Murray, N., Chiang, J., Grossman, S. A., & Voit, G. M., 1995, ApJ, 451, 498
- Muzahid et al. (2015a) Muzahid, S., Kacprzak, G. G., Churchill, C. W., Charlton, J. C., Nielsen, N. M., Mathes, N. L., & Trujillo-Gomez, S., 2015a, ApJ, 811, 132
- Muzahid et al. (2013) Muzahid, S., Srianand, R., Arav, N., Savage, B. D., & Narayanan, A., 2013, MNRAS, 431, 2885
- Muzahid et al. (2015b) Muzahid, S., Srianand, R., & Charlton, J., 2015b, MNRAS, 448, 2840
- Muzahid et al. (2012) Muzahid, S., Srianand, R., Savage, B. D., Narayanan, A., Mohan, V., & Dewangan, G. C., 2012, MNRAS, 424, L59
- Narayanan et al. (2004) Narayanan, D., Hamann, F., Barlow, T., Burbidge, E. M., Cohen, R. D., Junkkarinen, V., & Lyons, R., 2004, ApJ, 601, 715
- Osterman et al. (2011) Osterman, S., Green, J., Froning, C., et al., 2011, Ap&SS, 335, 257
- Petitjean & Srianand (1999) Petitjean, P. & Srianand, R., 1999, A&A, 345, 73
- Proga et al. (2000) Proga, D., Stone, J. M., & Kallman, T. R., 2000, ApJ, 543, 686
- Rodríguez Hidalgo et al. (2011) Rodríguez Hidalgo, P., Hamann, F., & Hall, P., 2011, MNRAS, 411, 247
- Savage et al. (2011) Savage, B. D., Narayanan, A., Lehner, N., & Wakker, B. P., 2011, ApJ, 731, 14
- Silk & Rees (1998) Silk, J. & Rees, M. J., 1998, A&A, 331, L1
- Srianand & Petitjean (2001) Srianand, R. & Petitjean, P., 2001, A&A, 373, 816
- Srianand & Shankaranarayanan (1999) Srianand, R. & Shankaranarayanan, S., 1999, ApJ, 518, 672
- Vivek et al. (2014) Vivek, M., Srianand, R., Petitjean, P., Mohan, V., Mahabal, A., & Samui, S., 2014, MNRAS, 440, 799
- Vivek et al. (2012) Vivek, M., Srianand, R., Petitjean, P., Noterdaeme, P., Mohan, V., Mahabal, A., & Kuriakose, V. C., 2012, MNRAS, 423, 2879
- Wiersma et al. (2011) Wiersma, R. P. C., Schaye, J., & Theuns, T., 2011, MNRAS, 415, 353