Water activity in lamellar stacks of lipid bilayers: “Hydration forces” revisited
Abstract
Water activity and its relationship with interactions stabilising lamellar stacks of mixed lipid bilayers in their fluid state are investigated by means of osmotic pressure measurements coupled with small-angle x-ray scattering. The (electrically-neutral) bilayers are composed of a mixture in various proportions of lecithin, a zwitterionic phospholipid, and Simulsol, a non-ionic cosurfactant with an ethoxylated polar head. For highly dehydrated samples the osmotic pressure profile always exhibits the “classical” exponential decay as hydration increases but, depending on Simulsol to lecithin ratio, it becomes either of the “bound” or “unbound” types for more water-swollen systems. A simple thermodynamic model is used for interpreting the results without resorting to the celebrated but elusive “hydration forces”.
1Universidade de São Paulo, Instituto de Física-GFCx, P.O.B. 66318, São Paulo, SP 05314-970, Brazil.
2Université de Bordeaux, Centre de recherche Paul-Pascal–CNRS, 115 avenue du Docteur-Schweitzer, F-33600 Pessac, France.
1 Introduction
From mixtures of lipids and water, multilamellar systems may naturally emerge. In such self-assembled systems, a periodic structure is formed by stacking lipid bilayers and layers of water. In the case where there is no in-plane order in the bilayers–in their so-called “fluid state”–, the system exhibits the symmetry of a smectic A phase, commonly referred to as a lamellar Lα phase in the context of lipid materials [1].
Assessing the mechanisms responsible for the stability of such lamellar structures has been the core motivation for quite a large number of experimental or theoretical studies, with “hydration interactions” [2], on one hand, and “undulation interactions” [3] on the other hand emerging as central concepts more than 35 years ago when direct electrostatic interactions are irrelevant. Techniques of choice for studying inter-bilayer interactions include osmotic pressure control [2, 4, 5], line-shape analysis in high-resolution [6] or grazing-incidence small-angle scattering geometries [7], dynamic light scattering [8], and “direct” methods with, e.g. Surface Force Apparatuses [9]. Clear experimental evidences have been obtained as regards undulation interactions in the swollen end of dilution lines [6], while the other (highly dehydrated) limit has often been generically characterised in terms of “hydration interactions” from the observed exponentially-decaying force (or pressure) profile with natural scale 0.2–0.4 nm [2].
Here, we study a lecithin-based lamellar system in the presence of a non-ionic co-surfactant, a system which has shown its ability to efficiently encapsulate DNA fragments in spite of the absence of any obvious direct electrostatic mechanism at play [10, 11, 12]. The co-surfactant we use is an ethoxylated fatty acid, i.e. a (short) non-ionic block copolymer with amphiphilic properties. The present work therefore somehow expands Ref. [13, 14], the focus being now osmotic pressure control instead of line-shape analysis in small-angle scattering.
The lamellar structure of the stacked bilayers is equilibrated with various semi-dilute (aqueous) solutions of polymers, which gives a handle on water activity (or, equivalently, osmotic pressure ), while the stacking period is determined by means of small-angle X-ray scattering, following the method popularised by V.A. Parsegian [5]. Other relevant quantities are commonly manipulated when presenting or discussing the results, namely the bilayer volume fraction and the interfacial area per (average) amphiphilic molecule . Assuming homogeneous and ideally flat bilayers, a simple geometric description of the lecithin–Simulsol lamellar stack in water gives (see, e.g., Ref. [14])
| (1) |
where is the effective molecular volume of the bilayer species (with , respectively , being the molecular volume of the lecithin, resp. Simulsol molecules and the Simulsol mole fraction in the bilayer), similarly being an effective interfacial molecular area derived from actual Simulsol and lecithin interfacial areas. Note that, while , , or are experimentally well-defined quantities, and , as well as , can safely be considered as constant parameters, is model-dependent, as should be clear from the assumptions leading to eq. (1): These assumptions would be spoilt by the presence of numerous structural defects (holes across single bilayers, passages connecting adjacent bilayers–implying no longer homogeneous bilayers), or large-amplitude area-storing bilayer undulations–implying no longer flat bilayers.
2 Thermodynamic considerations
2.1 Lamellar stacks
Implicitly assuming for the sake of simplicity a two-component (lipid–water) system, it is customary to cast the interpretation framework of the data into the mould of, loosely speaking, an inter-bilayer interaction potential energy per unit bilayer area , but perhaps more rigorous (as already noticed in Ref. [5]) to start from the excess free energy of the bilayer stack. Per unit volume of the lamellar stack (and disregarding an obvious dependence on temperature that remains implicit in the following), the excess free energy is a function of two among the three quantities appearing in eq. (1). Choosing and , the excess free energy density, formally written as follows:
| (2) |
should be zero, by definition, for either or . The total Gibbs free energy is then expressed as
| (3) |
Here, is the (hydrostatic) pressure. Indices , respectively , refer to water, resp. “average” lecithin / Simulsol lipid. The total numbers of molecules of a given species are and , and the chemical potentials for the pure species are and . The lipid volume fraction is . Incompressibility is enforced by considering the molecular volumes and as constant parameters, with therefore .
The “dilution law”, namely the relation, is derived from eq. (1) once the optimal interfacial area is obtained, for a given composition , by solving the minimisation equation
| (4) |
which is equivalent to solving
| (5) |
The “bilayer equation of state”, that is to say the explicit solution to this latter equation, is commonly expressed as or relations.
The “lamellar stack equation of state” results from equating the water chemical potential in a lamellar stack of given composition –and, therefore, of given optimal interfacial area –submitted to the (hydrostatic) pressure to the pure water chemical potential when pure water is submitted to (hydrostatic) pressure . The resulting standard expression is
| (6) |
either expressed as a or a relation.
Examples of the two above-mentioned equations of state are given for illustration in Fig. 1a and 1b–data extracted from Ref. [5].
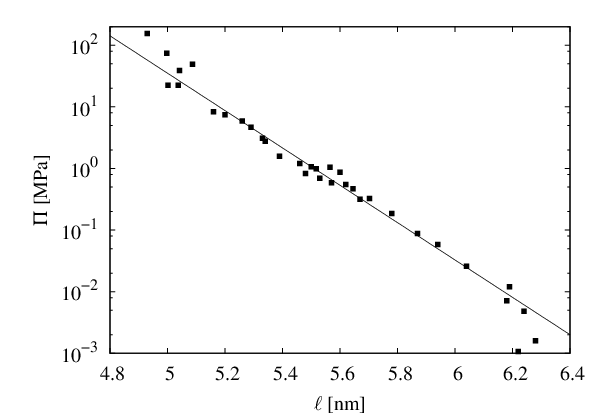

The quasi-exponential decay of the osmotic pressure with stacking period is also observed when is plotted against the thickness of the water channel , though with a different decay length: A value ca. 0.256 nm is found in the latter case [5], instead of ca. 0.143 nm in Fig. 1a. Quite significant also is the decrease in optimal interfacial area per lipid molecule as dehydration proceeds, a feature already observed more than 50 years ago with surfactant–water or lipid–water systems [15, 16, 17].
In the quite common case where a phase coexistence between a lamellar structure with finite spacing and (almost) pure water when added in excess is observed, the lamellar stack is said to be “bound”. This amounts to saying that, at some “dilution limit”, there is a finite value for the lipid volume fraction where the osmotic pressure reaches zero: . In the system studied in Ref. [5], for instance, the dilution limit is found at about nm. At contrast, (less common) “unbound” systems may be swollen seemingly indefinitely with water, and or, equivalently, . The so-called “unbinding transition”, theoretically described in Ref. [18, 19, 20], separates “bound” systems, with somehow weak undulation interactions, from “unbound” systems where stronger undulation interactions overcome attractive, van der Waals forces. It has been experimentally evidenced in appropriately chosen lamellar systems, see for instance Ref. [14] for a recent report.
2.2 Simple fluids
As argued in more details in this Section, the above-described unbinding features of lamellar stacks upon addition of solvent has actually some similarities with the liquid–gas transition in pure compounds when hydrostatic pressure is isothermally decreased: Molecular (translational) kinetic energy (3D configurational entropy) then plays the rôle of bilayer undulations in lamellar stacks (1D configurational entropy), with cohesive forces–viz. van der Waals interactions–acting similarly in both cases. Close to the triple point temperature, the liquid phase may be said to be “bound” in the sense that pressure may be decreased to (almost) zero while keeping a rather small specific volume for the system. Close to the critical point temperature, however, the liquid phase would be characterised as “unbound” because the specific volume may reach large values even though a significant pressure is still applied to the fluid. Fig. 2 illustrates this very common behaviour in the case of the fluid phase of ethane–data extracted from Ref. [21]–where, for the sake of comparison with lamellar phase data, the physically-relevant parameter, namely the specific volume, has been expressed as an average distance between neighbouring molecules in the liquid.

A conspicuous feature of the experimental pressure equations of state displayed in Fig. 2 may be noted at the high pressure end of the two curves, with a quasi-exponential behaviour that somehow resembles the one observed in Fig. 1a. At contrast with lamellar phase data, however, the characteristic decay length is here very short. Values in the range – nm are found for , the shorter value being appropriate for the lower temperature.
Interpreting parameter in terms of molecular dimensions seems difficult, but a simple interpretation for the observed behaviour is easily found in considering the van der Waals equation of state for pure, fluid compounds. In terms of only two parameters, namely a second virial coefficient describing the intermolecular interactions, and an excluded volume accounting for the finite molecular dimensions, van der Waals equation of state is [22]
| (7) |
with the specific volume of the van der Waals fluid, the Boltzmann constant and the temperature. Dense fluids, i.e. systems with specific volumes only moderately larger than , may be obtained at moderate pressures if the second virial coefficient is negative enough. With the integral expression for in terms of the Mayer function [23], this occurs when , a measure of thermally-driven translational kinetic energy, is small enough compared to cohesive energy. Below a critical temperature where decreases below the condensation threshold in the van der Waals model, liquid phases may indeed be formed. An illustration is given in Fig. 3 for two values of the second virial coefficient, one close to, the other one farther below the condensation threshold.

Note that, for plotting eq. (7) in Fig. 3, the specific volume range has been restricted: On the low density end, to avoid entering the liquid–gas coexistence region where eq. (7) no longer applies, but also on the high density end, to avoid a spurious logarithmic singularity implicit in the van der Waals description of the configurational entropy.
The similarity between Fig. 2 and 3 is striking, in particular as regards the large mismatch between decay parameters, resulting from either experiment or model, and characteristic molecular dimensions. A compelling interpretation for the quasi-exponential pressure decay observed over a range of intermolecular separations is therefore the following: It is not related to any structural property of the system and should be attributed to the standard competition (with a temperature-dependent outcome, obviously) between cohesive energy, favoured in high density states because of attractive van der Waals interactions between molecules ( term in eq. (7)), and configurational entropy, reduced in high density states owing to short-range steric repulsions ( term in eq. (7)). Besides, the precise shape of the interaction profile, e.g. a repulsive well combined with a attractive component in the standard Lennard-Jones parametrisation of van der Waals interactions [24], is irrelevant here since the spatial integration of the Mayer function leading to smoothes out such details.
Taking one step further and considering the similarities between Fig. 1a with either Fig. 2 or Fig. 3, it now seems natural to relate the quasi-exponential decay in the lamellar stack equation of state to a similar competition between cohesive energy (arising in lamellar stacks from van der Waals interactions through the water channels between lipid bilayers) and configurational entropy, as repeatedly suggested by J. Israelachvili and H. Wennerström [25, 26, 27]. This idea–in essence that “the swelling process is entropy driven”[28]–has found a partial support in recent numerical simulations [29]. It is developed in Section 2.3 below.
2.3 Lamellar stacks “à la van der Waals”
Before presenting our model, a word of caution: Nothing prevents, in principle, some direct (repulsive) “hydration forces” playing a (marginal) rôle in the detailed characteristics of the lamellar stack equation of state. Possible physical mechanisms for such direct forces involve the solvent (water) binding properties with the bilayer surfaces [30], or solvent structural properties [31, 32] through a mechanism similar to wetting [33] in this latter case: With anti-symmetric boundary conditions at the bilayer–solvent interface, the order parameter profile of a (non scalar) property associated to solvent across the water channel, electric polarisation typically, would lead indeed to an effective repulsive interaction in the lamellar stack. Interactions would nevertheless remain essentially attractive in the case of symmetric boundary conditions, as shown by Richetti et al. in their study of a structure-prone (pre-smectic) solvent confined between solid surfaces [34]. In any case, “hydration forces” if they exist in this restricted sense would merely affect the magnitude of the second virial coefficient in the van der Waals fluid analogy, increasing (if attractive–more cohesion) or decreasing (if repulsive–less cohesion), which would only slightly displace the location of the critical temperature in the phase diagram.
It therefore appears necessary to reconsider carefully the interpretation of statements similar to
Hydration repulsion universally acts between well-solvated surfaces in water and balances the van der Waals attraction in the nanometre range
(quoted from Ref. [29]) found in references spanning more than 30 years, for instance Ref. [5, 18, 35]. The underlying vision of a balance is commonly expressed in quantitative terms by adding pressures (forces per unit bilayer area), with as many contributions to the sum as identified interactions. In the simplest case where only hydration and van der Waals interactions are considered to be relevant, the total pressure is [5]
| (8) |
where the exponentially-decaying, repulsive term represents hydration forces and the combination of power laws describes, in the simplest possible way, attractive van der Waals forces between identical, planar and parallel objects of infinite lateral extension and thickness [ in eq. (1)], separated by a channel of width . In eq. (8), is the amplitude of the hydration pressure, its decay length and the Hamaker coefficient.
From Ref. [5], values appropriate for describing the experimental measurements in egg-lecithin-based lamellar stacks are: Pa, nm and J. As already mentioned in Section 2.2, parameter –introduced here–differs from parameter used for describing the lamellar stack equation of state displayed in Fig. 1a. This comes from the choice made in Ref. [5], the lamellar stack equation of state being represented by a different function . It differs from because actually depends on hydration. The “balance” between hydration and van der Waals forces is obtained at a maximum swelling nm, where bilayer thickness is nm.
But there is more in thermodynamics than in mechanics or, in other terms, free energy is more than mere potential energy: A complete description of, e.g., equations of state or phase diagrams is not wholly encapsulated in force models similar to eq. (8) that ignore entropy, a criticism already explicitly formulated in the context of the unbinding transition by R. Lipowski and S. Leibler [18] or S.T. Milner and D. Roux [20]. They showed that, even though the mechanical (but ad hoc) model, eq. (8), accounts extremely well for the measured osmotic pressure data–Fig. 1a–it utterly fails in explaining the detailed thermodynamic features of the unbinding transition. What is missing in the naïve mechanical approach is, specifically, a description of the bilayer equation of state–Fig. 1b–as well as a physically well-grounded interpretation of the “hydration forces”–two aspects recently emphasised in References [35, 36] and [37], respectively.
In the present approach, we propose to overcome these shortcomings by modelling the fundamental thermodynamic quantity in the problem, namely the excess free energy density , with the following physical ingredients: i) Helfrich undulation (entropic) interactions between bilayers across the water channels, ii) van der Waals (and possibly other) direct interactions at the level of a second virial coefficient description as in Ref. [20], and iii) bilayers described as being, individually, a kind of two-dimensional van der Waals fluid well below its own unbinding transition in the sense given to it in Section 2.2. It is worth mentioning again that, owing to the virial approach chosen in ii), the precise shape of the interaction potential, a repulsive exponentially-decaying term added to an attractive power-law contribution as would result from eq. (8) for instance, is irrelevant here, for the same reasons as given in Section 2.2. In quantitative terms, our heuristic approach amounts to writing
| (9) | |||||
where depends on and according to eq. (1) and is again a convenient notation for . In eq. (9), being the base of the natural logarithm, is the bilayer bending modulus (controlling the amplitude of thermally-driven bilayer undulations [3]), is the second virial coefficient accounting for (inter-bilayer) direct interactions according to S.T. Milner and D. Roux [20], is the “excluded area” in the two-dimensional fluid of lipid molecules, is the second virial coefficient accounting for intra-bilayer interactions between lipid molecules, “à la van der Waals”, and a parameter with length units analogous to the thermal de Broglie wavelength in ideal (3D) classical gases [38].
For illustrating the essential rôle of ingredient iii) in the physical content of eq. (9), Fig. 4 displays a set of curves for as a function of the area per lipid molecule for a few selected bilayer volume fractions . The numerical values for the parameters used in the computation of are given in Table 1.

| [nm3] | [nm2] | [nm] | [nm-6] | ||
| 2. | 1.0 | 0.48 | 0.1 | -10. |
As suggested by the trends observed in Fig. 4 (and confirmed by a thorough numerical analysis), the “optimal” area where reaches its minimum value depends only weakly on the bilayer volume fraction for dilute lamellar stacks, but much more strongly as the lamellar phase becomes highly dehydrated. This is easily interpreted, in qualitative terms, by a competition between stack entropy, as described by the Helfrich undulation term that strives for large (corresponding to small ) values, and two-dimensional liquid bilayer entropy, as described by the excluded area term, oppositely striving for large values. The second virial coefficient , negative enough to ensure a “bound” two-dimensional liquid state for the lipid fluid, comes into play when the stack entropy is optimised, i.e. for dilute enough lamellar stacks, and stabilises to a value greater than, but still rather close to ( for Table 1 parameter values).
Even though it appears difficult to obtain the bilayer equation of state by analytically solving eq. (5), a numerical procedure for determining the optimal is easily implemented, considering the simple shapes of the curves displayed in Fig. 4. But the possibility of describing a “bound” lamellar stack, that is to say a system where the osmotic pressure reaches 0 at a finite hydration (Section 2.1) should be simultaneously taken into account. This is not a too stringent constraint since eq. (6) leads in the context of the present model eq. (9) to a rather simple expression for the osmotic pressure, namely
| (10) |
where the terms originating from the two-dimensional fluid of lipid molecules exactly cancel out. The resulting lamellar stack equation of state, as well as the bilayer equation of state are displayed in Fig. 5a and 5b, respectively.


The broad features of both figures are rather similar to the experimental results displayed in Fig. 1a and 1b for lamellar stacks, and (as far as the pressure equation of state is concerned) in Fig. 2 for a simple fluid. In addition, the unbinding transition remains well described within the framework of eq. (9), extending Ref. [20]. We have (numerically) explored the consequences on the dilution limit of decreasing the Milner-Roux virial coefficient , keeping all other parameters fixed to the values given in Table 1. As shown in Fig. 6, the prediction of our model is compatible with a scaling law , with critical unbinding occurring for nm-3 (or Pa) and an unbinding exponent .

The discrepancy between our result for the unbinding exponent, namely , and the theoretically-predicted values in Ref. [20] or in Ref. [18] may come from the unsophisticated numerical methods used for obtaining the bilayer equation of state from eq. (5). We leave a more detailed discussion to interested specialists.
In Section 3, we further strengthen the relevance of our thermodynamic model, confronted with experimental results obtained for lecithin–Simulsol lamellar phases of varying bilayer compositions.
3 Experimental results and discussion
Small-angle x-ray scattering data are recorded, for a given bilayer composition (described, from now on, in terms of Simulsol mass fraction, instead of mole fraction as in Section 1), after immersing the dry lipid material in polymer solutions of various initial concentrations and waiting for water activity to equilibrate in both lamellar and polymer phases. Typical results are displayed in Fig. 7, for a system with Simulsol mass fraction .

The first and second order Bragg peaks, with ratio 1:2 as expected for a one-dimensional lamellar order, are always observed, a third order peak being also noticeable in the investigated -range for the more hydrated samples. The Bragg peaks are shifted towards larger values as osmotic pressure is increased because of the concomitant dehydration of the lamellar stack.
From the first order Bragg peak location , the stacking period is directly obtained: . Since the dilution law, i.e. the relation, has been previously experimentally determined [13], the x-ray measurement indirectly gives the bilayer volume fraction . Because the amount of (initially dry) lipid in the whole system is known, mass conservation allows determining the equilibrium polymer concentration from its initial value in the known amount of polymer solution used for hydrating the lamellar stack. The lamellar stack equation of state then results from the auxiliary calibration curve (see Fig. 8) giving the osmotic pressure of the polymer solution as a function of polymer concentration.

An illustration for the system with Simulsol mass fraction is given in Fig. 9, with a quasi-exponential decay of the osmotic pressure observed in a range of stacking parameters .

The set of data shown in Fig. 10 is obtained by repeating the same procedure and analyses for mass fractions spanning the pure lecithin () to the almost pure Simulsol () range.

It was not possible to include the pure Simulsol system, and not even the bilayer composition in the present study because at low osmotic pressures the water channel height reaches values so large that the polymer molecules can no longer be considered as excluded from the lamellar stack. Thus, increasing apparently plays the rôle of approaching the unbinding transition here, as recently observed for a closely related system by a different technique [14].
The thermodynamic model discussed in Section 2.3 and, more specifically, eq. (9) have been used for describing the lamellar stack equations of state displayed in Fig. 9 and 10, as well as the bilayer equations of state displayed in Fig. 11.

We have not attempted to implement a complete fitting procedure to finely tune values for all the parameters listed in Table 1, but checked in a few numerical simulations the influence of changing the bilayer bending modulus (bilayer stack entropy), as well as the Milner-Roux virial coefficient (bilayer stack enthalpy, resulting from both attractive and repulsive contributions to inter-bilayer direct interactions) and excluded area (two-dimensional fluid entropy). The continuous curves superimposed to data points in Fig. 9 and 10 obviously give a fair description of the osmotic pressure data, with parameters given in Table 2.
| [nm-6] | [nm2] | [nm] | ||
|---|---|---|---|---|
| 0.8 | 0.55 | 0.18 | 0.370 | 9.01 |
| 0.7 | 0.15 | 0.43 | 0.477 | 8.86 |
| 0.5 | 0.047 | 0.43 | 0.635 | 12.0 |
| 0.3 | 0.13 | 0.43 | 0.525 | 8.53 |
| 0.1 | 0.33 | 0.30 | 0.495 | 7.51 |
| 0.05 | 0.40 | 0.36 | 0.485 | 6.95 |
| 0.0 | 0.35 | 0.65 | 0.505 | 6.22 |
The description, though acceptable, is less satisfactory as far as the bilayer equation of state is concerned, see Fig. 11. Note that, for a better readability, a (representative) subset only of the available model curves is displayed. Improvements in the two-dimensional liquid model for describing the intra-bilayer thermodynamic contribution to the lamellar stack excess free energy, eq. (9), might here be required.
There is a rather remarkable trend in the evolution with the bilayer composition of the model parameters , and , as well as in the model-predicted dilution limit illustrated in Fig. 12a, 12b, 12c, and 12d respectively.


Two conspicuous compositions can be distinguished, one in the range – close to pure lecithin, and when is close to 0.5. In a previous structural study of the same lecithin–Simulsol system [13], the value was already experimentally evidenced as separating two regimes, even though the experimental dilution limit did not follow what is predicted here Fig. 12d. Still, the data for the area per (effective) lipid molecule as a function of hydration displayed in Fig. 11 clearly indicates that composition experimentally plays a special rôle. The area per lipid molecule is significantly larger–and specially sensitive to hydration–than with all other bilayer compositions, an experimental feature independent from any model. This could indicate that the composition threshold for the “brush-to-mushroom” conformational transition in the hydrophilic blocks of Simulsol molecules suggested in Ref. [13] and [14] is close to , and may give a clue for reaching a better agreement between experimental and predicted bilayer equations of state, at the expense of introducing a “brush-to-mushroom” variable into eq. (9). Besides, the experimental “back-and-forth” variation of when is close to zero observed in Fig. 11, though not easily interpreted, is nicely compatible with the picture that emerges from the thermodynamic model of the lamellar stack, Fig. 12, being simultaneously much less model-dependent: It should therefore correspond to a robust, but still unexplained, feature of the lecithin–dilute Simulsol mixture.
4 Conclusion
The interplay between soft confinement and steric effects has been studied in lamellar stacks of mixed lecithin–Simulsol bilayers, varying hydration and bilayer composition, by coupling osmotic pressure with small-angle x-ray scattering measurements that give access to both “lamellar stack” and “bilayer” equations of states.
With the help of a thermodynamic model of lamellar stacks that extends the approach of S.T. Milner and D. Roux [20] by the explicit inclusion of the thermodynamic properties of a two-dimensional fluid representing the lipid bilayers, we are able to quantitatively reproduce the osmotic pressure, and semi-quantitatively the lipid area data, keeping a meaningful description of the unbinding transition. The physical ingredients of the model are the Helfrich undulation interactions, controlled by a bending modulus parameter , direct inter-bilayer interactions controlled by the Milner-Roux virial coefficient , and a description of the two-dimensional lipid fluid by the venerable van der Waals model designed more than a century ago for ordinary fluids, with an excluded area parameter and a second virial coefficient . The celebrated, but elusive “hydration forces” play no rôle whatsoever in the model, while quasi-exponential osmotic pressure profiles remain, at least in a restricted range of water content in the lamellar stacks.
Among the intriguing outcomes of applying the model to describing the available osmotic and small-angle scattering data, it appears that adding a co-surfactant (Simulsol) to the lipid bilayer not necessarily always increases the bilayer flexibility, even though remains very sensitive to the amount of co-surfactant. This may be due to a kind of “brush-to-mushroom” transition taking place in the hydrophilic block of the Simulsol surfactant. The model prediction also does not quite fit with previous experimental results on the same system as far as the dilution limit of the lamellar stacks are concerned.
The better knowledge of the lamellar stack free energy gained here should still be refined, for instance in view of understanding the detailed mechanisms of the lamellar-lamellar phase coexistence at low hydration observed in rather similar lecithin–Simulsol systems [14].
Acknowledgements
The support by Fundação de Amparo à Pesquisa do Estado de São Paulo through grant 2011/16149-8 is gratefully acknowledged. We also thank IdEx Bordeaux (France) and Conselho Nacional de Desenvolvimento Científico e Tecnológico (Brazil) for providing support through their respective programs “Doctorat international” and “Ciência sem Fronteiras”.
Author contribution statement
All authors contributed equally to the present work.
Appendix A Appendix
A.1 Polymer solutions
The polymer used in this study is polyvinylpyrrolidone (PVP), from Sigma-Aldrich, in three molecular weights (10, 40 and 360 kg/mol). The polymer solutions are purified using snakeskin dialysis tubes (from Thermo Scientific) of different pore dimensions. The dialysis compartments filled with polymer solution were immersed in a tank initially containing pure water, and the water content was changed a few times, until the total volume reached 300 times the volume of the solution. The whole procedure took about one week. Once purified, the solutions were freeze-dried, which allowed re-dispersing the polymer material in water at various desired concentrations. The complete polymer dissolution could take a few days for the more concentrated solutions with PVP360.
The osmotic pressure of each prepared solution was measured with the PZL-100 osmometer from PZL Tecnologia Company. Results are displayed in Fig. 8. The nearly-quadratic increase of osmotic pressure with polymer concentration, independently of the polymer molar mass, is characteristic of polymer solutions being in their semi-dilute regime. The relation is empirically described by the polynomial law – pressure in Pa, concentration in g/mL – which allows computing the osmotic pressure applied to lamellar stacks.
A.2 Osmotically-stressed lamellar stacks
The lipid membranes are prepared with soy lecithin (Avanti Polar Lipids) and a non-ionic commercial cosurfactant (Simulsol 2599 PHA, Seppic). Soy lecithin contains mainly dilinoleoylphosphatidylcholine (DLPC), with typically 35% of other (zwitterionic) lipids. Simulsol is a mixture of ethoxylated fatty acids (71% oleic and 11% palmitic acids being the main components), with an average of 10 CH2–O–CH2 groups in the hydrophilic block. Lecithin and Simulsol are co-solubilised in cyclohexane in desired proportions, which always leads to macroscopically homogeneous, transparent solutions. Therefore, a priori homogeneous mixtures of controlled composition (labelled as a mass fraction ) are obtained by evaporating the solvent. Lamellar systems are then prepared by swelling a chosen mass of the dry amphiphilic mixture with thrice the amount of polymer solutions, tuning the polymer mass and initial concentration to scan as much as possible of the accessible domain of osmotic pressures once equilibrium is reached. The sample tubes were conserved at C and cycles of centrifugation were done to accelerate homogenisation. Equilibrium is reached when water activity is the same in coexisting lamellar and polymer phases, which is easily deduced by observing the tubes characterised by a viscous and slightly turbid solution on top of a transparent polymer solution. Osmotic equilibrium also implies that some lecithin or Simulsol species are to be found in the polymer solution. The corresponding concentrations are, however, expected to be in the order of their respective critical micellar–aggregation–concentrations, viz. quite low. Neglecting the amount of “lost” material in computing the lamellar phase lipid fraction, as well as neglecting the contribution of lipid aggregates to osmotic pressure are therefore safe approximations.
A.3 Small-angle x-ray scattering
The small-angle scattering experiments were carried out at the Institute of Physics, University of São Paulo, Brazil, with the Xeuss instrument form Xenocs equipped with a Pilatus 300K detector (Dectris). Radiation produced by the microfocus Copper source is collected with a single-reflection multilayer optic producing a low-divergence, monochromatic beam with wavelength nm that is further collimated by a pair of scatterless slits–upstream slits 0.60.6 mm, downstream slits 0.50.5 mm. The sample-to-detector distance, calibrated with a Silver Behenate standard, is 0.77 m. Detector images span in practice a scattering wave vector range extending from 0.04 nm-1 to 3.5 nm-1. Samples are held in glass capillaries with a nominal diameter of 1.5 mm, and the scattering intensity is corrected for background by subtracting the properly normalised signal of a capillary filled with pure water. Exposure time varies from 15 up to 30 minutes, depending on the polymer solution concentration.
References
- [1] T. Gulik-Krzywicki, E. Rivas, and V. Luzzati, J. Mol. Biol. 27 (1967) 303
- [2] D.M. LeNeveu, R.P. Rand, V.A. Parsegian, and D. Gingell, Biophys. J. 18 (1977) 209
- [3] W. Helfrich, Z. Naturforsch 33a (1978) 305
- [4] D.M. LeNeveu, R.P. Rand, and V.A. Parsegian, Nature 259 (1976) 601
- [5] V.A. Parsegian, N. Fuller, and R.P. Rand, Proc. Natl. Acad. Sci. USA 76 (1979) 2750
- [6] C.R. Safinya, D. Roux, G.S. Smith, S.K. Sinha, P. Dimon, N.A. Clark, and A.-M. Bellocq, Phys. Rev. Lett. 57 (1986) 2718
- [7] T. Salditt, C. Li, A. Spaar, and U. Mennicke, Eur. Phys. J. E 7 (2002) 105
- [8] F. Nallet, D. Roux, and J. Prost, J. Phys. France 50 (1989) 3147
- [9] P. Richetti, P. Kékicheff, J.L. Parker, and B.W. Ninham, Nature 346 (1990) 252
- [10] T. Pott, A. Colin, L. Navailles, and D. Roux, Interface Sci. 11 (2003) 249
- [11] E. Andreoli de Oliveira, E. R. Teixeira da Silva, A. Février, É. Grelet, F. Nallet, and L. Navailles, EPL 91 (2010) 28001
- [12] E.R. Teixeira da Silva, E. Andreoli de Oliveira, A. Février, F. Nallet, and L. Navailles, Eur. Phys. J. E 34 (2011) 83
- [13] B.B. Gerbelli, R.L. Rubim, E.R. Silva, F. Nallet, L. Navailles, C.L.P. Oliveira, and E. A. de Oliveira, Langmuir 29 (2013) 13717
- [14] K. Bougis, R. Leite Rubim, N. Ziane, J. Peyencet, A. Bentaleb, A. Février, C.L.P. Oliveira, E. Andreoli de Oliveira, L. Navailles, and F. Nallet, Eur. Phys. J. E 38 (2015) 78
- [15] V. Luzzati, H. Mustacchi, A. Skoulios, and F. Husson, Acta Cryst. 13 (1960) 660
- [16] V. Luzzati, F. Husson, J. Cell Biol. 19 (1962) 207
- [17] F. Reiss-Husson, J. Mol. Biol. 25 (1967) 363
- [18] R. Lipowsky, S. Leibler, Phys. Rev. Lett. 56 (1986) 2541
- [19] R. Podgornik, V.A. Parsegian, Langmuir 8 (1992) 557
- [20] S.T. Milner, D. Roux, J. Phys. I France 2 (1992) 1741
- [21] D. Bücker, W. Wagner, J. Phys. Chem. Ref. Data 35 (2006) 205
- [22] J.C. Maxwell, Nature 10 (1874) 477
- [23] J.E. Mayer, J. Chem. Phys. 5 (1937) 67
- [24] J.E. Jones, Proc. R. Soc. Lond. A 106 (1924) 463
- [25] J. Israelachvili, H. Wennerström, Langmuir 6 (1990) 873
- [26] J. Israelachvili, H. Wennerström, J. Phys. Chem. 96 (1992) 520
- [27] J. Israelachvili, H. Wennerström, Nature 379 (1996) 219
- [28] E. Sparr, H. Wennerström, Curr. Opin. Colloid Interface Sci. 16 (2011) 561
- [29] E. Schneck, F. Sedlmeier, and R.R. Netz, Proc. Natl. Acad. Sci. USA 109 (2012) 14405
- [30] M. Kanduč, A. Schlaich, E. Schneck, and R.R. Netz, Advances Colloid Interface Sci. 208 (2014) 142
- [31] S. Marčelja, N. Radić, Chem. Phys. Lett. 42 (1976) 129
- [32] G. Cevc, R. Podgornik, and B. Žekš, Chem. Phys. Lett. 91 (1982) 193
- [33] J.W. Cahn, J.W. Hilliard, J. Chem. Phys. 28 (1958) 258
- [34] P. Richetti, L. Moreau, P. Barois, and P. Kékicheff, Phys. Rev. E 54 (1996) 1749
- [35] V.A. Parsegian, T. Zemb, Curr. Opin. Colloid Interface Sci. 16 (2011) 618
- [36] P. Bauduin, T. Zemb, Curr. Opin. Colloid Interface Sci. 19 (2014) 9
- [37] S.H. Donaldson, Jr., A. Røyne, K. Kristiansen, M.V. Rapp, S. Das, M.A. Gebbie, D.W. Lee, P. Stock, M. Valtiner, and J. Israelachvili, Langmuir 31 (2015) 2051
- [38] See, for instance, C. Kittel and H. Kroemer in Thermal Physics, 2nd edition, W.H. Freeman and Co, New-York, 1980