Dielectron production in AuAu collisions at =200 GeV
Abstract
We present measurements of production at midrapidity in AuAu collisions at = 200 GeV. The invariant yield is studied within the PHENIX detector acceptance over a wide range of mass ( 5 GeV/) and pair transverse momentum ( 5 GeV/), for minimum bias and for five centrality classes. The yield is compared to the expectations from known sources. In the low-mass region (–0.76 GeV/) there is an enhancement that increases with centrality and is distributed over the entire pair range measured. It is significantly smaller than previously reported by the PHENIX experiment and amounts to or to for minimum bias collisions when the open heavy flavor contribution is calculated with pythia or mc@nlo, respectively. The inclusive mass and distributions as well as the centrality dependence are well reproduced by model calculations where the enhancement mainly originates from the melting of the meson resonance as the system approaches chiral symmetry restoration. In the intermediate-mass region ( = 1.2–2.8 GeV/), the data hint at a significant contribution in addition to the yield from the semileptonic decays of heavy flavor mesons.
pacs
25.75.DwI INTRODUCTION
Dileptons are important diagnostic tools of the Quark Gluon Plasma (QGP) formed in ultra-relativistic heavy ion collisions [1]. They are unique observables for their sensitivity to the chiral symmetry restoration phase transition expected to take place together with, or at similar conditions to, the deconfinement phase transition [2, 3]. When chiral symmetry is restored, the chiral doublets, such as the and the mesons, become degenerate in mass. As the meson is very difficult to observe experimentally, the meson is the main observable in this context. Due to its very short lifetime ( 1.3 fm/), the meson quickly decays after its formation and is therefore a sensitive probe of the medium where it is formed. The meson is mostly produced close to the phase boundary and possible modifications of its spectral function in the high temperature and density conditions prevailing there are thus imprinted in its decay products. The decay into dileptons, as opposed to hadrons, is of particular interest as they escape unaffected by the interaction region, thus carrying this information to the detectors.
Dileptons are sensitive to the thermal radiation emitted by the system, both the partonic thermal radiation (quark annihilation into virtual photons, ) emitted in the early stage of the collisions as well as the thermal radiation emitted later in the collision by the hadronic system. The main channel of the latter is pion annihilation, mediated through vector meson dominance by the meson (). Dileptons are produced by a variety of sources all along the entire history of the collision and it is necessary to know precisely all these sources in order to single out the interesting signals characteristic of the QGP related to chiral symmetry restoration or thermal radiation [4].
The CERES experiment pioneered the study of dielectrons at the Super Proton Synchrotron (SPS). A strong enhancement of low-mass electron pairs ( 1 GeV/) with respect to the cocktail of expected hadronic sources, was found in all nuclear systems studied, in S+Au collisions at 200 AGeV [5], in Pb+Au collisions at 158 AGeV [6, 7] and in Pb+Au collisions at 40 AGeV [8]. The enhancement was confirmed and further studied by the high statistics NA60 experiment that measured dimuons in In+In collisions at 160 AGeV [9, 10, 11, 12]. In both experiments, the low-mass dilepton enhancement is explained by in-medium modification of the meson spectral function [13, 14, 15, 16, 17, 18]. The data rule out the conjectured dropping mass of the meson as the system approaches chiral symmetry restoration [19, 20, 21]. Instead, the data are well reproduced by a scenario in which the meson copiously produced by annihilation is broadened by the scattering off baryons in the dense hadronic medium. The low-mass dilepton excess is thus identified as the thermal radiation signal from the hadron gas phase with a modified meson spectral function. A recent paper shows that in-medium modifications of vector and axial vector spectral functions lead to degeneracy of the and meson masses providing a direct link between the broadening of the meson spectral function and the restoration of chiral symmetry [22].
NA60 found also an excess at higher masses (=1–3 GeV/). Using precise vertex information this excess was associated with a prompt source originating at the vertex, as opposed to semi-leptonic decays of D mesons that originate at displaced vertices. The excess can be explained as thermal radiation from the QGP [9, 10, 11, 12, 15] but other interpretations based on hadronic models, similar to those that explain the low mass excess [13, 14], or on hadronic rates constrained by chiral symmetry considerations [16] can also reproduce the data.
At the Relativistic Heavy Ion Collider (RHIC), the PHENIX experiment reported a strong enhancement of low mass pairs in AuAu collisions at = 200 GeV [23]. In the 0%–10% most central collisions, where the excess is concentrated, the enhancement factor, defined as the ratio of the measured yield over the cocktail yield reaches an average value of (cocktail) in the mass range = 0.15–0.75 GeV/. All models that successfully reproduce the SPS results fail to explain the PHENIX data [23, 24].
The PHENIX result [23] was characterized by a considerable hadron contamination of the electron sample and by a small signal to background () ratio. In an effort to improve upon this measurement, a hadron-blind detector (HBD) was developed and installed in the PHENIX experiment [25, 26, 27]. The HBD provides additional electron identification, additional hadron rejection and improves the signal sensitivity.
In this paper we present dielectron results obtained with the HBD in 2010 for AuAu collisions at = 200 GeV. The paper is organized as follows. Section II describes the PHENIX detector with special emphasis on the HBD. In Section III we give a detailed account of the various steps of the data analysis including electron identification, pair cuts and background subtraction that is the crucial step in this analysis. The raw mass spectra, efficiency corrections and systematic uncertainties of the data are also discussed in this section. Section IV describes the procedures used to calculate the expected dielectron yield from the known hadronic sources. The results, including invariant mass spectra, distributions and centrality dependence, are presented in Section V. In the same section, the results are discussed with respect to previously published results and compared to available theoretical calculations. A summary is given in Section VI.
II PHENIX DETECTOR
Figure 1 shows a schematic beam view of the PHENIX central arm detector, as used during 2010 data taking. A detailed description of the detector, except the HBD, can be found in [28]. In this section, we give only a brief description of the PHENIX sub-systems relevant for the present analysis: global detectors, central magnet, central arm detectors, including drift chambers (DC), pad chambers (PC), ring-imaging Čerenkov (RICH) detectors, time-of-flight (TOF) detectors and electromagnetic calorimeters (EMCAL) and the HBD.
II.1 Global detectors
The measurement of the collision-vertex position, time, and centrality, as well as the minimum-bias (MB) trigger, is provided by two beam-beam counters (BBC) [29]. Each BBC comprises 64 quartz Čerenkov counters, located at 144 cm along the beam axis from the center of PHENIX, with 2 azimuthal coverage over the pseudorapidity interval . The collision-vertex position along the beam direction is determined from the difference of the average hit time of the photomultiplier tubes (PMTs) between the north and the south BBC. The -vertex resolution ranges from 0.5 cm in central AuAu collisions to 2 cm in collisions. The MB trigger requires a coincidence between at least two hits in each of the BBC arrays thus capturing % of the total inelastic cross section [30].
II.2 Central magnet
The PHENIX central magnet comprises two pairs of concentric coils, an inner coil pair and an outer coil pair, that can be operated independently and create an axial magnetic field parallel to the beam axis [31]. The coils are usually operated with current flowing in the same direction (the or configuration) so that their magnetic fields add together. For the dilepton measurement with the HBD in the 2010 run, the coils were operated with equal currents flowing in opposite directions. In this so called configuration, the inner coil counteracts the action of the outer coil so that their magnetic fields cancel each other, creating an almost field free region in the inner space extending from the beam axis out to a radial distance of 60 cm where the inner coil is located (see Fig. 1 of Ref. [27]). The field free region preserves the opening angle of pairs and this is an essential pre-requisite for the operation of the HBD. The HBD exploits the fact that the opening angle of pairs originating from conversions or from Dalitz decays is very small. When only one of the two tracks is reconstructed in the central arms, the HBD can reject them by applying an opening angle cut or a double signal cut on the HBD hits (see Section II.4). In this configuration however, the total field integral is = 0.43 Tm, about 40% of the value in the configuration.
II.3 Central arm detectors
PHENIX measurements at midrapidity are made with two central arm spectrometers, as shown in Fig. 1. Each central arm covers pseudorapidity 0.35 and azimuthal angle .
Charged-particle tracks are reconstructed using hit information from the DC, the first layer of PC (PC1) and the collision point along the z-direction [32]. The DCs are located outside the magnetic field in the radial distance 2.02–2.46 m from the beam axis. They provide an accurate measurement of the particle trajectory in the plane perpendicular to the beam axis. The PC1s are multiwire proportional chambers located just behind the DC at 2.47–2.52 m in radial distance from the beam axis [33]. They provide a three dimensional space point that is used to determine the track origin along the beam axis. The transverse momentum () of each particle is determined from the bending of its trajectory in the azimuthal direction. The total momentum is determined by combining with the polar angle information of PC1 and the vertex position . The reconstructed tracks are projected onto the HBD (see next subsection) and onto the central-arm detectors that provide electron identification: RICH, EMCal, and TOF.
The RICH is the primary central-arm detector used for electron identification in PHENIX [34], and is located in the radial region of 2.5–4.1 m, just behind PC1. The RICH uses CO2 as the gas radiator at atmospheric pressure, and has a Čerenkov threshold of = 35. This corresponds to a momentum threshold of 18 MeV/ for electrons and 4.7 GeV/ for pions. Two spherical mirrors reflect the Čerenkov light and focus it onto two arrays of 1280 PMTs each located outside the acceptance on each side of the RICH entrance window. The average number of hit PMTs per electron track is 5, and the average number of photo-electrons detected is 10. Below the pion threshold, the pion rejection is in or low multiplicity collisions. However, in high-multiplicity collisions, hadron tracks are misidentified as electrons when their trajectory is nearly parallel to that of a genuine electron. This effect limits the separation to in central AuAu collisions and requires special care as described below.
The EMCal measures the energy deposited by electrons and their shower shape [35]. It comprises eight sectors each covering in azimuth, where six sectors are made from lead-scintillator (PbSc) with an energy resolution and two are lead-glass (PbGl) with an energy resolution . The radial distance from the beam axis is 5.10 m for PbSc and 5.50 m for PbGl (see Fig. 1). The matching of the measured energy to the track momentum is used to identify electrons. The latter are all relativistic in the accepted momentum range ( 0.2 GeV/), hence the energy-to-momentum ratio is close to unity.
To further separate electrons and hadrons we use the time-of-flight information from the PbSc part of the EMCal which covers 75% of the acceptance but has a valid time response for 64% of the acceptance. In addition, we use the time-of-flight information from the TOF-east detector (TOF-E) [36] covering an additional 16% of the acceptance. The former has a time resolution of 450 ps, while the latter has a resolution of 150 ps. The rest of the acceptance, 9%, does not have a usable TOF coverage, because the time resolution of 700 ps provided by PbGl detectors is not sufficient for an effective separation of electrons and hadrons.
II.4 The Hadron Blind Detector
The HBD was installed in PHENIX prior to 2010. A detailed description of the concept, construction and performance of the HBD is given in Ref. [27]. Only a brief account is given here with emphasis on the specific aspects relevant to the present analysis.
The HBD provides additional electron identification and additional hadron rejection to the central arm detectors. Its main task is to recognize and reject conversions and Dalitz decays which are the dominant sources of the combinatorial background. Very often, only one of the two tracks of an pair from these sources is detected in the central arm, whereas the second one is lost because it falls out of the acceptance, is curled by the magnetic field or is not detected due to the inability to reconstruct low momentum tracks with 200 MeV/. The HBD exploits the fact that most of these pairs have a very small opening angle and thus produce two overlapping hits in the HBD, resulting in a charge response with an amplitude double the one corresponding to a single hit. Being sensitive to electrons down to very low momentum (see below), the HBD can detect both tracks and can effectively reject them by applying a double hit cut on the HBD signal. On the other hand, decays with a large opening angle between the electron and positron produce two well separated single hits on the HBD pad plane as illustrated in Fig. 2. The ability to distinguish single from double hits is one of the main performance parameters of the HBD. This is illustrated in Fig. 3, which shows the HBD response to single and double electron hits in real data. Single and double hits are selected from reconstructed low-mass pairs with large ( 100 mrad) and small ( 50 mrad) opening angles, respectively.

The HBD is a Čerenkov detector. It has a 50 cm long radiator directly coupled, in a windowless configuration, to a triple gas-electron-multiplier (GEM) detector [37] which has a CsI photocathode evaporated on the top face of the upper-most GEM foil and pad readout at the bottom of the GEM stack (see Fig. 4). The HBD uses pure CF4 at atmospheric pressure that has an average Čerenkov threshold of = 28.8 over the detector bandwidth, corresponding to a momentum threshold of 15 MeV/ for electrons and 4.0 GeV/ for pions. In this scheme, Čerenkov radiation from particles passing through the radiator is directly collected on the photocathode forming a circular blob image rather than a ring as in a RICH detector. The pad readout plane comprises hexagonal cells with a hexagon side of 1.55 cm. One cell subtends an opening angle of approximately 50 mrad and has an area of 6.2 cm2, comparable to the blob size which has a maximum area of 10 cm2. The electron response of the HBD is thus typically distributed over a maximum of 3 readout cells and subtends a maximum opening angle of 75 mrad.
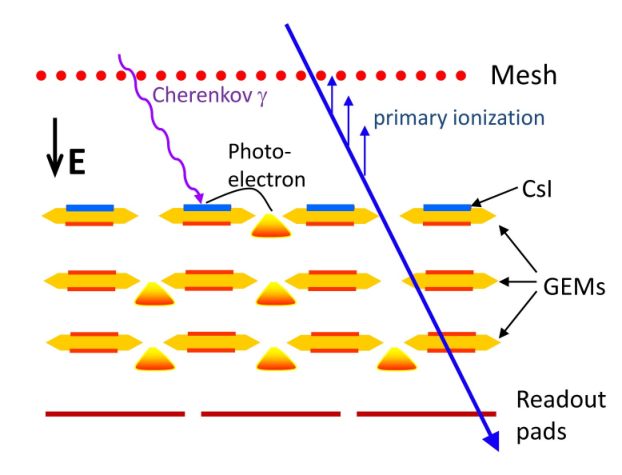
The hadron blindness property of the HBD is achieved by operating the detector in reverse bias mode where the mesh defining the detection volume is set at a lower voltage with respect to the CsI photocathode [25, 26] (see Fig. 4). Consequently, the ionization electrons produced by charged particles in the drift region defined by the entrance mesh and the photocathode are mostly repelled towards the mesh. Only the ionization electrons created in a thin layer of m above the photocathode are collected and amplified by the GEM stack leading to a very small signal, equivalent to a few p.e., localized in one single cell of the pad plane.
The choice of CF4 in a windowless configuration as the common gas for the radiator and the detector amplification medium, results in a large bandwidth of UV photon sensitivity from 6.2 eV (the threshold of the CsI photocathode) up to 11.1 eV (the CF4 cut-off). This translates into an average yield of 20 photo-electrons (p.e.) per electron, as shown in Fig. 3, corresponding to a measured figure of merit of 330 cm-1, very high for a gas Čerenkov detector [27].
The HBD is located close to the interaction vertex, in the field-free region, starting immediately after the beam pipe at r = 5 cm and extending up to r = 60 cm. The detector comprises two identical arms, each covering 112.5∘ in azimuth and 0.45 units of pseudorapidity. The active area of each arm is subdivided into 10 detector modules, 5 along the azimuthal axis and 2 along the axis. With this segmentation, each detector module is cm2 in size. The material budget (See Table 1) in front of the GEM detectors is 0.62% of a radiation length dominated by the CF4 contribution of 0.56%. To this, one has to add the contribution of the GEM stack, the vessel back plane and the front-end electronics attached to the vessel to give a total of 2.4% of a radiation length for the entire detector.
| Component | Radiation length | ||
|---|---|---|---|
| (%) | |||
| Window (aclar/kapton) | 0.04 | ||
| Gas (CF4) | 0.56 | ||
| GEM stack | 0.42 | ||
| Vessel back plane + front-end electronics | 1.4 | ||
| Total | 2.4 |
Good gain calibration is crucial to achieve the best possible separation between single and double hits in the HBD. Gain variations occur as a function of time due to two main factors: (i) variations of temperature and pressure and (ii) charging effects of the GEM foils produce an initial rise of the gain after switching on the HV, that can last for several hours before stabilizing [38]. These gain variations are taken into account by performing a gain calibration of each module every three minutes during data collection. This is done by exploiting the scintillation light produced by charged particles traversing the CF4 radiator. The scintillation signal is easily identified by the characteristic exponential shape of single electrons in the HBD pulse height distribution of low-multiplicity AuAu collisions [27]. Furthermore, the average cell charge per event was found to slowly decrease by 10%–15% over the 10 week duration of the run for some of the modules. This is attributed to a slow deterioration of the quantum efficiency of the photocathodes. This effect was noticed in 40% of the modules, the others did not show any sign of aging although all photocathodes were produced under identical procedures. An additional time dependent correction factor is applied to account for this effect.
In high multiplicity AuAu collisions, a large amount of scintillation light is produced by charged particles traversing the CF4 gas, resulting in a large detector occupancy. The number of photoelectrons per cell can be as high as 10 in the most central collisions. This underlying event background is subtracted on an event-by-event basis. For each event and for each module the average charge per unit area is calculated as:
| (1) |
where and are the cell charge and area, respectively. The summation is carried out over all the cells of a given module, excluding the cells that are matched to an electron track and their first neighbors. The cell charge used for further analysis , is then given by:
| (2) |
After subtraction of the underlying event charge, two independent algorithms are used for the HBD hit recognition. The first is a stand-alone algorithm in which a cluster is formed by a seed cell with 3 p.e. together with the fired cells (defined as 1 p.e.) among its first six neighbors. Such clusters can have up to seven cells. A central arm electron track projected onto the HBD readout plane is then matched to the closest cluster. This algorithm works very well in or peripheral AuAu collisions producing a typical single electron response with an average of 20 p.e.. In higher multiplicity events, this algorithm yields a higher charge per electron and a higher fraction of fake hits as it picks up more charge from the fluctuations of the underlying event background. Figure 5(a) shows an example of a seed cell and three of its first neighbors forming a four cell cluster.
The second algorithm uses the track projection point onto the HBD to form a cluster around it. The pointing resolution of a track to HBD is 3 mm at GeV/ which is much smaller than the size of a pad. The algorithm allows only up to three cells in a cluster, depending on the track projection position within the cell. If the track projection points to the middle part of the cell, only that cell is used, but if it points to the edge of a cell one or two additional neighboring cells are summed up in the cluster [39]. The same pattern of fired cells shown in Fig. 5(a) would result in a three cell cluster in the projection-based algorithm as illustrated in Fig. 5(b). The projection-based algorithm results in a more precise selection of the true hit, less fake hits and less pick up of charge from underlying event fluctuations.
This is especially important in the most central collisions. On the other hand, the limited cluster size truncates the charge information, resulting in a somewhat reduced efficiency and less power to discriminate between single and double hits. Therefore both algorithms are utilized in a complementary way, the stand alone providing a higher efficiency and better single to double hit separation and the projection-based providing a better rejection of fake hits.


II.5 Acceptance
II.5.1 Acceptance during 2010 run
As mentioned in Section II.2, the PHENIX central arm magnets were operated in the configuration during the 2010 run. Compared to the standard magnetic field configuration of PHENIX, the configuration has an increased acceptance for low tracks of about 20%.
Charged particles are bent in the azimuthal direction, , by the magnetic field. Because the DC and RICH are needed to reconstruct the tracks and select the electron candidates, the azimuthal electron acceptance depends on their charge and and on the radial location of each detector subsystem. We define the ideal track acceptance of the PHENIX detector in the field configuration by the following set of conditions:
| (3) | |||
| (4) | |||
| (5) |
for tracks originating at =0 with charge , transverse momentum and emission angles and . radGeV/ and radGeV/ are the effective azimuthal bends to the DC and the RICH, respectively. The polar angle boundaries of =1.23 rad and =1.92 rad are defined by the PHENIX central-arms pseudorapidity acceptance 0.35. One of the arms covers the azimuthal range from to and the other from to . The results shown in Section V, indicated as “in the PHENIX acceptance”, refer to the results filtered according to this parametrization of the ideal acceptance.
II.5.2 Fiducial cuts
Several fiducial cuts are applied to remove inactive areas of subsystems or areas with intermittent response, in order to homogenize the detector response over sizable fractions of the run time. Regarding the operation of the drift chamber, the entire 200 GeV AuAu data set is divided into five groups, with fiducial cuts applied to each group separately such that inside each group the drift chamber has a stable active area. The nonactive DC areas correspond to 19%–31% of the total DC acceptance, depending on the run group.
Fiducial cuts are also applied to the HBD to exclude tracks pointing to one inactive module out of the 20 modules of the HBD. Another fiducial cut removes conversion electrons originating from the HBD support structure, which are strongly localized in near the edges of the acceptance. Other fiducial cuts are applied to remove inactive or low efficiency areas in PC1 and EMCal.
In summary, the ideal PHENIX acceptance is reduced by the fiducial cuts by an amount that varies between 32% and 42%, depending on the run group, with an average of 36% for all selected runs.
III ANALYSIS
This section describes the basic steps of the AuAu data analysis. It is organized as follows. The data set and event selection cuts are presented in subsection III.1. Subsection III.2 describes the track reconstruction. The methods applied to identify electrons are presented in detail in subsection III.3 and the cuts applied to electron pairs are explained in subsection III.4. A detailed account of the various background sources and their subtraction is provided in subsection III.5. Next we present the raw spectra and corrections (subsection III.6) and discuss the systematic uncertainties (subsection III.7). In the final subsection III.8 we discuss a second independent analyses used as a cross check of the main analysis.
III.1 Data set and event selection
The AuAu collision data at GeV were collected during 2010. Collisions were triggered using the beam-beam counters, with the MB trigger condition (see subsection II.1).
The centrality is determined for each AuAu collision from the sum of the measured charge in both BBCs combined with a Glauber model of the collision [40] as described in Ref. [41]. In this analysis, the data sample is divided into five centrality classes: 0%–10%, 10%–20%, 20%–40%, 40%–60% and 60%–92%. The average number of participants and collisions together with their systematic uncertainties associated with each centrality bin are summarized in Table 2.
| Centrality | (syst) | (syst) | ||
|---|---|---|---|---|
| 0%–10% | 324.0 (5.7) | 951.1 (98.6) | ||
| 10%–20% | 231.0 (7.3) | 590.1 (61.1) | ||
| 20%–40% | 135.6 (7.0) | 282.4 (28.4) | ||
| 40%–60% | 56.0 (5.3) | 82.6 (9.3) | ||
| 60%–92% | 12.5 (2.6) | 12.1 (3.1) | ||
| 0%–92% | 106.3 (5.0) | 251.1 (26.7) |
The data were recorded with an online vertex selection of either 20 cm (narrow vertex) or 30 cm (wide vertex). The former selection was applied to the data recorded at the beginning of each store, when the luminosity was relatively high. For the latter selection, an additional-offline vertex cut of cm was applied. This asymmetric cut is needed to avoid the increased yield of conversion electrons originating from the side panels of the HBD. These cuts resulted in events with the narrow-vertex selection, events with the wide-vertex selection, and a total of MB events.
III.2 Track reconstruction
Charged particle tracks are reconstructed in the central arms using the DC and PC1 [32]. The procedure assumes that all tracks originate from the collision vertex. Each reconstructed track is then projected onto the other detectors, RICH, EMCal, TOF and HBD, and the projection points are associated to reconstructed hits in these detectors.
After a track is reconstructed, the initial momentum vector of the track at the vertex is calculated. The transverse momentum is determined by measuring the angle between the reconstructed particle trajectory and a line that connects the -vertex point to the particle trajectory at a reference radius R = 220 cm. The angle is approximately proportional to charge/. In the reverse field configuration used in the 2010 run, the momentum resolution is found to be 1.6% at = 0.5 GeV/.
III.3 Electron identification
III.3.1 Detectors and variables used for electron identification
For electron identification, the present analysis uses the HBD along with the central arm detectors RICH and EMCal and the time-of-flight information from the TOF-E detector and the EMCal. The relevant variables for electron identification from these detectors are:
-
n0: number of hit PMTs in the RICH in the expected range of a Čerenkov ring.
-
disp: distance between a track projection and its associated ring center in the RICH.
-
chi2/npe0: a -like shape variable of the RICH ring associated with the track per , the number of photoelectrons measured in the ring.
-
emcsdr: distance between the track projection point onto the EMCal and the associated EMCal cluster, measured in units of standard deviation of the momentum dependent matching distribution.
-
prob: probability that the EMCal cluster is of electromagnetic origin, based on the shower shape.
-
dep: variable quantifying the energy-momentum matching for electrons. It is defined as , where is the energy measured by the EMCal, is the track momentum and is the momentum-dependent standard deviation of the Gaussian-like distribution.
-
stof(PbSc) and stof(TOF-E): time-of-flight deviation from the one expected for electrons measured by either the EMCal-PbSc or the TOF-E detector, converted in units of standard deviation of the Gaussian-like time-of-flight distribution.
-
hbdcharge(P), hbdsize(P): cluster charge and size from the HBD projection-based algorithm.
-
hbdid: reduced cluster charge threshold from the projection-based algorithm. This is the threshold of the hbdcharge(P) variable, that has been tuned to reduce the number of the nongenuine HBD hits by a fixed factor. E.g. by requiring hbdid10, the number of the nongenuine HBD hits is reduced to 1/10 of the initial number. These thresholds are tuned depending on event multiplicity and HBD cluster size.
-
maxpadcharge(S): charge of the single pad with largest charge in the cluster of the stand-alone algorithm.
-
hbdcharge(S), hbdsize(S): cluster charge and size from the stand-alone algorithm.
First, electron candidates are selected from the total sample of tracks that contains mostly hadrons. This is accomplished by applying very loose cuts such as n0 0, which requires at least one fired PMT around the track projection in the RICH and 0.4 which rejects the tracks that strongly deviate from the expected of 1. The sample of electron candidates selected in such a way comprises the signal electrons, background electrons (mostly conversions from the HBD back plane), and a relatively large number of misidentified hadrons.
III.3.2 Exclusion of RICH photo-multipliers
The RICH detector in PHENIX uses spherical mirrors to project the Čerenkov light created by electrons in the radiator gas onto the PMT plane. As a consequence of this mirror geometry, parallel tracks after the field are projected to the same point in the PMT plane. In other words, if a hadron track is parallel to an electron track that produces a genuine response in the RICH, the hadron will appear to have the same response as the electron and thus it will be misidentified as an electron. Figure 6 shows a typical example of this ring sharing effect. In this example, an electron-positron pair is generated by a photon conversion in the HBD backplane. After the magnetic field, a hadron track is parallel to the positron track. Consequently, the hadron and the positron share the same photomultipliers in the RICH detector and the hadron is misidentified as an electron.
This ring sharing effect occurs because the RICH reconstruction algorithm allows multiple use of fired PMTs by different tracks. The ring sharing is a significant effect. In the 2010 run, the majority of electrons are generated by conversion in the HBD backplane. Although these conversions can successfully be rejected by the HBD, their response in the RICH remains and there is some probability that the misidentified hadron will also remain in the pool of electron candidates.
To reduce PMT sharing by different tracks in the RICH, the original RICH algorithm is modified. The PMTs fired by electrons that are clearly identified as background electrons, are removed, the ring reconstruction algorithm is re-applied and new n0, npe0, disp, variables are derived. These background electrons are mainly conversion electrons from the HBD backplane, electron tracks pointing outside the HBD acceptance, electrons produced by conversion on the HBD support structure or low electrons with 200 MeV/.
III.3.3 The neural networks
After the initial rejection of nonsignal electrons and the reduction of the ring sharing effect, the sample of electron candidates is still highly contaminated by background electrons and misidentified hadrons. A standard procedure to increase the purity of the electron sample would be to apply a sequence of one-dimensional cuts on all or some of the fourteen variables listed above. However, such a procedure results in a large efficiency loss that becomes significant in the pair analysis where the pair efficiency is approximately equal to the single track efficiency squared. In this analysis we implement instead a multivariate approach that is based on the neural network package TMultilayerPerceptron from root [42].
The neural network comprises three layers: the input layer, the hidden layer and the output layer. The input layer is composed of all the input variables normalized to have their values between 0 and 1. The hidden layer comprises a selected number of neurons and the output layer comprises a single output variable. The number of neurons in the hidden layer determines the ability of the neural network to distinguish between the signal and the background, but this ability saturates with increasing number of neurons. For each neural network, we make sure that the number of neurons is sufficiently large to provide the best possible performance, typically 10–15 neurons. In addition, we make sure that a sufficient number of tracks is selected for the training sample, such that the performance of the neural network does not depend on the training statistics.The neural network output is a single probability-like variable, in which values closer to 1 mostly correspond to signal, while values closer to 0 mostly correspond to background (examples of the neural network output distributions will be shown below). By selecting the tracks above a certain threshold, we can reject most of the background while keeping a large fraction of the signal.
We use three different neural networks specially trained on subsets of the large list of eID variables to reject (i) hadrons misidentified as electrons in the central arms (), (ii) background electrons which are mostly HBD backplane conversions () and (iii) double hits in the HBD (). In this way we basically have three handles to separately treat each type of background. The neural networks learn to distinguish the signal and the background on well defined samples. The first two neural networks, and , are trained on hijing events. The third neural network is trained on a sample of single particle event simulations, decays for single response and Dalitz decays for double response. The training is done separately for each centrality bin in order to properly treat the multiplicity effects. For centralities 40%, we use the neural network trained for the 20%–40% centrality bin, where the statistics of the training sample is higher. This is justified because already in the 20%–40% centrality bin, multiplicity effects are unimportant and the separation between signal and background is good. The training is also done separately for the three cases of time-of-flight information (TOF-E, PbSc-TOF, no time-of-flight information).
The simulated events are passed through a geant simulation of the PHENIX detector and through the same reconstruction code that is used for the data analysis. They are divided into two samples. One is used for training purposes and the other one to monitor the neural network output. The simulated events are not used to determine absolute efficiencies (those are determined from simulation as discussed later in Section III.6. They are used only for training and monitoring purposes and the hijing events are particularly valuable in this respect. They allow us to assess the origin and relative magnitude of the various background sources at each step of the electron identification chain, as well as the neural network performance in its ability to reject the background while preserving the signal. Details of the three neural networks are given below.
III.3.4 Hadron rejection
The first neural network, , aims at reducing the hadron contamination. It exploits the information from all the relevant detectors, HBD, RICH, EMCal and TOF-E. The signal (S) for the training of comprises electron tracks originating at the collision vertex, whereas the background (B) comprises all the remaining misidentified hadron tracks in the sample.
Figure 7 shows the output values of for the hijing monitoring sample (red line) and also shows the output of applied on real data (black line). The truth information from the hijing events in terms of signal and background is shown separately. It should be noted that in the hijing monitoring sample, all electron tracks are considered. The signal comprises the genuine electrons excluding the HBD backplane conversions and the background is all remaining tracks.
III.3.5 Background electron rejection
After rejecting hadrons in the previous step, the dominant background in the electron sample comes from the conversions in the HBD backplane that were not rejected by the conservative process described in III.3.2. Because these conversions do not leave a signal in the HBD they can be recognized and rejected if the tracks do not have a matching HBD response. The rejection capability is however limited by fluctuations remaining after the underlying event subtraction in the HBD. To provide the optimal rejection of the remaining backplane conversions we use a neural network, , which is based on the HBD information reconstructed by both the stand-alone and the projection-based algorithms. The signal tracks for the training of comprise all signal electrons remaining after the previous step, while the background sample includes only the electrons originating from the HBD backplane.
Figure 8 shows the distribution of output values of applied to the hijing monitoring sample (red line) and to data (black line). The signal and background components of the hijing simulation are shown separately.
III.3.6 Double-hit rejection in the HBD
After removing hadrons and backplane conversions as much as possible, the major sources of background are the beam-pipe and radiator conversions and electrons from Dalitz decays where only one track is reconstructed in the central arms. These electrons have a zero or very small opening angle and most of them lead to a double hit in the HBD. Double hits can be recognized using the HBD response reconstructed in parallel by both the stand-alone and the projection-based algorithms. The response is coupled in a neural network, separately optimized for different HBD cluster sizes as well as centrality classes. The cut is an implicit small opening angle cut given by the maximum cluster size which is of the order of 75 mrad.
Figure 9 shows the distribution of the output variable of the neural network for the separation of single and double hits in the HBD. The single response is provided by electrons from simulated decays and the double response by electrons from Dalitz decays. The simulations are embedded into real HBD background events in order to take into account centrality dependent occupancy effects.
III.3.7 Cut optimization
The final selection of cuts on each neural network output variable is optimized using hijing events. The thresholds are varied separately to maximize the effective signal, . Because the statistics of the hijing samples are by far insufficient for a pair analysis, for the signal we use the number of single electrons from charm decay per event, which is an easily identified signal in hijing, and for the background we use the total number of electrons per event. The cut optimization is done separately for each centrality class, for two ranges ( 300 MeV/ and 300 MeV/), for each cluster size, and for each TOF configuration. The effective signal for each setup is maximized subject to the following conditions:
- •
The three types of TOF configuration (with PbSc timing information, with TOF-east timing information and without any timing information), have similar efficiencies with differences of less than 15%.
- •
Hadron contamination less than 5% for TOF-E and PbSc-TOF and less than 10% for the no-TOF case.
The arrows in Figs. 7-9 represent the average final cuts selected by the cut optimization procedure for these particular cases. The final cuts produce an electron sample with small hadron contamination, of less than 5%, for all centralities. Strong cuts on the HBD are needed to achieve this small hadron contamination, resulting in a single electron efficiency of 25%–40% depending on centrality, at 0.5 GeV/ (See Section III.6).
III.4 Pair cuts
The track selection criteria described above provide an electron sample with high purity. However, besides these criteria which are applied on a track-by-track basis, this analysis implements a series of dielectron cuts, based on the pair properties. These cuts are needed in order to remove ghost pairs i.e. pairs correlated by the close proximity of tracks in one of the detectors. Such correlations cannot be described by the mixed background, by definition, therefore this part of the phase-space must be removed from both the foreground and the mixed background. In the present analysis we remove the whole event, if such a pair is found, as was done in Ref. [23]. This procedure removes only 2% more of the total pair yield than discarding the pairs, because the average pair multiplicity is relatively low.
The most prominent detector correlation comes from the ring sharing effect in the RICH detector, discussed in Section III.3.2, which arises when two tracks are parallel after the magnetic field, with at least one of them being an electron.
As mentioned above, the detector-correlated pairs are identified by applying a cut on the physical proximity of the tracks forming a pair in every detector and the cut value is determined by the corresponding double hit resolution. In the RICH detector, the cut selects pairs whose rings are closer than 36 cm, which is twice the diameter of the RICH ring (16.8 cm). In the EMCal, the cut removes a region of towers around the hit. In PC1 the pairs are selected for removal if their tracks are within 5 cm in or 0.02 rad in .
The effect of these three pair cuts on the like-sign and unlike-sign mass spectra is shown in Fig. 10. The like-sign yield close to GeV/ is affected by all cuts. On the other hand, in the unlike-sign foreground spectrum, the cuts affect well localized regions producing two clearly visible dips. The dip at GeV/ is created by the RICH pair cut and the dip at GeV/ is created by the PC1 pair cut. The EMCal pair cut removes yield around 0.20 GeV/, but the effect is small compared to the other two cuts.
In addition to the RICH, EMCal and DC/PC1 ghost cuts, a 100 mrad opening angle cut is applied to remove ghost pairs in the HBD. This is a proximity cut that translates to a distance of two cells in the pad readout and roughly corresponds to the double hit separation of the HBD. This cut affects the yield at GeV/ in both the like-sign and unlike-sign mass spectra.
III.5 Background Pair Subtraction
Because the origin of the electron track candidates is not known, all electrons and positrons in the same event are paired to form the unlike-sign () and like-sign ( and ) foreground mass spectra. This gives rise to a large combinatorial background that increases quadratically with the event multiplicity. In addition to that, there are several background sources of correlated pairs. The evaluation and subtraction of the background is the crucial step in the analysis of dileptons in particular in situations, like the present one, where the is at the sub-percent level. In this section, we describe in detail the various sources contributing to the background and the methodology used to evaluate each of them.
III.5.1 Background sources
The unlike-sign foreground spectrum contains, in addition to the physical signal (), a large background comprising the following sources:
- •
Uncorrelated combinatorial background (): It arises from the random combinations of electrons and positrons originating from different parent particles and is an inherent consequence of pairing all electrons with all positrons in the same event. The combinatorial background accounts for most of the total background, more than 99% in the most central collisions and more than 90% in peripheral collisions. The two electron tracks of combinatorial pairs are uncorrelated. However, they carry a global modulation induced by the collective flow of each individual collision. The evaluation of the combinatorial background together with the flow modulation is described in detail in the following subsection. (See Section III.5.2.)
- •
Correlated background pairs. There are three different sources of correlated background pairs:
- –
Cross pairs (): A cross pair can be produced when there are two pairs in the final state of a single meson decay. One such case is . The pair formed by an electron directly from and a positron from conversion does not come from the same parent particle but it is a correlated pair through the same primary particle. (See Section III.5.3.)
- –
Jet pairs (): The jet pairs are produced by two electrons generated in the same jet or in back-to-back jets. (See Section III.5.4.)
- –
Electron-hadron pairs (): Whereas the previous two sources of correlated pairs are of physics origin, the electron-hadron pairs are an artifact that results from residual detector correlations that cannot be handled by the pair cuts. (See Section III.5.5.)
- –
One can then write:
| (6) |
All the background sources listed above form the yield of the like-sign foreground mass spectra and . There is no signal in these spectra with the exception of a very small contribution of and pairs from decays (). So one can write:
| (7) |
| (8) |
Usually the like-sign pairs are subtracted from the unlike-sign pairs to obtain the signal. This is a convenient approach in a detector with 2 azimuthal coverage, which ensures that the uncorrelated background is charge symmetric, under the assumption that the correlated background is also charge symmetric, i.e. it produces the same yield and mass distribution of like and unlike pairs. These conditions are not met in the present situation. The two central arm configuration of the PHENIX detector results in a substantial acceptance difference between like and unlike-sign pairs. Furthermore, the like-sign pairs contain a small signal component from decays that needs to be calculated separately. Finally, as shown below, the electron-hadron pairs are not charge symmetric. For these reasons, in this analysis we adopt a different approach in which each source is evaluated separately for a quantitative understanding of the like-sign yield. Once this is demonstrated, the background sources, and are subtracted from the inclusive foreground unlike-sign spectrum in order to obtain the mass spectrum of the signal pairs. The following subsections outline the evaluation of the various background sources.
The contribution which is part of the signal is needed only for the quantitative evaluation of the like-sign spectra. The contribution is calculated using mc@nlo (See Section IV for details), which generates both like-sign and unlike-sign contributions from . The small like-sign contribution from is neglected.
III.5.2 Combinatorial background (CB)
The combinatorial background is determined using the event mixing technique, in which tracks from different events but with similar characteristics are combined into pairs. In this analysis, all events are classified into 11 bins in vertex between 30 cm and +25 cm, and 10 bins in centrality between 0% and 92%.
In principle, the event mixing technique is expected to reproduce the shape of the combinatorial background with great statistical accuracy, because one can mix as many events as needed to reduce the statistical uncertainty to a negligible level. In fact it does not reproduce the shape. There is a small difference between the foreground combinatorial background and the mixed event background. The former is affected by the elliptic flow which is intrinsic to heavy ion collisions, whereas the latter is obtained by randomly picking up two tracks from different events and thus on the average does not have any flow effect.
To take into account the effect of flow in the mixed-events, one could make reaction plane bins, in addition to the vertex and centrality bins, so that only events with similar reaction plane are mixed. However, the method is limited by the reaction plane resolution and in PHENIX, the latter is not sufficient to reproduce the shape of the foreground combinatorial background. Instead, in the present analysis, a weighting method, based on an analytical calculation of the flow modulation, is used to account for the flow effects in the mixed events.
If particles are generated according to the following distribution function:
| (9) |
where is the particle emission angle in azimuth, is the reaction plane angle and is the elliptic flow coefficient, then random pairs formed from these particles are distributed as (See Appendix A for the derivation):
| (10) |
where is the azimuthal emission angle and the elliptic flow of the two particles forming the pair.
In the weighting method, each mixed background pair is weighted by Eq. (10). The values of inclusive electrons are determined from the present data prior to the pair analysis as a function of centrality and electron using the reaction plane method [43]. Exactly the same cuts as in the data analysis are used in the calculation. The obtained values are in very good agreement with the inclusive electron values reported in Ref. [44].
We use a Monte-Carlo (MC) simulation to evaluate the method. The simulation generates electrons and positrons following a Poisson distribution with a mean value of three 11 1 There is not much meaning to the mean value of 3 of the Poisson distribution. It is a convenient choice to have one pair per event with a high probability.. The particles are uniformly distributed in pseudorapidity between 0.35 and their momentum distribution is taken from data. The azimuthal emission angle is determined according to the distribution , where is the reaction plane angle, which is uniformly distributed between . The values are taken from the 20%–40% centrality bin. The tracks that pass the PHENIX acceptance filter are used in the pair analysis.
Figure 11 shows the ratio of the foreground to mixed background mass spectra. The squares correspond to the simple mixed-event technique without correcting for flow. We can see that in this approach the ratio is not flat, i.e. the foreground shape is not reproduced by the mixed background shape. The circles correspond to the weighting method. The ratio is completely flat over the entire mass range demonstrating that the weighting method properly accounts for the flow modulation.
A similar MC study was performed to evaluate whether triangular flow also induces shape distortion of the mass spectrum. For the most central collisions, where is comparable to at high [45], the simulations show that the effect is at least one order of magnitude smaller than for and we thus ignore triangular flow in the determination of the combinatorial background shape.
III.5.3 Cross pairs (CP)
Cross pairs can be produced when a hadron decay produces two pairs in the final state. The following hadron decays and subsequent photon conversions lead to cross pairs:
| (11) |
| (12) |
| (13) |
| (14) |
The cross combinations give rise to two unlike-sign pairs ( and ) as well as two like-sign pairs ( and ) that are not purely combinatorial, but correlated via the or mass and momentum. Therefore, this contribution is not reproduced by the event-mixing technique.
To calculate the cross pairs, we use EXODUS (see Section IV) to generate and with the following input parameters:
- •
Flat-vertex distribution within cm. The final results are weighted to restore the measured vertex distribution.
- •
Flat pseudorapidity distribution within and uniform in within .
- •
Momentum distributions based on PHENIX measurements (see Section IV).
The generated and are passed through a geant simulation of the PHENIX detector. By selecting reconstructed cross pairs, one can determine the shape of the cross-pair invariant mass spectrum. The spectra are then absolutely normalized using the rapidity density values / and / as a function of centrality, summarized in Section IV. The absolutely normalized mass spectra of cross pairs for the 0%–10% centrality bin are shown in Fig. 12.
III.5.4 Jet pairs (JP)
The jet pairs are produced using the pythia 6.319 code with cteq5l parton distribution functions [46]. The following hard quantum-chromodynamics (QCD) processes are activated [23]:
- •
MSUB 11:
- •
MSUB 12:
- •
MSUB 13:
- •
MSUB 28:
- •
MSUB 53:
- •
MSUB 68:
where denotes a gluon, are fermions with flavor , , and are the corresponding antiparticles. A Gaussian width of 1.5 GeV/ for the primordial distribution (MSTP(91)=1, PARP(91)=1.5) and 1.0 for the K-factor (MSTP(33)=1, PARP(31)=1.0) are used. The minimum parton is set to 2 GeV/ (CKIN(3)=2.0). The coordinate of the vertex position is produced uniformly between 30 cm and then weighted to reproduce the measured distribution. From the pythia output, and are extracted and passed through the geant simulator of PHENIX in order to generate the inclusive pairs.
In addition to the jet pairs we are interested in, the foreground pairs from pythia events contain also “physical” pairs, cross pairs and combinatorial pairs. The “physical” pairs and cross pairs are excluded from the foreground pairs by requiring that the two electrons or positrons of the pair do not share the same particle in their history. The combinatorial background is statistically subtracted using the event-mixing technique. The mixed event like-sign pairs are normalized to the foreground like-sign pairs in the range , where is the difference in the azimuthal angle of the primary particles, or . Figure 13 shows the distributions of the foreground pairs and the normalized mixed-event pairs. The excess yield around represents the dileptons from the same jet whereas the excess yield at corresponds to the dileptons from opposite or back-to-back jets.
After subtracting the combinatorial background, the pythia spectra are scaled to give the pion yield per MB event . The scaling factor is determined such that the yield in the pythia simulation matches the measured yield in collisions [47] and found to be 1/3.9.
The spectra need to be further scaled to obtain the jet contribution in AuAu collisions for each centrality bin. This scaling is done following Ref. [48]: an jet pair originating from primary particles with momenta and is scaled by the average number of binary collisions for each centrality bin, times , times . The same jet or opposite jet values are applied depending on the pair opening angle. The absolutely normalized jet pair spectra for the 0%–10% centrality bin are shown in Fig. 14.
III.5.5 Electron-hadron pairs (EH)
Even after applying the pair cuts described in Section III.4, electron-hadron pairs correlated through detector effects remain in the foreground pairs. An example of such an electron-hadron pair can be illustrated with the sketch of Figure 6 discussed in Section III.3.2. In this example, if both the positron and the mis-identified hadron are detected, the pair is identified as a RICH ghost pair and the entire event is rejected by the RICH ghost pair cut as described in Section III.4. However, if the positron is not detected due to detector dead areas or reconstruction inefficiency, the pair formed by the electron and the mis-identified hadron is not rejected and remains in the sample. This pair is not a combinatorial pair but correlated through the positron. Although the mis-identification of hadrons via hit sharing occurs in all detectors, the RICH detector is the dominant contributor to these electron-hadron pairs. Therefore, only the RICH detector is considered as the source of such correlated pairs.
We simulate electron-hadron pairs using electrons from and simulations and hadrons from real events. The and simulations are the same ones that are used for the cross pair simulation. The hadrons from real events are all the reconstructed tracks that fail the eID cuts.
The simulation is performed in the following way: First, a combined event is formed using electrons from one Dalitz decay of or generated with exodus and hadrons from a real event. Second, the information from their associated fired PMTs is merged and new rings are reconstructed. Using the new RICH ring variables, the regular analysis procedure, including eID cuts and pair cuts, is performed on the combined event. Finally, the pairs formed by the combination of an electron track from simulation and a hadron track from data are extracted. The spectra are absolutely normalized using the / values shown in Section IV. The absolutely normalized electron-hadron pair spectra for the 0%–10% centrality bin are shown in Fig. 15. Contrary to the cross pairs and the jet pairs where the like- and unlike-sign spectra have a very similar shape, the electron-hadron pairs exhibit a sizable difference between the like- and unlike-sign spectra. The yield of electron-hadron pairs has a strong centrality dependence. It increases by a factor of 50 from peripheral to central collisions with respect to the rapidity density. This increase is mainly due to the expected scaling of the electron-hadron pairs with the square of the event multiplicity.
III.5.6 Background normalization
The cross pairs, jet pairs, electron-hadron pairs and decay pairs are absolutely normalized. The mixed event technique provides only the shape of the combinatorial background. It needs to be normalized in order to be able to subtract the background and extract the signal. The only free parameters of the entire procedure are thus the normalization factors of the mixed event background like-sign spectra and . They are determined by normalizing the mixed event background yield () to the foreground yield (), integrated over a selected region of phase space, after subtracting the correlated pairs integrated over the same region:
where , , and are the integral yields of each source in the normalization region. The normalization region is a window in the azimuthal angular distance of the two tracks . It needs to satisfy two competing conditions. On the one hand, a small normalization window containing only combinatorial pairs is preferred to avoid being affected by any residual yield (and systematic uncertainties) from the correlated background sources. On the other hand, a wide normalization window is required to reduce statistical uncertainty. The normalization windows used in this analysis for each centrality bin are shown in Table 3 together with the corresponding number of like-sign pairs (). The region of small opening angles that correspond to small masses where the correlated pairs , and mostly contribute, is excluded in all centrality bins.
| Centrality | Normalization window | |||
|---|---|---|---|---|
| 0%–10% | 0.7 - 3.14 | 5.1M | ||
| 10%–20% | 0.7 - 2.1 | 1.1M | ||
| 20%–40% | 0.7 - 2.1 | 660K | ||
| 40%–60% | 0.9 - 2.1 | 48K | ||
| 60%–92% | 0.9 - 2.1 | 3K |
The combinatorial background in Eqs. (7) and (8) is thus given by the normalized mixed-event background:
| (15) | |||
| (16) |
As long as electrons and positrons are produced in pairs and these pairs are uncorrelated, the total unlike-sign combinatorial background yield is the geometric mean of the total like-sign combinatorial yield, independent of single electron efficiency and acceptance [23]:
| (17) |
A similar relation holds true for the integral yields of the mixed-event background:
| (18) |
The normalization factor of the unlike-sign mixed event background is thus deduced from the normalization factors of the like-sign mixed background, and as:
| (19) |
In the present analysis, the square root relation, Eq. (17), is violated by two independent factors. First, the relation does not hold true when pair cuts are applied to the spectra because pair cuts affect differently the unlike-sign and like-sign spectra. Second, elliptic flow induces an inherent distortion of the square root relation. Flow does not create or destroy particles. It only affects their azimuthal distribution and therefore in a perfect 2 detector there is no effect and Eq. (17) is obeyed. However, in the case of the PHENIX detector, which is not a 2 detector, the relation is violated as demonstrated in Appendix B. Relation (19) can still be used provided that the violation is the same in the data and the mixed events. In the present analysis, we make sure that this is the case. We start from a situation in which the mixed events satisfy Eq. (18). We then apply to the mixed events the pair cuts, exactly as to the foreground events, and the flow modulation using a weighting factor procedure that is based on an exact analytical calculation. Thus we make sure that Eq. (19) is still valid.
III.5.7 Quantitative understanding of the background
To illustrate our understanding of the background in quantitative terms, Fig. 16 shows a comparison of the MB mass spectra for the foreground and the calculated background like-sign pairs.
The top panel shows the foreground like-sign mass spectrum (open circles) together with the various background components discussed above (the normalized combinatorial background, and the absolutely calculated cross pairs, jet pairs and - pairs) and the pairs calculated as described in Section IV. The bottom panel shows the ratio of the foreground like-sign spectrum to the sum of all the background components. Similar comparisons for the five centrality bins used in this analysis are shown in Fig. 17.
In general the background is well reproduced both in shape and magnitude. In particular, for the most central bins, the background is reproduced with sub-percent accuracy. There are, however, a couple of regions where the ratio foreground/background is different from one. There is a deviation of the order of a few percent at masses 100 MeV/. This is clearly visible in the three most central bins. A number of factors could be responsible for this deviation, such as scale errors in the cross pairs or the jet pairs. However, in this mass region the signal to background ratio is relatively good as shown in Fig. 18 and a deviation of the order of a few percent in the background is negligible. There also seems to be a deviation at 1 GeV/ for the 10%–20% and 20%–40% centrality bins. This deviation could indicate underestimations of the flow or the back-to-back jet contributions, due to the precision in these measurements, or the existence of an additional correlation that is not taken into account in any of the calculated background components. To be conservative, this deviation is considered as evidence of unsubtracted background and its magnitude is assigned as a mass dependent systematic uncertainty of the signal.
Figure 18 shows the MB mass spectra of the foreground unlike sign events (FG+-), the calculated total background (BG+-) and the raw signal obtained by their subtraction. The signal to background ratio is shown in the bottom panel. This result will be discussed in reference to previously published PHENIX results in Section V.3.1.
III.6 Raw Spectra and Efficiency Corrections
Figure 19 shows the raw mass spectra, obtained after subtracting the pair background, for the five centrality bins of this analysis.
To obtain the invariant mass spectrum inside the ideal PHENIX acceptance, the raw mass yield is corrected for reconstruction efficiency effects according to:
| (20) |
where is the number of events, is the number of pairs with invariant mass and is the mass bin width. is the total pair reconstruction efficiency that includes the eID efficiency of the neural networks, losses incurred by dead or inactive areas in the detector, pair cut losses and detector occupancy effects. The total pair reconstruction efficiency can thus be written as:
| (21) |
where is the pair reconstruction efficiency including the efficiency of all the electron identification cuts and the HBD double-hit rejection cut, is the pair efficiency from the detector active area with respect to the ideal PHENIX detector acceptance, reflects the efficiency loss due to the pair cuts that remove ghost pairs in the various detectors (see Section III.4) and is the multiplicity dependent efficiency loss discussed below in this subsection.
The single electron reconstruction efficiency, defined as = is shown in Fig. 20 vs for the five centrality bins. This efficiency is not actually used in the analysis. It is shown here for illustration purposes. The change of efficiency below 0.3 GeV/ arises from the cut optimization in two ranges (see Section III.3.7).
The product is determined as follows. A cocktail of all the known hadronic sources contributing to the pair spectrum is generated within 0.6 and 2 in azimuthal angle. Details about the various sources of the cocktail are given in Section IV. The cocktail is passed through a full geant simulation of the PHENIX detector [49] and analyzed in the same way as the data, including eID cuts, fiducial cuts and pair cuts. The resulting output is referred to as the reconstructed cocktail. The ratio of this reconstructed cocktail to the generated cocktail filtered through the ideal PHENIX acceptance (but without momentum smearing), gives the product . This correction is derived in the two dimensional space of mass-pair .
Special care is taken to tune the simulations to the data to ensure that the detector response in the simulations is the same as in real data for all the subsystems involved in the analysis. As an example, Fig. 21 shows a comparison of a few electron identification variables in data and simulations. For this comparison we use a clean sample of electrons provided by fully reconstructed Dalitz decays with an opening angle larger than 100 mrad from the 60%–92% centrality bin where the occupancy effects are very small and can be ignored. The eID variables of the two tracks from these pairs are compared to those of simulations.
The HBD occupancy effects are taken into account by embedding the HBD hits from the cocktail simulation into real HBD events, and thus are included in the product . There are two other occupancy effects in the central arms that need to be taken into account and are included in Eq. (21) by the additional multiplicative factor . The first one is the decrease of track reconstruction efficiency as the detector occupancy increases with centrality. This loss is referred to as and is determined by an embedding procedure. Electrons from decays that are reconstructed in single particle simulations, are embedded into real AuAu events. Then the embedded events are run through the full reconstruction software chain and analyzed in exactly the same way as the data. The embedding efficiency for single tracks is determined as the ratio of the number of reconstructed electron tracks from embedded data to the number of embedded tracks. The pair embedding efficiency is calculated as the square of the single track embedding efficiency, .
The second occupancy effect comes from the initial rejection of background electrons, discussed in Section III.3.2, where PMTs fired by background electron tracks are removed. If such an electron is close to a signal electron in the RICH, the associated PMTs of the signal electron are also removed. The probability for this to happen is relatively small and increases with multiplicity. This loss is referred to as and it is estimated by monitoring the yield of pairs below 20 before and after erasing the PMTs for each centrality bin. This mass region is dominated by Dalitz decays and conversions and provides a clean electron pair sample with a signal-to-background ratio of 200 even for the most central events. Using these efficiency losses, can be expressed as:
| (22) |
Table 4 summarizes the values of and for the five centrality bins.
| Centrality | |||||
|---|---|---|---|---|---|
| 0%–10% | 10%–20% | 20%–40% | 40%–60% | 60%–92% | |
| 0.53 | 0.65 | 0.76 | 0.86 | 0.95 | |
| 0.88 | 0.92 | 0.94 | 0.98 | 1.00 |
Figure 22 shows the total pair reconstruction efficiency for pair within 0.8-1.0 GeV/ for each centrality bin.
III.7 Systematic Uncertainties
The main systematic uncertainties on the corrected data arise from uncertainties on the electron identification, the acceptance and the background subtraction. They are discussed in detail below and summarized in Table 5. These uncertainties move all data points in the same direction but not by the same factor
| Component | Mass range | Systematic uncertainty | ||
|---|---|---|---|---|
| eID + occupancy effects | 4% | |||
| Acceptance (time) | 8% | |||
| Acceptance (MC) | 4% | |||
| Combinatorial background | 0–5 GeV/ | 25% ( GeV/) | ||
| Residual yield | 0–0.08 GeV/ | 5% ( GeV/) | ||
| Residual yield | 1–5 GeV/ | 15% ( GeV/) |
III.7.1 Systematic uncertainty on electron identification and occupancy effects
As described in Section III.3, electron identification is achieved using three neural networks. Different threshold cuts for the neural networks result in different electron identification efficiency and occupancy effects. The thresholds in the neural networks are varied by 20% around the selected values and the variations of the electron pair yield in the mass region 150 MeV/, after applying the efficiency correction, are used to assess the systematic uncertainty of electron identification and occupancy effects.
By changing the thresholds by 20% the raw electron pair yield changes by about 50%. However, once the corresponding efficiency corrections are applied, the variations are below 4% for all the centrality bins. Based on these results, we assign a 4% systematic uncertainty on the electron identification.
III.7.2 Systematic uncertainty on the acceptance
We consider two sources of systematic uncertainties on the acceptance: variations of the pair acceptance vs time and variations of the pair acceptance between data and MC simulations.
The pair acceptance systematic uncertainty vs time is studied by considering the variations of the number of electron pairs per event for each run group. The weighted average of the of the number of electrons per event in the five run groups is found to be 8% and it is taken as the systematic uncertainty of the acceptance variation over time.
The systematic uncertainty on the data vs MC pair acceptance is studied by comparing the reconstructed yield in data and simulations. In data we select reconstructed pairs with 100 MeV/, after subtracting the combinatorial and correlated components of the background, using data from one of the run groups. In the MC simulations we use reconstructed pairs in the same mass range from Dalitz decays applying the fiducial cuts for the corresponding run group. The entire detector is divided into four sectors. Data and MC simulations are normalized in one sector. The variations of the yield ratios between data and MC simulations in the other sectors ranges between 1% and 8%. The weighted average of these variations is found to be 4% and it is taken as the systematic uncertainty of the acceptance agreement between data and MC simulations.
III.7.3 Systematic uncertainty on the background subtraction
We consider two sources of systematic uncertainties on the background subtraction:
(i) Uncertainty on the combinatorial background subtraction. It is primarily due to the uncertainty in the normalization factor, and the latter is determined by the statistics in the normalization window, namely by 1/ (see Section III.5.6). This translates into a relative uncertainty of the signal . The ratio depends both on mass and centrality. In Table 5 we quote the uncertainty at = 0.6 GeV/ which represents the worst case in mass, for MB events. The centrality dependence results in variations of the order of 15% from the MB values.
(ii) In the ideal case, the like-sign residual yield, i.e. the like-sign yield after subtracting all the background sources, should be zero. In practice it is not. As shown in Figs. 16 and 17, there is a small residual yield. In this analysis, we assume that any residual yield is entirely due to unsubtracted background, and we take it as an additional source of systematic uncertainty, after transforming it into unlike-sign residual yield via the acceptance correction factor . This uncertainty takes into account any possible discrepancy in shape or magnitude of the various subtracted sources of background. The factor accounts for the different acceptance of the PHENIX detector for like and unlike sign pairs. It is calculated as a function of pair mass and pair using the mixed event background as:
| (23) |
Figure 23 panels (a)–(e) show times the like-sign residual yield divided by the sum of all unlike-sign background sources as a function of mass for the five centrality bins, which represent the relative residual background yield in the unlike sign mass spectrum. The mass regions GeV/, 0.2 GeV/ GeV/ and GeV/ are fitted to a constant to quantify the magnitude of the residual unlike-sign yield. The fit results are also shown. Figure 23 panels (f)–(j) show zoomed views in the vertical axis for the 0.2–1 GeV/ mass range. The fits in the mass region –1.0 GeV/ give results that are consistent with zero for all centrality bins. For the other two mass ranges, the residual yields are considered as sources of systematic uncertainties if their significance is larger than 2.
The total systematic uncertainty in the background subtraction is obtained as the quadratic sum of the systematic uncertainties due to the combinatorial background subtraction and the residual yield. Both contributions are listed in Table 5 for MB collisions. It is worth noting that the systematic uncertainty of the background subtraction is much lower than the required accuracy to measure a signal with the values shown in Section III.5.7.
III.8 Cross checks
A second independent analysis was performed as a cross check. The key features of the second analysis are discussed here. A more detailed description is given in Appendix C. The second analysis is similar to the analysis described in Ref. [23], but it makes use of the HBD and includes all the important improvements developed in this work. In particular, it makes use of the time-of-flight information for better hadron rejection, implements the shape distortion of the mixed event background due to elliptic flow (Section III.5.2), subtracts the correlated electron-hadron background (Section III.5.5), and explicitly considers the away-side jet-pair component in the background subtraction (Section III.5.4).
Important elements of the independent analysis are different from those of the main analysis. The most significant differences are: (i) The HBD underlying event subtraction is done using the average charge in the vicinity of a track as opposed to the average charge in a module as used in the main analysis. (ii) Electron identification is achieved by a sequence of independent one-dimensional cuts on each of the electron identification variables instead of the neural network approach. (iii) The normalization of each background source is determined from a fit to the like-sign spectra, in contrast to the main analysis where all the correlated background sources are absolutely normalized and only the combinatorial background is normalized to the like sign spectra.
The second analysis results in a factor of two smaller signal-to-background ratio and a 10% reduction in purity of the electron sample in central collisions. However, once corrected for efficiency, the results of the second analysis are consistent within uncertainties with those obtained with the main analysis described in this section.
IV COCKTAIL OF HADRONIC SOURCES
In this section we describe the procedures used to calculate the expected dielectron yield from hadronic decays, commonly referred to as the hadronic cocktail, that will be compared to the experimental results in Section V. The known sources are calculated using the exodus, pythia and mc@nlo event generators. exodus is a phenomenological generator that simulates phase space distributions of the relevant electron sources and their decays [50]. It generates the photonic sources, i.e. Dalitz decays of light neutral mesons: , , and and the nonphotonic sources, i.e. dielectron decays of mesons: , , , . pythia [46] and mc@nlo [51, 52] are used to generate the correlated pairs from semi-leptonic decays of heavy flavor (charm and bottom) mesons. The hadrons are assumed to have uniform pseudorapidity density within 0.35 and uniform azimuthal distribution in 2. Once generated, the sources are filtered through the ideal acceptance of the PHENIX detector and smeared with the detector resolution for comparison to the measured invariant mass spectrum.
IV.1 Neutral pions
The dominant electron source as well as the fundamental input for exodus is . The shape of the distribution is parameterized as:
| (24) |
The parameters, , , and , are obtained by a simultaneous fit of the PHENIX published results for [53, 54] and charged pions [55]. The resulting fit parameters are shown in Table 6 for the five centrality bins of this analysis. The absolute magnitude of the rapidity density, , is obtained by fitting the cocktail to the data (see Section IV.4).
| Parameter | 0%–10% | 10%–20% | 20%–40% | 40%–60% | 60%–92% | ||
|---|---|---|---|---|---|---|---|
| [(GeV/)-1] | 0.57 | 0.53 | 0.43 | 0.36 | 0.33 | ||
| [(GeV/)-2] | 0.19 | 0.16 | 0.11 | 0.13 | 0.088 | ||
| [GeV/] | 0.74 | 0.75 | 0.79 | 0.76 | 0.74 | ||
| 8.4 | 8.3 | 8.5 | 8.4 | 8.4 |
IV.2 Other mesons
The distributions of other light mesons are based on the parametrization of the pion spectrum assuming scaling [23], i.e. Eq. (24) is used with replaced by . This assumption reproduces well the measured light meson distributions in AuAu collisions as demonstrated in [23]. The absolute normalization for each meson is provided by the ratio of the meson to invariant yield at high ( 5 GeV/). We use the values from Ref. [44], summarized in Table 7.
| / | / | / | / | / | ||
|---|---|---|---|---|---|---|
| 0.48 | 1.0 | 0.90 | 0.25 | 0.40 |
The values were obtained from collisions and are taken to be valid for AuAu collisions because at high the suppression of all mesons is found to be very similar to the suppression and consequently the meson/ ratios in AuAu collisions remain unchanged with respect to the ratios in collisions [56, 57, 58].
For the distribution of the we use the neutral pion spectrum measured in collisions [47], assuming scaling. Detector effects on the line shape are taken into account by passing the decay through a geant simulation of the PHENIX detector. The resulting integrated invariant mass distribution is then normalized to the measured cross section in collisions [23] and scaled to AuAu collisions by the corresponding and the measured for each centrality bin [59].
IV.3 Open heavy flavor
The correlated yield from open heavy flavor decays is simulated using two different event generators, pythia and mc@nlo, and measured and production cross sections.
pythia simulations are used to calculate gluon fusion, the dominant process for heavy-quark production, in leading-order perturbative QCD. Specifically, we use pythia-6 [60] 22 2 We use pythia-6 [60] with the following parameters MSEL[]=4 or MSEL[]=5, MSTP(91)=1, PARP(91)=1.5, MSTP(33)=1, PARP(31)=1.0, MSTP(32)=4, PMAS(4)=1.25, PMAS(5)=4.1. and cteq5l as input parton distribution functions. The mc@nlo package (vers. 4.03) [51, 52] is a next-to-leading order simulation that generates hard scattering events. These events are subsequently fed to herwig (vers. 6.520) [61] for fragmentation in vacuum.
We use the - and -production cross sections measured by PHENIX [62], by fitting the event generator (pythia or mc@nlo) output to the measured dielectron mass spectrum in Au collisions for 1.15 GeV/. These cross sections were scaled by the average number of Au binary collisions () to give the equivalent cross section. For , both generators gave within uncertainties the same result for the cross section extrapolated to zero invariant mass [62]:
| (25) |
The cross section strongly depends on the event generator. The mc@nlo yields the following cross section [62]:
| (26) |
whereas pythia gives:
| (27) |
This cross section, derived from data in Au collisions, is consistent within uncertainties with the cross section derived from measurements of single electrons from semileptonic decays of heavy flavor mesons in collisions, extrapolated to = 0 GeV/ using pythia simulations [44]. mc@nlo was not used to derive the heavy flavor cross section from measurements of single electrons.
The two results, Eqs. (26) and (27), although consistent within 1.2 , yield central values which differ by a factor of 2.5. This difference comes mainly from the extrapolation of the dilepton yield from 1.15 GeV/ to = 0 GeV/, as illustrated in Fig. 24. Figure 24 also shows an absolute comparison of the pythia and mc@nlo dielectron invariant yields from correlated heavy flavor meson decays in MB AuAu collisions, obtained by scaling of the cross sections quoted in Eqs. (26) and (27). At high masses, 1.15 GeV/, both generators give by construction the same yield, with a very small difference in shape. However, at low masses there is a large discrepancy in the absolute yield.
The Au (as well as the ) inclusive dilepton yield is not very sensitive to this variation of the cross section because the large effect at low masses is diluted by the contributions from light meson decays. The situation is quite different in AuAu collisions. The yield from light meson decays scales approximately with , whereas the contribution from heavy flavor scales with making the latter dominant at low-masses in central collisions. The choice of the generator used to simulate the contribution will therefore affect the total cocktail yield at low masses and will influence the interpretation of the AuAu data in terms of an excess with respect to the cocktail. The results will be presented in the next section using pythia for an easier comparison with previously published results but both generators, pythia and mc@nlo, will be considered in the discussion.
IV.4 Cocktail normalization
In the present analysis we use the precisely measured data at low masses to derive the normalization of the cocktail of hadronic sources. In the restricted phase space defined by 0.1 GeV/ and / 5 the inclusive yield is dominated by Dalitz decays with a small contribution of direct virtual photons and an even smaller contribution of Dalitz decays. To a very good approximation the mass spectrum of these three sources has a 1/ dependence and their relative magnitude is well known. The ratio of direct photons to is known from PHENIX measurements [63, 64] and the ratio of to can be easily obtained from the PHENIX measurement at high [58] and the scaling as described in Section IV.2. By fitting the cocktail+direct virtual photons to the data in the restricted phase space defined above, one obtains the rapidity density that determines the normalization of the cocktail. The values are found to be consistent with measurements of neutral and charged pions [53, 54, 55] within the systematic uncertainties of cocktail and data.
Alternatively, the cocktail can be absolutely normalized using the rapidity density derived from these measurements as done in Ref. [23]. The cocktails obtained with these two procedures are compared in Fig. 25. The results differ at masses 100 MeV/ by about 25% which is approximately the contribution of the virtual direct photons. However, for the mass range of interest, that is typically 0.3–0.76 GeV/, the difference is smaller and amounts to only 15%. In this mass range, the yield is dominated by the contributions from correlated heavy flavor decays and changing by 25% has a minor effect on the inclusive yield. At even higher masses, 1 GeV/, the two procedures yield exactly the same results. The present procedure is adopted to be consistent with the known contribution of internal conversion.
IV.5 Systematic uncertainties on the cocktail
The systematic uncertainties of the cocktail ingredients are estimated and propagated to determine the total cocktail systematic uncertainty. The following uncertainties are considered:
(i) Light meson to ratio: We adopt the same systematic uncertainties used in Ref. [23], namely 30% for , and , 33% for and 100% for .
(ii) Direct photon: The systematic uncertainties in the direct photon are taken from Ref. [64]. They range from 24% to 70% from central to peripheral collisions, respectively.
(iii) Open heavy flavor (, ): We use the systematic uncertainties of the open heavy flavor cross sections given in Eqs. (26) or (27) for and (25) for , taken from Ref. [62]. The systematic uncertainties shown in Table 2 are added in quadrature when the cross sections are scaled to AuAu collisions.
(iv) : The systematic uncertainty of the cross section in collisions is estimated to be 14% [65]. The systematic uncertainties in and are added in quadrature. The uncertainties are taken from Ref. [59], ranging from 22% to 35% depending on centrality.
A summary of the cocktail systematic uncertainties is presented graphically in Fig. 26, which shows the systematic uncertainty of each cocktail component together with the total cocktail systematic uncertainty, determined as their quadratic sum.
IV.6 The AuAu Cocktail
The cocktail, calculated as described above, using the pythia generator for the open heavy flavor contributions, is presented in Fig. 27 for MB AuAu collisions together with the individual components of the cocktail. For comparison, Fig. 27 also shows the total cocktail using mc@nlo for the open heavy flavor contributions. The differences discussed above in Section IV.3 are clearly reflected in this comparison.
V RESULTS and DISCUSSION
V.1 Invariant mass spectra
Figure 28 shows the invariant mass spectrum of pairs within the PHENIX acceptance (as defined in Section II.5.1) for MB AuAu collisions. The spectra are subject to a cut of 0.2 GeV/ on the single electron tracks and to a 100 mrad cut on the pair opening angle. Statistical and systematic uncertainties on the data points are shown separately by vertical bars and boxes, respectively. Figure 28 also compares the measured spectrum to the cocktail of expected sources, where pythia is used to calculate the correlated pairs from heavy flavor decays. The individual contributions to the cocktail are shown in the figure.
See Section IV for details about the cocktail calculation. The total systematic uncertainty of the cocktail is shown by the yellow band. The bottom panel shows the ratio of data to cocktail.
Figure 29 shows the invariant mass spectra of pairs for the five centrality bins analyzed in this work, compared to the cocktail.
For a more detailed discussion of the centrality and transverse momentum
dependencies of the dielectron yield, we consider three mass regions:
(a) the mass region 0.10 GeV/ that is dominated by the
Dalitz decay.
(b) the low-mass region (LMR), 0.30 0.76 GeV/, below the
meson mass, that is the most sensitive region to in-medium
effects.
(c) the intermediate-mass region (IMR), 1.2 2.8 GeV/,
that is dominated by the correlated pairs from the semi-leptonic decays of
charm and bottom mesons.
Figure 30 shows the pair distribution for these three mass intervals in MB collisions. In the following sections we discuss the results in these three mass intervals.
V.2 Dalitz region
The mass region 0.10 GeV/ is dominated by the Dalitz decay with a small contribution of direct virtual photons of 20% and an even smaller contribution of the Dalitz decay of 10%. We discuss here only the shape of the distribution because the integrated dielectron yield in this mass interval was used to normalize the cocktail for the five centrality bins as described in Section IV. Figure 30 compares the measured dielectron distribution for MB collisions in this mass interval to the distribution of the hadronic cocktail that uses the parametrization for the and mesons [Eq. (24)]. The agreement between the two distributions, in shape and magnitude, is very good when adding the measured yield of direct virtual photons.
V.3 Low-mass region (LMR)
In the LMR, the yield is expected to be saturated by the light mesons ( and ) and the contribution. Figure 28 shows an enhancement of pairs with respect to the cocktail in MB collisions. The enhancement develops with centrality as shown in Fig. 29 and it appears to be distributed over the whole range covered by the measurement, as can be seen in Fig. 30. We quantify the effect by the enhancement factor defined as the ratio of the measured over expected dilepton yield integrated in the LMR. As discussed in Section IV.3, the cocktail yield in this mass region depends on the generator, pythia or mc@nlo, used to calculate the open heavy flavor contribution. The enhancement factors obtained with pythia are shown as a function of centrality in Fig. 31 and they are listed in in Table 8 for the two cases. The enhancement factors are approximately 40% higher when pythia is used to calculate the open heavy flavor contribution instead of mc@nlo.
| Centrality | Enhancement factor stat syst model | |||
|---|---|---|---|---|
| mc@nlo | pythia | |||
| MB | 1.7 0.3 0.3 0.2 | 2.3 0.4 0.4 0.2 | ||
| 0%–10% | 2.3 0.7 0.5 0.2 | 3.2 1.0 0.70.2 | ||
| 10%–20% | 1.3 0.4 0.5 0.2 | 1.8 0.6 0.7 0.2 | ||
| 20%–40% | 1.4 0.2 0.3 0.2 | 1.8 0.3 0.4 0.2 | ||
| 40%–60% | 1.2 0.2 0.3 0.2 | 1.6 0.2 0.4 0.2 | ||
| 60%–92% | 1.0 0.1 0.2 0.2 | 1.4 0.2 0.3 0.2 | ||
V.3.1 Comparison to previous PHENIX results
The enhancement factors quoted above are significantly smaller than those previously reported by PHENIX [23] in the same AuAu collision system at the same energy of = 200 GeV. There are a number of significant differences, both qualitative and quantitative, between the two analyses:
- •
Hadron contamination: The purity of the electron sample is very different in the two cases. In [23] the hadron contamination was 30% in central AuAu collisions, whereas in the present analysis, the HBD enabled this contamination to be reduced to less than 5% at all centralities.
- •
Signal sensitivity: The signal sensitivity is usually quantified by the signal to background ratio. The values displayed in Fig. 18 are similar to those quoted in Ref. [23]. This is however, a misleading comparison, because in a situation of subpercent ratio, the magnitude of critically depends on the accuracy of the background subtraction. A better way to assess the sensitivity of the measurement is provided by the cocktail/background, , ratio. From the signal/background ratio and the enhancement factors quoted in Ref. [23], we estimate an average value of over the mass range = 0.15–0.75 GeV/ of 1/600 in MB collisions. In the present analysis the same ratio is found to be 1/250. In addition to that, one should take into account that in the 2010 run with the field configuration there is a larger track acceptance of 20%. This rough estimate indicates that at the same multiplicity the signal sensitivity in the present analysis is larger by a factor of 3.5 compared to the previous one.
- •
- •
- •
- •
Away-side jet component: The away-side jet component of the correlated background was found to be negligible in [23] and only the near-side jet component was considered. In the present analysis, both components are absolutely calculated. The away-side component is indeed relatively small but both components are considered and subtracted.
- •
Background subtraction procedure: In Ref. [23], the shapes of the three components of the background (combinatorial background, cross pairs and near-side jet) were calculated whereas their absolute scales were obtained by fitting to the like-sign spectra. In the present analysis, all components of the correlated background (cross pairs, jet pairs and electron-hadron pairs) are calculated and subtracted in absolute terms. There is only one free parameter in the background subtraction procedure, namely the normalization factor of the combinatorial background.
In conclusion, we do not confirm our previous report of a large excess seen in the LMR [23]. The differences listed above affect the yield in the mass region where the excess was reported but not always in the same direction. For example, the loose pair cuts lead to under subtraction of the background whereas neglecting the flow modulation, has the opposite effect namely it leads to over subtraction in the mass region where the excess was observed. These differences also do not affect the unlike-sign yield by a similar magnitude. The hadron contamination, the loose pair cuts and the electron-hadron pairs are the most significant ones in this respect. Taking all the differences together, the present analysis is much improved compared to the previous one and we thus consider the previous result on the low-mass excess to be superseded by the results presented here.
V.3.2 Comparison to STAR results
Recently, STAR published results on production in AuAu collisions at = 200 GeV [66, 67]. In the same mass range of = 0.30–0.76 GeV/, STAR observes an excess of dielectrons and quotes a value of 1.77 in MB collisions, for the ratio of the dielectron yield to the hadronic cocktail excluding the meson contribution. There are two factors that should be taken into account when comparing the STAR results with those quoted in Table 8. First, excluding the contribution results in an increase of about 10% of the data to cocktail ratio. Second, STAR uses pythia with a charm cross section = 171 26 b [66] which is between the PHENIX cross sections quoted in Section IV for pythia and mc@nlo. Taking those two differences into account, as well as the experimental uncertainties, we find that the results of the two experiments are consistent in the LMR. The centrality and dependencies of the enhancement reported in [67] are also consistent with our results.
V.4 Intermediate-mass region (IMR)
The IMR is dominated by correlated pairs from the semi-leptonic decays of mesons, with a small contribution from mesons and an even smaller contribution from Drell Yan. The latter is neglected in the cocktail calculation. This mass interval is singled out by theory as the most sensitive window to identify the thermal radiation of the QGP in the dilepton spectrum [68, 69].
The results displayed in Figs. 28 and 29 show a small enhancement of dileptons in the IMR with respect to the yield from decays calculated using pythia. The enhancement factors are shown in Fig. 32 as a function of centrality and the values are listed in Table 9. The results are consistent with those of Ref. [23] within the large experimental uncertainties of the latter. There is very little difference in the dilepton yield in this mass interval if mc@nlo is used instead of pythia, as demonstrated in Fig. 27. The shapes are very similar and the integral yields in the IMR differ by less than 10% in the two cases.
| Centrality | Enh. factor stat syst model | ||
|---|---|---|---|
| pythia | |||
| 0%–10% | 1.3 0.7 0.3 | ||
| 10%–20% | 1.8 0.5 0.3 | ||
| 20%–40% | 1.8 0.2 0.3 | ||
| 40%–60% | 1.1 0.2 0.3 | ||
| 60%–92% | 1.0 0.2 0.3 | ||
| MB | 1.5 0.3 0.3 | ||
| MB (random ) | 2.5 0.5 0.3 |
Using pythia, the enhancement factor in MB events is 1 standard deviation away from unity. However, the data to cocktail comparison discussed above, represents an extreme case in which it is assumed that the correlations between the pairs in AuAu collisions are the same as in collisions. It is however, well known that heavy flavor quarks exhibit energy loss and collective flow in the medium formed in AuAu collisions, as manifested for example in measurements of single electrons [44, 70]. This should affect the correlation between the pairs from decays. Lacking a suitable generator to model this effect, we consider also the opposite extreme approach in which we assume that the pair is totally decorrelated. The invariant mass is calculated using two electrons randomly selected from the measured distribution of single electrons from heavy flavor decays [44], with uniform distributions in pseudorapidity and azimuthal angle. The pair is filtered through the ideal PHENIX acceptance and the integral is normalized to the calculated pythia yield from decays. This extreme case results in a softer mass distribution in the IMR as can be seen in Fig. 33.
There is a small yield depletion at high masses compensated by a higher yield at low masses. The integral in the IMR is lower resulting in enhancement factors that are 70% larger compared to those derived from pythia. The enhancement factor in MB collisions is quoted in the last line of Table 9 and the centrality dependence is seen by comparing the data points to the dot-dashed line in Fig. 32.
V.5 Comparison to theory
In this section we compare our results to the model originally developed by Rapp and Wambach [71, 72]. The model uses an effective Lagrangian and a many body approach to compute the electromagnetic spectral function which is the main factor in the calculation of the dilepton production rates. In the LMR, the spectral function is saturated via vector meson dominance, by the light vector mesons, in particular the meson, whereas at larger masses it is dominated by multipion states or equivalently, via quark-hadron duality, by annihilation. The dilepton yields are obtained by an appropriate integration of the thermal rates over the space-time evolution of the fireball. This model was very successful in reproducing the low-mass dilepton enhancement discovered at SPS by the CERES experiment and later further studied by the NA60 experiment. In the comparison below, we use an improved version of the model that incorporates recent developments, a nonperturbative QGP equation of state and QGP emission rates, i.e. annihilation at temperatures higher than the critical temperature, both based on lattice QCD [73]. It is important to note that this updated version preserves the agreement with the SPS data and also reproduces the RHIC results from STAR.
Figures 34 and 35 compare the invariant mass spectrum and the LMR pair distribution with the model calculations for MB collisions [74]. The main components, in-medium broadening, QGP thermal radiation and cocktail excluding the , together with their sum, are shown separately.
In both figures the data are consistent with the calculations. Within this model, the enhancement in the LMR originates from the in-medium broadening, i.e. the thermal radiation of the hadronic phase, with a very small contribution from the QGP.
In the model, the centrality dependence of the thermal radiation is reasonably well described, within an uncertainty of 10%, by a power-law scaling of the charged particle rapidity density ()α, with 1.45 [73], very similar to the scaling of the thermal photon yield [69, 64]. Within uncertainties, the present data are consistent with this scaling as illustrated in Fig. 36, which also shows the centrality dependence of the excess, i.e. the data after subtracting the cocktail without the vacuum , together with the expected power-law scaling (dashed line).
VI SUMMARY AND CONCLUSIONS
PHENIX has measured invariant mass spectra, distributions and the centrality dependence of the pair production in AuAu collisions at = 200 GeV. The use of the HBD provided additional electron identification to the central arm detectors, additional hadron rejection and increased rejection of the combinatorial background.
A new analysis procedure based on neural networks has been developed that combines in an efficient way the information from the HBD and the central arm detectors, RICH, TOF and EMCal. This results in three independent parameters for electron identification, hadron rejection and close pair rejection, instead of the fourteen parameters of the four detectors involved in these tasks. A quantitative understanding of the total background at the subpercent level is achieved in the most central collisions. This is realized by a precise evaluation of all the background sources. The combinatorial background is determined by the event mixing technique together with an exact weighting procedure to take into account the flow effects that are inherent in the foreground events and cannot be reproduced in the mixed events. All the correlated background sources are calculated in absolute terms using simulations and published results.
The results are compared with a cocktail of the known sources. The contributions from light hadron decays that dominate the yield at low masses 1 GeV/, are determined using PHENIX measurements for pions and scaling for other mesons. The contributions from semileptonic decays of heavy flavor (charm and bottom) mesons are calculated with the pythia or mc@nlo generators using scaled cross sections. Both generators give very similar yields in the IMR. However, they predict very dissimilar results that differ from each other by a factor of 2 in the LMR. Precise measurements of the charm cross section over the entire phase space are needed to resolve this discrepancy.
A small enhancement of is observed in the LMR with respect to the cocktail. The enhancement is distributed over the entire range measured ( 5 GeV/). It increases with centrality and amounts to for MB collisions when pythia is used to calculate the open heavy flavor contribution. If instead mc@nlo is used, the enhancement factors are 40% smaller and for MB collisions it is found to be . The large enhancement of pairs in the LMR previously reported by PHENIX, in AuAu collisions at = 200 GeV [23], is not confirmed by the results of the present improved analysis. In particular, the concentration of the excess at low ( 1 GeV/) is not observed here. The present results are consistent with those recently published by the STAR Collaboration [66] within the uncertainties of the two experiments.
In the IMR, the results are compared with calculations of the expected yield from the semileptonic decays of heavy flavor mesons in two extreme scenarios. In the first scenario, the heavy flavor contribution is calculated assuming that the correlations between the are the same in AuAu as in collisions, ignoring decorrelation effects produced by the interactions of heavy flavor quarks with the medium. A small enhancement is observed with respect to the yield predicted by pythia. It amounts to for MB collisions. In the other scenario, the opposite extreme approach is adopted where the pair is assumed to be totally decorrelated. In this case, the enhancement factor becomes . The reality is somewhere between these two extreme cases and we conclude that there is room in the data for a significant additional contribution, for example of thermal radiation, in the IMR. The nature of the IMR pairs will be studied with high statistics AuAu data in 2014 data taking with the silicon vertex tracker (VTX) installed in PHENIX.
The results in the LMR are compared to calculations based on the model originally developed by Rapp and Wambach [71, 72] with subsequent improvements that incorporate recent developments [73]. The model includes thermal radiation emission from the QGP phase ( annihilation) as well as from the hadronic phase (mainly from the meson copiously produced by pion annihilation, ). The invariant mass and distributions as well as the centrality dependence are well reproduced by the calculations. The enhancement observed in the LMR from SPS up to RHIC energies is thus consistently reproduced by a single model. Within this model, the enhancement originates from the melting of the meson resonance as the system approaches chiral symmetry restoration.
ACKNOWLEDGMENTS
We thank the staff of the Collider-Accelerator and Physics Departments at Brookhaven National Laboratory and the staff of the other PHENIX participating institutions for their vital contributions. We also thank R. Rapp for providing us the results of his model calculations and for helpful discussions. We acknowledge support from the Office of Nuclear Physics in the Office of Science of the Department of Energy, the National Science Foundation, Abilene Christian University Research Council, Research Foundation of SUNY, and Dean of the College of Arts and Sciences, Vanderbilt University (U.S.A), Ministry of Education, Culture, Sports, Science, and Technology and the Japan Society for the Promotion of Science (Japan), Conselho Nacional de Desenvolvimento Científico e Tecnológico and Fundação de Amparo à Pesquisa do Estado de São Paulo (Brazil), Natural Science Foundation of China (People’s Republic of China), Croatian Science Foundation and Ministry of Science, Education, and Sports (Croatia), Ministry of Education, Youth and Sports (Czech Republic), Centre National de la Recherche Scientifique, Commissariat à l’Énergie Atomique, and Institut National de Physique Nucléaire et de Physique des Particules (France), Bundesministerium für Bildung und Forschung, Deutscher Akademischer Austausch Dienst, and Alexander von Humboldt Stiftung (Germany), National Science Fund, OTKA, Károly Róbert University College, and the Ch. Simonyi Fund (Hungary), Department of Atomic Energy and Department of Science and Technology (India), Israel Science Foundation (Israel), Basic Science Research Program through NRF of the Ministry of Education (Korea), Physics Department, Lahore University of Management Sciences (Pakistan), Ministry of Education and Science, Russian Academy of Sciences, Federal Agency of Atomic Energy (Russia), VR and Wallenberg Foundation (Sweden), the U.S. Civilian Research and Development Foundation for the Independent States of the Former Soviet Union, the Hungarian American Enterprise Scholarship Fund, and the US-Israel Binational Science Foundation.
Appendix A Introducing Flow in the Mixed Events
In this section, we analytically derive the weighting factor introduced in Eq. (10). We start from the azimuthal distribution of a particle that follows the expression:
| (28) |
where is the azimuthal angle of the particle, is the reaction plane azimuthal angle of the event and is the detection efficiency of the spectrometer at .
The distribution of any two particles in the same event (foreground pairs) can be calculated as:
| (29) | |||||
Replacing by its expression in (28) allows one to write as the sum of four integrals:
| (30) |
| (31) |
| (32) |
| (33) |
| (34) | |||||
It is easy to show that the integrals of and are equal to 0 and the integral of leads to:
| (35) | |||||
Therefore,
| (36) | |||||
In a similar way one can calculate the distribution of mixed BG pairs produced without reaction plane binning:
| (37) | |||||
where and represents the azimuthal angle of particle 1(2) and the reaction plane azimuthal angle of the events from which the particles are taken. Replacing by (28):
| (38) | |||||
| (39) |
| (40) |
| (41) |
| (42) | |||||
Because , and are again easily proved to be 0, can now be written as:
| (43) |
The weighting factor to introduce the flow correlation into the mixed BG pairs is then given by the ratio between Eq. (36) and Eq. (43):
| (44) | |||||
Appendix B Violation of due to flow
In this appendix, we demonstrate that the combination of elliptic flow and nonuniform detection efficiency violates the well-known relation between unlike-sign and like-sign combinatorial background:
| (45) |
where are the unlike-sign and like-sign integral yields or average numbers of pairs per event.
We start from the case without elliptic flow. Then, as proven in Ref [23], if and are always produced in pairs independent of each other, the average number of unlike-sign and like-sign combinatorial pairs can be calculated as:
| (46) | |||||
| (47) | |||||
| (48) |
where is the probability to reconstruct both tracks of a pair, is the probability to reconstruct only a single track and is the number of pairs in an event.
If are assumed to be constants, Eq. (45) can easily be proven from Eqs. (46-48). However, in the presence of elliptic flow, the probabilities depend on the reaction plane angle:
| (49) |
| (50) | |||||
| (51) | |||||
| (52) | |||||
| (53) | |||||
| (54) |
Taking the average over within [] gives:
| (55) | |||||
| (56) | |||||
| (57) |
Using the Cauchy-Schwarz inequality, one obtains:
| (58) | |||||
and consequently,
| (59) |
Appendix C A second, independent analysis
A subset of the data, MB events, was analyzed by a second independent team. The second analysis follows the analysis strategy presented in Ref. [23], but includes the information provided by the HBD and other important improvements developed in this work.
In this appendix we present the key features of the second analysis with an emphasis on the most important differences to the main analysis: (i) the HBD underlying event subtraction and cluster algorithm, (ii) the electron identification cuts and (iii) the background normalization. All analysis steps not explicitly mentioned are identical between the two analyses. In particular, identical cuts on the acceptance and inactive detector areas, and the same pair cuts are applied. At the end of this appendix we discuss the efficiency correction and compare the results of both analyses.
The net number of photo electrons in an HBD cluster was calculated with a different algorithm than discussed in Section II.4, using a local estimate of the scintillation background rather than a module average. As an electron typically fires three HBD readout cells, 3-cell triplets are used to initiate the cluster search. All possible triplets are formed. The photo-electron background due to scintillation light is estimated by the median amplitude in the first and second neighboring cells around the triplet. The background subtracted triplet charge is calculated as:
| (60) |
where is the total charge in the triplet, the number of cells with charge in the triplet, and , are the median charge in the first and second neighboring cells, respectively. Only triplets with p.e. are recorded.
Electron candidates are projected to the HBD, and triplets within 1.5 cm of the track are merged to form a cluster. The net charge of the cluster is calculated starting from the sum of the charge of all cells in the cluster:
| (61) |
where is the sum of the charge of all cells in the cluster, is the number of cells in the cluster, , are again the median charge per cell in the first and second neighbors but now around the cluster.
This analysis uses a number of sequential one-dimensional cuts to identify electrons. The variables used for the electron identification are defined in Section III.3.1. The following cuts are used:
- •
n0 2: The exclusion of RICH photo-multipliers fired by background electrons (Section III.3.2) is not used in this analysis.
- •
disp 5.5 cm
- •
chi2/npe0 20
- •
emcsdr 3
- •
dep 2
- •
1.5: Calculated based on the time-of-flight measured by either the EMCal or the TOF-E detectors.
- •
10 40 p.e.: Cluster charge as defined in Eq. (61)
With these cuts, a purity of the electron sample of 86% is achieved for the most central bin, which quickly increases to above 99% for the most peripheral collisions.
The combinatorial background is calculated by event mixing. We use the method outlined in [23], but included the weighting for the azimuthal anisotropy as implemented in the main analysis and described in Section III.5.2. For the correlated background both analyses use the same MC simulations. For cross-pairs and jet-pairs the simulated pairs were reanalyzed with the track selection cuts and HBD cluster algorithm mentioned above. The shapes of the mass spectra are consistent within systematic uncertainties for the two analysis methods. For the electron-hadron and contributions the simulated pairs were not reanalyzed.
The normalizations of all the background components were fitted simultaneously to the full mass and range of the like-sign spectra:
| (62) | |||||
The parameters are the individual normalization constants. Figure 37 shows the like-sign foreground divided by the sum of all background sources for the five centrality classes. The uncertainty on the combinatorial background normalization is shown as a gray band on each panel. No systematic deviation from unity is observed, indicating that the sum of the different background components gives a sufficiently accurate description over the mass range up to 2 GeV/ with no indication of any shape variation within the shown uncertainties. Above 2 GeV/ the statistical significance makes a comparison at the shown scale meaningless.
After fixing the normalization of all background sources so that a satisfactory description of the like-sign pairs is achieved, the analysis is extended to unlike-sign pairs. The normalizations for the unlike-sign cross-pairs, jet-pairs and electron-hadron pairs are taken from Eq. (62). For the combinatorial unlike-sign pairs we use unlike-sign mixed event pairs. The normalization is also taken from Eq. (62), but needs to be corrected to account for the different effect of the pair cuts on like- and unlike-sign pairs as done in Ref. [23].
To estimate the uncertainty on the raw yield due to the background subtraction one needs to consider the signal-to-background ratio . The uncertainties on the are multiplied by and added in quadrature. This results in systematic uncertainties at 0.6 GeV/ for MB collisions.
We factorize the efficiency into 3 terms, which are determined separately.
| (63) |
The first factor describes the effect of all reconstruction algorithms and cuts except for the time-of-flight cut and the centrality dependence of the reconstruction efficiency in the central arms, which are treated separately. It is obtained by a MC simulation of pairs that are processed through the full PHENIX detector simulation, including the HBD. The simulated HBD hits are embedded into real HBD data as discussed in Section III.6. These events are then analyzed with the same electron identification, fiducial, and pair cuts used in the independent analysis, with exception of the time-of-flight cut. The systematic uncertainty of is about 12%. It was determined from the measured yield of pairs in the Dalitz decay region when varying electron identification cuts in a way that changes the raw pair yields by factors between 0.5 and 1.5.
The efficiency is determined from tracks measured in peripheral collisions, where the hadron contamination is negligible, by comparing data obtained with a 1.5 cut to the case with no time-of-flight cut. We find that on average the TOF efficiency for tracks is 93% above 0.4 GeV/, but drops to 80% at 0.2 GeV/ independent of centrality. This drop results from a failure of the electronics to properly record time for low amplitude signals. In the main analysis this issue was avoided by treating tracks with no time information separately. The systematic uncertainty due to this cut is a few percent at 0.6 GeV/.
The efficiency was determined by embedding MC-simulation tracks into the data of all used central arm detectors and analyzing these embedded tracks using the same cuts as used in the data. The values are found to be very similar to those derived in the main analysis. For central collisions an additional 8% systematic uncertainty is added.
Compared to the main analysis, the total reconstruction efficiency is a factor of 2 smaller for central collisions. The difference drops to 30% for the most peripheral collisions.
The fully corrected mass spectra from the independent analysis are compared to those from the main analysis in Fig. 38 for all five centrality bins. The results are consistent within uncertainties.
References
- [1] Edward V. Shuryak, “Quark-Gluon Plasma and Hadronic Production of Leptons, Photons and Psions,” Phys. Lett. B 78, 150 (1978), [Yad. Fiz. 28, 796 (1978)].
- [2] P. Petreczky, “Lattice QCD at non-zero temperature,” J. Phys. G 39, 093002 (2012).
- [3] C. A. Dominguez, M. Loewe, and Y. Zhang, “Chiral symmetry restoration and deconfinement in QCD at finite temperature,” Phys. Rev. D 86, 034030 (2012), [Erratum: Phys. Rev. DD90,no.3,039903(2014)].
- [4] For recent theoretical and experimental reviews see the articles by R. Rapp et al. (arXiv:0901.3289) et al. and I. Tserruya (arXiv:0903.0415) in Landolt-Borstein New Series I/23A (2010).
- [5] G. Agakichiev et al. (CERES Collaboration), “Enhanced production of low mass electron pairs in 200 GeV/u S- Au collisions at the CERN SPS,” Phys. Rev. Lett. 75, 1272 (1995).
- [6] G. Agakishiev et al. (CERES/NA45), “Low mass e+ e- pair production in 158/A GeV Pb- Au collisions at the CERN SPS, its dependence on multiplicity and transverse momentum,” Phys. Lett. B 422, 405 (1998).
- [7] D. Adamova et al., “Modification of the rho-meson detected by low-mass electron-positron pairs in central Pb-Au collisions at 158-A GeV/c,” Phys. Lett. B 666, 425 (2008).
- [8] D. Adamova et al. (CERES/NA45), “Enhanced production of low mass electron pairs in 40-AGeV Pb- Au collisions at the CERN SPS,” Phys. Rev. Lett. 91, 042301 (2003).
- [9] R. Arnaldi et al. (NA60 Collaboration), “First measurement of the rho spectral function in high-energy nuclear collisions,” Phys. Rev. Lett. 96, 162302 (2006).
- [10] R. Arnaldi et al. (NA60 Collaboration), “Evidence for radial flow of thermal dileptons in high-energy nuclear collisions,” Phys. Rev. Lett. 100, 022302 (2008).
- [11] R Arnaldi et al. (NA60 Collaboration), “Evidence for the production of thermal-like muon pairs with masses above 1 GeV/ in 158-A GeV Indium-Indium Collisions,” Eur. Phys. J. C 59, 607 (2009a).
- [12] R. Arnaldi et al. (NA60 Collaboration), “NA60 results on thermal dimuons,” Eur. Phys. J. C 61, 711 (2009b).
- [13] H. van Hees and R. Rapp, “Dilepton Radiation at the CERN Super Proton Synchrotron,” Nucl. Phys. A 806, 339 (2008).
- [14] H. van Hees and R. Rapp, “Comprehensive interpretation of thermal dileptons at the SPS,” Phys. Rev. Lett. 97, 102301 (2006).
- [15] J. Ruppert, C. Gale, T. Renk, P. Lichard, and Joseph I. Kapusta, “Low mass dimuons produced in relativistic nuclear collisions,” Phys. Rev. Lett. 100, 162301 (2008).
- [16] K. Dusling, D. Teaney, and I. Zahed, “Thermal dimuon yields at NA60 Collaboration,” Phys. Rev. C 75, 024908 (2007).
- [17] E. L. Bratkovskaya, W. Cassing, and O. Linnyk, “Low mass dilepton production at ultrarelativistic energies,” Phys. Lett. B 670, 428 (2009).
- [18] O. Linnyk, E. L. Bratkovskaya, V. Ozvenchuk, W. Cassing, and C. M. Ko, “Dilepton production in nucleus-nucleus collisions at top SPS energy within the Parton-Hadron-String Dynamics (PHSD) transport approach,” Phys. Rev. C 84, 054917 (2011).
- [19] G. E. Brown and Mannque Rho, “Scaling effective Lagrangians in a dense medium,” Phys. Rev. Lett. 66, 2720 (1991).
- [20] G. E. Brown and Mannque Rho, “Chiral restoration in hot and/or dense matter,” Phys. Rept. 269, 333 (1996).
- [21] G.-Q. Li, C. M. Ko, and G. E. Brown, “Enhancement of low mass dileptons in heavy ion collisions,” Phys. Rev. Lett. 75, 4007 (1995).
- [22] P. M. Hohler and R. Rapp, “Is -Meson Melting Compatible with Chiral Restoration?” Phys. Lett. B 731, 103 (2014).
- [23] A. Adare et al. (PHENIX Collaboration), “Detailed measurement of the pair continuum in and Au+Au collisions at =200 GeV and implications for direct photon production,” Phys. Rev. C 81, 034911 (2010a).
- [24] O. Linnyk, W. Cassing, J. Manninen, E. L. Bratkovskaya, and C. M. Ko, “Analysis of dilepton production in Au+Au collisions at =200 GeV within the Parton-Hadron-String Dynamics (PHSD) transport approach,” Phys. Rev. C 85, 024910 (2012).
- [25] A. Kozlov, I. Ravinovich, Lev I. Shekhtman, Z. Fraenkel, M. Inuzuka, and I. Tserruya, “Development of a triple GEM UV photon detector operated in pure CF(4) for the PHENIX experiment,” Nucl. Instrum. Methods Phys. Res., Sec. A 523, 345 (2004).
- [26] Z. Fraenkel et al., “A Hadron blind detector for the PHENIX experiment at RHIC,” Nucl. Instrum. Methods Phys. Res., Sec. A 546, 466 (2005).
- [27] W. Anderson et al., “Design, Construction, Operation and Performance of a Hadron Blind Detector for the PHENIX Experiment,” Nucl. Instrum. Methods Phys. Res., Sec. A 646, 35 (2011).
- [28] K. Adcox et al. (PHENIX Collaboration), “PHENIX detector overview,” Nucl. Instrum. Methods Phys. Res., Sec. A 499, 469 (2003a).
- [29] M. Allen et al. (PHENIX Collaboration), “PHENIX inner detectors,” Nucl. Instrum. Methods Phys. Res., Sec. A 499, 549 (2003).
- [30] A. Adare et al. (PHENIX Collaboration), “Spectra and ratios of identified particles in Au+Au and +Au collisions at =200 GeV,” Phys. Rev. C 88, 024906 (2013).
- [31] S. H. Aronson et al. (PHENIX Collaboration), “PHENIX magnet system,” Nucl. Instrum. Methods Phys. Res., Sec. A 499, 480 (2003).
- [32] K. Adcox et al. (PHENIX Collaboration), “PHENIX central arm tracking detectors,” Nucl. Instrum. Methods Phys. Res., Sec. A 499, 489 (2003b).
- [33] K. Adcox et al., “Construction and performance of the PHENIX pad chambers,” Nucl. Instrum. Methods Phys. Res., Sec. A 497, 263 (2003c).
- [34] Y. Akiba et al., “Ring imaging Cherenkov detector of PHENIX experiment at RHIC,” Proceedings, 3rd International Workshop on Ring Imaging Cherenkov Detectors:Advances in Cherenkov light imaging techniques and applications (RICH 1998), Nucl. Instrum. Methods Phys. Res., Sec. A 433, 143 (1999).
- [35] L. Aphecetche et al. (PHENIX Collaboration), “PHENIX calorimeter,” Nucl. Instrum. Methods Phys. Res., Sec. A 499, 521 (2003).
- [36] M. Aizawa et al. (PHENIX Collaboration), “PHENIX central arm particle ID detectors,” Nucl. Instrum. Methods Phys. Res., Sec. A 499, 508 (2003).
- [37] F. Sauli, “GEM: A new concept for electron amplification in gas detectors,” Nucl. Instrum. Methods Phys. Res., Sec. A 386, 531 (1997).
- [38] B. Azmoun et al., “A Study of Gain Stability and Charging Effects in GEM Foils,” Proceedings, 2006 IEEE Nuclear Science Symposium and Medical Imaging Conference (NSS/MIC 2006), IEEE Nucl. Sci. Symp. Conf. Rec. 6, 3847–3851 (2006).
- [39] M. Makek (PHENIX Collaboration), “Measurement of low mass dielectrons with the HBD upgrade of PHENIX Collaboration,” Quark matter. Proceedings, 22nd International Conference on Ultra-Relativistic Nucleus-Nucleus Collisions, Quark Matter 2011, Annecy, France, May 23-28, 2011, J. Phys. G 38, 124135 (2011).
- [40] M. L. Miller, K. Reygers, S. J. Sanders, and Peter Steinberg, “Glauber modeling in high energy nuclear collisions,” Ann. Rev. Nucl. Part. Sci. 57, 205 (2007).
- [41] S. S. Adler et al. (PHENIX Collaboration), “Transverse-energy distributions at midrapidity in p+p , d+Au , and Au+Au collisions at =62.4–200 GeV and implications for particle-production models,” Phys. Rev. C 89, 044905 (2014).
- [42] C. Delaere, R. Brun, and F. Rademakers, “Neural Network TMultiLayerPerceptron: ROOT Data Analysis Framework,” https://root.cern.ch/root/html/TMultiLayerPerceptron.html.
- [43] S. S. Adler et al. (PHENIX Collaboration), “Measurement of single electron event anisotropy in Au+Au collisions at = 200 GeV,” Phys. Rev. C 72, 024901 (2005).
- [44] A. Adare et al. (PHENIX Collaboration), “Heavy Quark Production in and Energy Loss and Flow of Heavy Quarks in Au+Au Collisions at =200 GeV,” Phys. Rev. C 84, 044905 (2011a).
- [45] A. Adare et al. (PHENIX Collaboration), “Measurements of Higher-Order Flow Harmonics in Au+Au Collisions at =200 GeV,” Phys. Rev. Lett. 107, 252301 (2011b).
- [46] T. Sjostrand, P. Eden, C. Friberg, L. Lonnblad, G. Miu, M. Stephen, and E. Norrbin, “High-energy physics event generation with PYTHIA 6.1,” Comput. Phys. Commun. 135, 238 (2001).
- [47] A. Adare et al. (PHENIX Collaboration), “Inclusive cross-section and double helicity asymmetry for production in collisions at =200 GeV: Implications for the polarized gluon distribution in the proton,” Phys. Rev. D 76, 051106 (2007a).
- [48] A. Adare et al. (PHENIX Collaboration), “Dihadron azimuthal correlations in Au+Au collisions at = 200 GeV,” Phys. Rev. C 78, 014901 (2008a).
- [49] GEANT User’s Guide, 3.15, CERN Program Library.
- [50] A. Adare et al. (PHENIX Collaboration), “Dilepton mass spectra in p+p collisions at = 200 GeV and the contribution from open charm,” Phys. Lett. B 670, 313 (2009).
- [51] S. Frixione and B. R. Webber, “Matching NLO QCD computations and parton shower simulations,” J. High Energy Phys. 06, 029 (2002).
- [52] S. Frixione, P. Nason, and B. R. Webber, “Matching NLO QCD and parton showers in heavy flavor production,” J. High Energy Phys. 08, 007 (2003).
- [53] S. S. Adler et al. (PHENIX Collaboration), “A Detailed Study of High-p(T) Neutral Pion Suppression and Azimuthal Anisotropy in Au+Au Collisions at = 200 GeV,” Phys. Rev. C 76, 034904 (2007).
- [54] A. Adare et al. (PHENIX Collaboration), “Suppression pattern of neutral pions at high transverse momentum in Au + Au collisions at = 200 GeV and constraints on medium transport coefficients,” Phys. Rev. Lett. 101, 232301 (2008b).
- [55] S. S. Adler et al. (PHENIX Collaboration), “Identified charged particle spectra and yields in Au+Au collisions at ,” Phys. Rev. C 69, 034909 (2004).
- [56] A. Adare et al., “Production of mesons in , d+Au, Cu+Cu, and Au+Au collisions at 200 GeV,” Phys. Rev. C 84, 044902 (2011c).
- [57] A. Adare et al. (PHENIX Collaboration), “Nuclear modification factors of mesons in Au, Cu+Cu and Au+Au collisions at 200 GeV,” Phys. Rev. C 83, 024909 (2011d).
- [58] A. Adare et al. (PHENIX Collaboration), “Transverse momentum dependence of meson suppression suppression in Au+Au collisions at = 200 GeV,” Phys. Rev. C 82, 011902 (2010b).
- [59] A. Adare et al. (PHENIX Collaboration), “ Production vs Centrality, Transverse Momentum, and Rapidity in Au+Au Collisions at =200 GeV,” Phys. Rev. Lett. 98, 232301 (2007b).
- [60] T. Sjostrand, S. Mrenna, and P. Z. Skands, “PYTHIA 6.4 Phys. and Manual,” J. High Energy Phys. 05, 026 (2006).
- [61] G. Corcella, I. G. Knowles, G. Marchesini, S. Moretti, K. Odagiri, P. Richardson, M. H. Seymour, and B. R. Webber, “HERWIG 6: An Event generator for hadron emission reactions with interfering gluons (including supersymmetric processes),” J. High Energy Phys. 01, 010 (2001).
- [62] A. Adare et al. (PHENIX Collaboration), “Cross section for production via dielectrons in dAu collisions at =200 GeV,” Phys. Rev. C 91, 014907 (2015a).
- [63] A. Adare et al. (PHENIX Collaboration), “Enhanced production of direct photons in Au+Au collisions at =200 GeV and implications for the initial temperature,” Phys. Rev. Lett. 104, 132301 (2010c).
- [64] A. Adare et al. (PHENIX Collaboration), “Centrality dependence of low-momentum direct-photon production in AuAu collisions at =200 GeV,” Phys. Rev. C 91, 064904 (2015b).
- [65] A. Adare et al. (PHENIX Collaboration), “Ground and excited charmonium state production in collisions at GeV,” Phys. Rev. D 85, 092004 (2012).
- [66] L. Adamczyk et al. (STAR Collaboration), “Dielectron Mass Spectra from Au+Au Collisions at = 200 GeV,” Phys. Rev. Lett. 113, 022301 (2014), [Addendum: Phys. Rev. Lett. 113 049903E (2014)].
- [67] L. Adamczyk et al. (STAR Collaboration), “Measurements of Dielectron Production in AuAu Collisions at = 200 GeV from the STAR Experiment,” Phys. Rev. C 92, 024912 (2015).
- [68] P. V. Ruuskanen, “Electromagnetic probes of quark- gluon plasma in relativistic heavy ion collisions,” Quark matter ’91. Proceedings, 9th International Conference on UltraRelativistic Nucleus-Nucleus Collisions, Gatlinburg, USA, November 11-15, 1991, Nucl. Phys. A 544, 169 (1992).
- [69] S. Turbide, R. Rapp, and C. Gale, “Hadronic production of thermal photons,” Phys. Rev. C 69, 014903 (2004).
- [70] A. Adare et al. (PHENIX Collaboration), “Energy Loss and Flow of Heavy Quarks in Au+Au Collisions at = 200 GeV,” Phys. Rev. Lett. 98, 172301 (2007c).
- [71] R. Rapp and J. Wambach, “Low mass dileptons at the CERN SPS: Evidence for chiral restoration?” Eur. Phys. J. C 6, 415 (1999).
- [72] R. Rapp, “Signatures of thermal dilepton radiation at RHIC,” Phys. Rev. C 63, 054907 (2001).
- [73] R. Rapp, “Dilepton Spectroscopy of QCD Matter at Collider Energies,” Adv. High Energy Phys. 2013, 148253 (2013).
- [74] R. Rapp, private communication, based on [71, 72].