Excess Vibrational Density of States and the Brittle to Ductile Transition in Crystalline and Amorphous Solids
Abstract
The conditions which determine whether a material behaves in a brittle or ductile fashion on mechanical loading are still elusive and comprise a topic of active research among materials physicists and engineers. In this study, we present results of in silico mechanical deformation experiments from two very different model solids in two and three dimensions. The first consists of particles interacting with isotropic potentials and the other has strongly direction dependent interactions. We show that in both cases, the excess vibrational density of states is the fundamental quantity which characterises the ductility of the material. Our results can be checked using careful experiments on colloidal solids.
I Introduction:
Understanding the mechanical behaviour of glassy materials [1, 2, 3, 4, 5, 6, 7, 8, 9, 10] has engaged the attention of materials scientists because of both its technological ramifications and scientific interest [11, 12, 13, 14, 15]. Glasses, in some ways represent an extreme limit of a supercooled liquid whose viscosity has increased dramatically eg. by almost orders of magnitude with decreasing temperature within a narrow range, () without any major change in structure reaching a value of Poise [16, 17]. While the question of why viscosity rises so rapidly has remained elusive [18, 19, 20, 21, 9], in this paper, we investigate the consequence of this ultra slow relaxation on the failure properties of amorphous materials under external load.
In recent experiments it was found that glassy materials can have much larger yield stress compared to their crystalline counterparts with similar compositions, but they fail catastrophically under external loading[14, 15]. Thus one of the major questions which needs to be addressed in order to be able to use glassy materials for industrial applications, is how much plastic deformation can the material withstand before it fails or in other words will the material experience brittle fracture or ductile fracture [22]. In Fig.1, typical failure events are shown for a brittle ( top panel ) and a ductile material ( bottom panel ). One can clearly see that the morphology of the fracture is very different for the two cases. For the brittle case one has somewhat rough fracture surface, on the other hand for the ductile fracture, the system forms a neck before breaking completely. It is believed that for brittle materials cavities form during tension and the different cavities eventually percolate to form the brittle crack, on the other hand for the ductile materials the failure mechanism does not involve cavities[23]. It is important to mention that the microscopic details of this cavitation is still not clearly understood nor the necking behaviour in ductile materials.


Recent molecular dynamics (MD) simulations have investigated the intrinsic relation between the properties of the inter-particle potential in order to understand the microscopic origin of brittle to ductile transition in amorphous solids [13]. It was shown that the degree of ductility is intrinsically related to the growing importance of the contribution of plastic modes to the vibrational density of states of the material. Similarly Mizuno et al.[24] and Goodrich et al. [25] have also observed that the mechanical and thermal properties of a solid are directly related to the density of normal modes of vibration. In [25], it is found that the physics of crystalline solids with defects are better described by the physics of amorphous solids near jamming transition if the concentration of defects are slightly large but not large enough to completely destroy the bulk crystalline order in the system. It was shown that vibrational density of states for these crystalline solids with defects are very similar to the amorphous solids near jamming transition. Their main conclusion is that jamming point of an amorphous solids is probably the better reference point than an ideal crystalline state to understand the physics of crystalline solids with defects beyond a small critical defects concentration.
The aim of this paper is to investigate the connection between the mechanical and vibrational properties of both crystalline and amorphous solids in an unified framework and try to come up with a measure which can characterises these properties of the system irrespective whether the material is crystalline or amorphous in nature. This is performed via extensive Molecular Dynamics Simulation by studying different systems in which the mechanical behavior of the material is varied continuously by tuning a control parameter like the interaction range of the inter-atomic potential, size disorder of different particles in the system and the quench dynamics of a colloidal system.
The structure of the paper is as follows: In Sec. II we will describe the model systems studied, the details of the parameters of the model and the how the simulations are done for all these model systems. The numerical experiments and their results are described in Sec. III and finally, the main conclusions and future directions will be discussed in Sec. IV.
II Models and Simulations Details:
To show that our results are generic, we report studies on two very different model solids. The first one consists of particles interacting with isotropic potentials and is a more or less accurate representation of a metallic glass. We study this model in both two and three dimensions. The bulk of the results presented in this manuscript relates to this model. We also present results for a second model solid which is composed of particles with strongly direction dependent interactions. This solid can be used to mimic gels, silicates and other such anisotropic materials. We describe each of these models in somewhat more detail below.
II.1 Model A:
The model studied is a generic glass former in both two and three dimensions. It is a binary mixture whose amount of bi-dispersity of small and large particles was chosen to avoid any crystallization. The particles interact by an inter-particle potential given by
| (1) |
where is the length where the potential attains its minimum, and is the cut-off length for which the potential vanishes. The coefficients , , and are chosen such that the repulsive and attractive parts of the potential are continuous with two continuous derivatives at the potential minimum and the potential goes to zero continuously at with two continuous derivatives as well. is the unit of energy, and .
We have performed simulations where the cut off distance was varied from to keeping all other parameters of the interaction potential unchanged. The interaction length scale between any two small A particles is and similarly for between one small A and one large B particles is . The interaction length scale between two large B particles is .
We have also done simulations with varied so that the system traverses from a crystalline state to an amorphous state. This is known as amorphization transition [24]. Here, an effective interaction length scale is maintained such that , where are the fractions of the two components. measures the degree of bi-dispersity in the system, and are determined using the condition that is the same as that for original model described before. We kept . The simulations are done in both two and three dimensions to study the effect of dimensionality in the results reported.
NVT MD simulations are done in a cubic simulation box with periodic boundary conditions in both two and three dimensions for all the model systems using LAMMPS package and visualization of the MD trajectory is done using VMD open source software [26, 27]. We use the modified leap-frog algorithm with the Berendsen thermostat to keep the temperature constant in the simulation runs as implemented in LAMMPS. Any other thermostat does not change the results quantitatively as we are mostly interested in configurational changes in the system instead of momentum correlations. Length, energy and time scales are measured in units of , and . The integration time steps used is in the studied temperature range. The number of particles used for is and the bi-dispersity ratio was .
II.2 Model B:
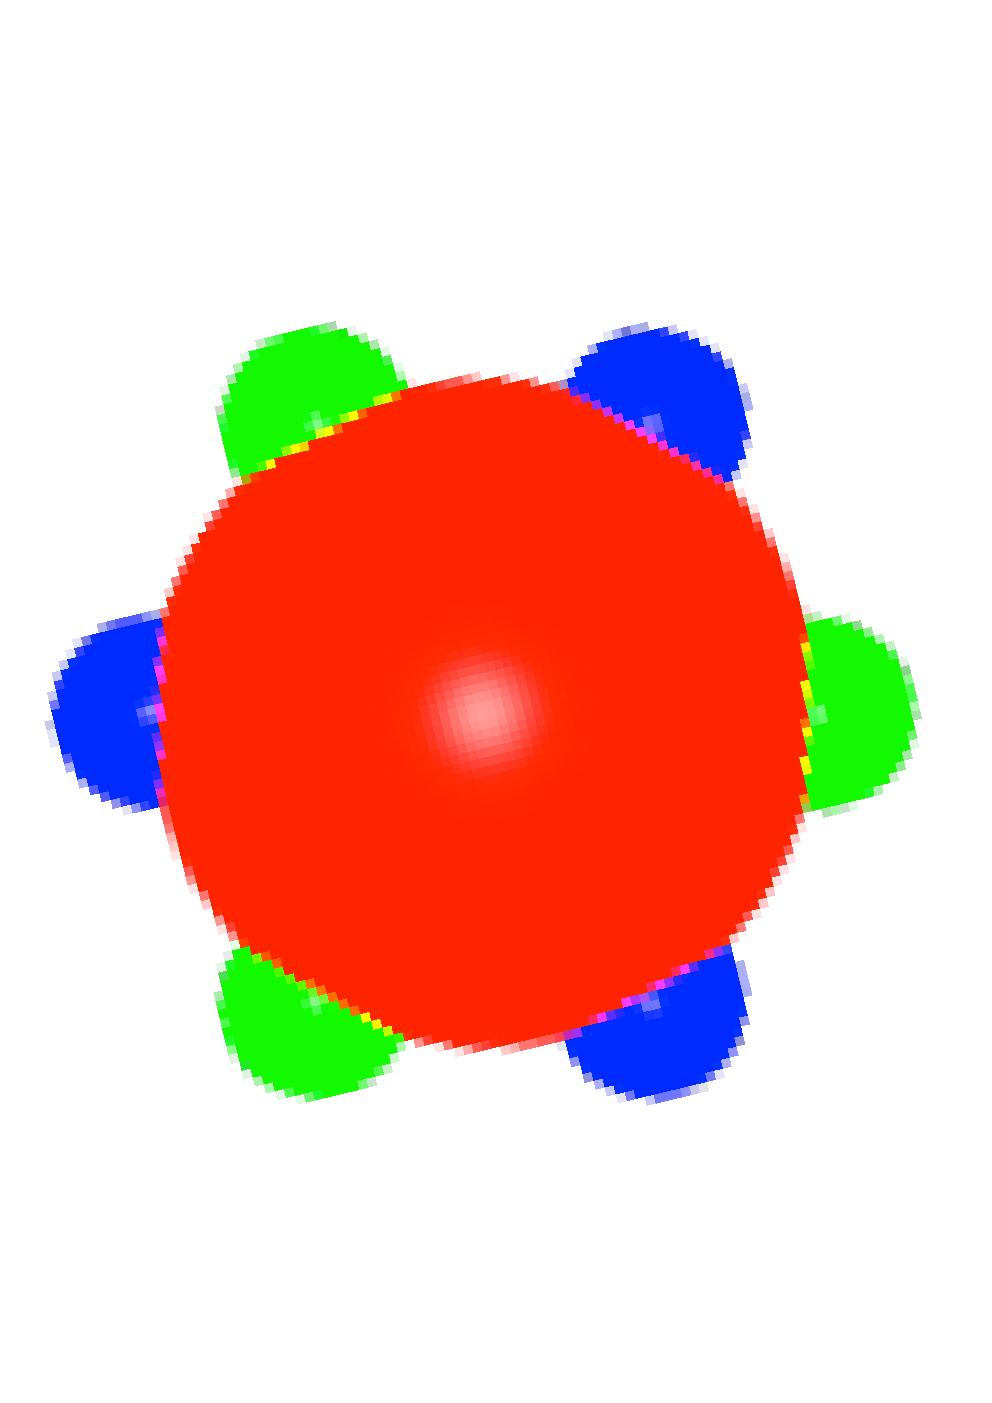
While Model A, described above, has isotropic interactions, in order to study whether the results reported here are generic for all glass forming liquids, we also perform simulations with a model solid with strongly anisotropic interactions viz. a model colloidal solid with patchy interactions in two dimensions. The details of the potential modelling the patchy colloid is based on the angle-dependent interactions of Hamaker[28, 29] and Lennard-Jones (LJ) type as implemented in the MD simulation package LAMMPS[26]. In our model, each molecule consists of one central, large, spherical particle with six small equidistant patches of alternating types on it’s equator. In Fig.2, we draw a schematic for the patchy colloid particle. We refer to the central particle shown as a large red circle as a particle and the blue and green semicircular patches on it’s equator as and particles respectively.
The interaction between two particles is a Hamaker interaction [28] between two large size colloid particles. The interaction between a particle and a particle is the interaction between a large size colloid particle and a solvent LJ particle. Two particles or a particle and a particle interact with simple LJ interaction. Details of the interactions are given in the appendix of [30]. The sizes and interaction strengths between , and particles are also tabulated in the appendix of [30]. All quantities in the table are expressed in reduced units. The unit of length and energy are and respectively. We choose the mass of each molecule without loss of generality, where is the mass of each particle.
We carry out molecular dynamics (MD) simulations on this system with an integration time-step in constant ensemble, where is the number of patchy-colloids and is the area in two dimensions. The system-temperature is kept fixed at the desired value using dissipative particles dynamics (DPD) thermostat[31] as implemented in LAMMPS.
II.3 Deformation protocols:
In all these systems the numerical experiments are designed as follows. We first equilibrate the model liquids at some high temperature and then cool it to low temperature below the experimental glass transition temperature defined as the temperature where the relaxation time becomes . Then at that low temperature we perform constant pressure and temperature(NPT) simulations at zero pressure such that one can now remove the periodic boundary condition. The initial simulations at high temperature and high pressure was done for time steps, then the system temperature was gradually reduced in steps, and finally the NPT simulation at zero pressure was run for steps. We now define two side walls at the two ends of the solid in the direction by pinning the particles in the end region. The typical size of this wall is around three inter-particle diameter. The other boundaries are made free. Next the walls are moved by an increment equal in size and opposite in sign, i.e., the system is subjected to uniaxial strain. If the material is brittle it cannot deform much before it fractures, while for a ductile substance the distance between the walls increases almost by a factor of two before a thin neck forms due to the plastic deformations and eventually breaks. To quantify ductility of the system we use the percent of elongation of the system before breaking as given by
| (2) |
where, is the initial (before pulling) length of the system along the tension direction ( direction ) and is the final length before the system breaks into two parts.
III RESULTS
In this section we present results from our simulations following the protocols described for each of the models. The bulk of our results are for the solid described by Model A. We show later that our main finding, i.e. the close relationship between the vibrational density of states and fracture behaviour of solids is also borne out in Model B.
III.1 Model A:


In Fig. 1 the snapshots of a brittle (top panel) and ductile material (bottom panel) under uniaxial strain, clearly show that brittle and ductile materials respond to external strain very differently. In the case of a brittle material, the material cannot withstand strain for a large deformation and hence it fails quickly while for a ductile material there is a neck formation which helps it to withstand strain for a longer period. This behavior can be quantified using the parameter as described in the previous section. In the upper panel of Fig. 3, we show the dependence of as a function of increasing range of interaction of the inter-particle potential, for the two dimensional glass forming liquids. One can clearly see that the ductility parameter modeled by is somewhat small and does not increase much until the interaction range starts to include the second neighbours. The first neighbour shell is up to a distance in units of inter-particle diameter as obtained from the dip of pair correlation function, after the first peak. then somewhat sharply increases once is increased beyond the first interaction shell and then tend to saturate once the interaction range increases beyond the second neighbour distance. Similar behaviour is observed for the three dimensional system as shown in the lower panel of Fig.3 although the increase in is somewhat smoother than two dimensional system.


Another thing to notice is that the variation of with the cut-off range of the inter-atomic potential in two and three dimensions are quite large. The value of changes almost times when we vary the cut-off from to for the two dimensional system, while for the three dimensional system the change is approximately times. Hence, in both the systems we could see that as the cut-off increases the amount of plastic deformation that the system can withstand also increases dramatically before failure. This can be attributed to the variation in the number of neighbors of the atoms as we change the cut-off. Cut-off value of corresponds to the first peak in the radial distribution function for the system. So in this case, the potential range is shorter than the first shell of the neighbors. Hence in this case, while the system is subjected to an external strain if any cavity forms which is larger than the first shell of neighbors it will not heal since there will be no attractive forces across it leading to abrupt failure. As we increase cut-off range more and more neighbors come in and we need a larger cavity to induce failure [13] or the mechanism of failure may change completely.
To understand what actually changes in the system with increasing interaction range that leads to the observed brittle to ductile transition, we calculated the vibrational density of states (VDOS) to investigate a possible relationship between the mechanical properties of the system with that of the vibrational properties of the system as suggested in [13, 24, 25]. The density of states were calculated from the eigenvalues of the Hessian matrix obtained at the potential energy minimum of the system explored at that temperature. The Hessian matrix is defined as where is the potential energy of the system which is a function of the particle coordinate with indicates the particle index and is different components of the space dimension (x, y or z). The potential energy is first minimized with respect to the particle coordinates using conjugate gradient methods and then used LAPACK routine to diagonalize the matrix which is matrix, where is the spatial dimension.
The resulting VDOS obtained as a function of is reduced to the form of , where is the dimensionality, and the reduced VDOS is plotted in Fig. 4. This is done so to plot only the excess part of the density of states over Debye density of state of ideal solid where . One can clearly see in Fig. 4, that the excess VDOS increases dramatically with increasing interaction range both in two and three dimensional model system. This strongly suggests that excess vibrational density of state intimately connected the mechanical properties of these systems as also suggested in Ref.[13].


The correlation between the excess VDOS and ductility of materials although suggest interesting connection between the low energy vibrational states with plasticity in the system but does not prove the unique dependence of ductility on excess VDOS. To understand whether excess VDOS can uniquely determine the ductility of any material, we have studied the brittle-ductile transition across the amorphization transition where the ratio of particle diameter of the binary glass forming liquids is changed systematically from 1. This way one can go from crystal to glassy state by tuning the ratio of particle diameter in the model. Notice that as we will be going from crystal to a glassy state with varying the diameter ratio, the excess VDOS will increase very sharply as an ideal crystal will not have any excess VDOS and it will gradually increase as one goes to amorphous solids. This is an ideal set up to understand the role of excess density of state in brittle ductile transition as the excess VDOS can be tuned very systematically.

In Fig. 5 we have shown the variation of with different values of the ratio of particle diameter, for two and three dimensional systems respectively. is the diameter of the A type particle and is the diameter of B type particle in a typical binary mixture. Size ratio corresponds to a mono-disperse system which will crystallize if the temperature is decreased below the freezing temperature. is varied from to the lowest size ratio of is similar to the size ratio used in the model system mentioned above. The interaction range is . In the top panel of Fig.5, the variation of is shown as a function of for two dimensional system and one can see that remains more or less independent of up to and then sharply decreases at and remains independent again up to . changes by a factor of in this model system. Similar behaviour is found for the three dimensional case with changes by a factor of . It is important to notice that the change of as a function of in both dimensions, remains very sharp, suggesting a possible sharp transition from brittle to ductile materials at a critical dispersity ratio .

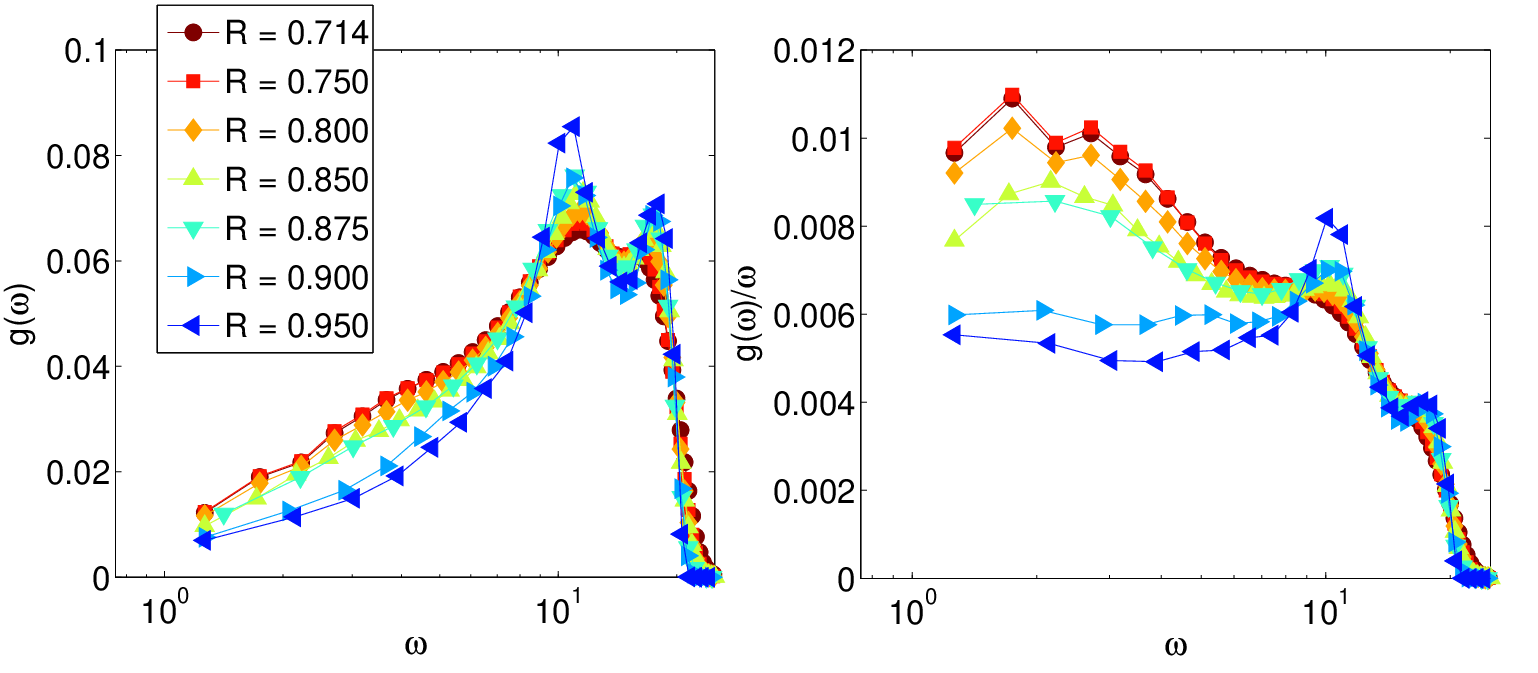
Now to prove the unique connection between the excess VDOS and the ductility we have calculated the VDOS for all these systems which are plotted in Fig.6. In top left panel of Fig.6, we have shown the VDOS for the two dimensional model system for different dispersity ratio and in right panel of the same figure the excess VDOS is plotted. One can clearly see that for , the excess VDOS is almost negligible as is almost independent of in the small limit and increases sharply once and becomes almost insensitive to change in for lower values. Similar behaviour is observed for the three dimensional case also.
These observation clearly establishes the one to one connection between the excess VDOS and the ductility of a material irrespective of whether it is a crystalline solid or an amorphous solids. As mentioned earlier, in [25], it was shown that mechanical properties of a slightly defected crystal with a very small density of vacancies is more close to a jammed amorphous solid than to the perfect crystal. They also pointed out that vibrational density of states of a solid with even a very high degree of crystallinity resembles more closely to that of the amorphous jammed solid. A sharp transition in mechanical and vibrational properties is also suggested in that work. Our work here similarly suggest a possible sharp brittle to ductile transition as one goes from crystalline to amorphous solid by changing dispersity parameter, . It further points out a one-to-one correspondence between the mechanical and vibrational properties of solids.
A very similar connection between the observed behaviour in our work and behaviour observed in fiber bundle model [32, 33] with increasing dispersity in the fiber strength is worth mentioning. The fiber bundle model is a simplistic model to understand fracture in materials. In this model, two plates are connected by fiber bundles and then the plates are loaded to mimic the tension experiments [32, 33]. The solid will then be modeled via the fiber in between the plates. Now if one takes the strength of these fibers to be same then it will model a homogeneous solid, but if one takes the strength of the fiber to be heterogeneous, then it will be closely mimicking the behaviour of an amorphous solids. In [34], one such model is studied with the strength of fibers taken from a Gaussian distribution of width . This disorder parameter , was then varied and the mechanical properties of the solid is studied. It was shown that as one increases the disorder parameter , the solid modeled by the fiber bundle model shows a brittle to ductile transition at a critical disorder strength . Our results seems to strongly suggest such a transition in realistic model materials [35], thereby providing a nice model system to test the prediction of these fiber bundle models for further improvement of these minimalistic models [36].
III.2 Model B:
So far we have tested the connection between the excess VDOS and the ductility for system where the interaction potential between two particles is isotropic. To test whether the same connection still holds for other model interaction potentials with anisotropic interaction, we have performed the similar analysis for a patchy colloid model described in the model and simulation details section before. This model at different temperature and density shows many interesting phases (see [30] for further details and the phase diagram), e.g triangular, honeycomb, square lattice and their corresponding phase coexistence. For a large portion of the phase diagram, this model also shows amorphous structure. In this case, an amorphous solid may be formed by quenching relatively rapidly into a region of the phase diagram where there are many competing crystalline states. The solid, instead of selecting between these almost degenerate free energy minima corresponding to very different structures, chooses to remain amorphous or forms microscopic crystallites each with wildly varying local coordination.
We perform loading experiments using the protocol described in section II for this model solid at two representative states. Both the solids are at a number density , where the system at low temperature forms a honeycomb lattice. The first state is crystalline with two dimensional honeycomb order obtained by arranging particles in an initial crystalline order and equilibrating the structure at the chosen density and temperature. The second state, at the same density, is amorphous and is formed by a temperature quench from the high temperature liquid. Note that this amorphous structure is clearly in a state of dynamic arrest.
For the crystalline state one has no excess density of state over the Debye theory and for the amorphous state there is an excess of states as shown in Fig.7a. Now, according to our previous observations, the state with excess VDOS should be more ductile than the one with less excess VDOS. It is indeed true that the amorphous state with excess VDOS can withstand longer tensile strain and bears , while the pure crystalline state with less VDOS breaks like a brittle materials with . Fig.7b shows one instance of fracture each in the crystalline and amorphous states obtained for the patchy colloidal system with different preparing protocol. The crystalline state shows a sharp fracture while the amorphous state seems to show more heterogeneous fracture profile. The increase in low frequency vibrational states for the amorphous structure is quite dramatic. Thus we believe that the excess VDOS uniquely captures the mechanical behaviour of a solid with any form of inter-atomic interaction potential and irrespective of whether it is in a crystalline or amorphous state.
IV Conclusions
In conclusion, we have done extensive MD simulation of different glass forming liquids with both isotropic and anisotropic pairwise interactions to understand the microscopic origin of ductility in amorphous solids. There has been many attempts to link macroscopic mechanical properties of solids such failure mechanism with microscopic “atomic” interactions. For example, extensive calculations and analysis of known experimental data for a number of metallic and non-metallic solids by Rice and Thomson [37] shows that ductility in solids is related to the ability of a crack tip to nucleate dislocations. Such dislocations nucleated at crack tips blunt the crack and produce ductile behaviour. A confirmation of this scenario has been found recently in the computer simulations [38, 39] where dislocation tangles surrounding cracks in ductile materials is readily observed in large scale computer simulations.
In this paper, on the other hand we find a different kind of correspondence. We observe that ductility of a material is intrinsically connected to excess density of vibrational states over the Debye density of state of an ideal solid. Findings of Goodrich et.al. [25], clearly suggest that excess vibrational density of state is a unique characteristic of the material which strongly connects to the mechanical property of the system. They also showed that solid with not perfect but large crystalline order show properties closely matching with that of an amorphous jammed solid than ideal crystal with defects. The vibrational density of state of these systems becomes very close to that of an amorphous solids. Here we showed that excess vibrational density of states uniquely determines the ductility of an amorphous solids under external tensile load. We also showed that there exists a sharp brittle to ductile transition as one drives the system from crystalline to amorphous state via amorphization transition which is in close agreement with the predictions of minimalistic fiber bundle model [34]. It will be nice in future to understand in details this transition by doing extensive finite size scaling analysis. Study along these directions are in progress and will be published else where [36] Our results on the patchy colloidal model also confirms that the reported results are rather generic for any glass forming liquids.
Is there a connection between VDOS and the ability of the solid to produce dislocations? While a complete answer to this very interesting question has not been found, there are intriguing possibilities. In [40] it was shown that probability of formation of defects in crystalline solids depends on the amplitude of certain non-affine displacement fluctuations [41] which act as precursors. Non-affine defect precursors also cause instabilities in the crystal leading to mode softening which may, in turn enhance the VDOS in the small frequency regime. We thus feel that our finding of direct connection between excess density of vibrational states and plasticity in amorphous solid as well as crystalline solids will help us better understand plasticity in these materials within an unified theoretical framework.
References
- [1] A. Cavagna, Phys. Rep. 476, 51 (2009).
- [2] P. G. Debenedetti and F. H. Stillinger, Nature 410, 259 (2001).
- [3] J. Horbach, W. Kob, and K. Binder, 77, 297 (1998).
- [4] W. Kob and H. C. Andersen, Phys. Rev. Lett. 73, 1376 (1994).
- [5] S. Sastry, P. G. Debenedetti, and F. H. Stillinger, Nature 393, 554 (1998).
- [6] G. Biroli, J.-P. Bouchaud, K. Miyazaki, and D. R. Reichman, Phys. Rev. Lett. 97, 195701 (2006).
- [7] G. Biroli, J.-P. Bouchaud, A. Cavagna, T. S. Grigera, and P. Verrocchio, 4, 771 (2008).
- [8] S. Karmakar, C. Dasgupta, and S. Sastry, Proc. Nat. Acad. Sci. USA 106, 3675 (2009).
- [9] L. Berthier and G. Biroli, Rev. Mod. Phys. 83, 587 (2011).
- [10] S. Karmakar, C. Dasgupta, and S. Sastry, Annu. Rev. Condens. Matter Phys. 5, 255 (2014).
- [11] A. L. Greer and E. Ma, MRS Bulletin 32, 611 (2007).
- [12] W. L. Johnson, M. D. Demetriou, J. S. Harmon, M. L. Lind, and K. Samwer, MRS Bulletin 32, 644 (2007).
- [13] Oliver Dauchot, Smarajit Karmakar, Itamar Procaccia, and Jacques Zylberg, Physical Review E 84, 046105 (2011).
- [14] GN Greaves, AL Greer, RS Lakes, and T Rouxel, Nature Mater. 10, 823–837.
- [15] AL Greer, YQ Cheng, and E Ma, Mater. Sci. Eng. R .
- [16] E. R. Weeks, J. C. Crocker, A. C. Levitt, A. Schofield, and D. A. Weitz, Science 287, 627 (2000).
- [17] M. D. Ediger, Annu. Rev. Phys. Chem. 51, 99 (2000).
- [18] F. Ritort and P. Sollich, ADP 52, 219 (2003).
- [19] V. Lubchenko and P. G. Wolynes, Annu. Rev. Phys. Chem. 58, 235 (2007).
- [20] G. Biroli and J.-P. Bouchaud, Structural Glasses and Supercooled Liquids: Theory, Experiment, and Applications , 31 (2012).
- [21] J.-P. Bouchaud and G. Biroli, J. Comp. Phys. 121, 7347 (2004).
- [22] Y Zhang, W H Wang, and A L Greer, Nature Materials 5, 857 (2006).
- [23] I. Procaccia and J. Zylberg, Phys. Rev. E 87, 012801 (2013).
- [24] Hideyuki Mizuno, Stefano Mossa, and Jean-Louis Barrat, Europhysics Letters 104, 56001 (2013).
- [25] Carl P. Goodrich, Andrea J. Liu, and Sidney R. Nagel, Nature Physics 10, 578 (2014).
- [26] S. Plimpton, Journal of Computational Physics 117, 1 (1995).
- [27] W. Humphrey, A. Dalke, and K. Schulten, Journal of Molecular Graphics 14, 33 (1996).
- [28] H. C. Hamaker, Physica 4, 1058–1072 (1937).
- [29] R. Everaers and M. R. Ejtehadi, Physical Review E 67, 041710 (2003).
- [30] Chandana Mondal, Smarajit Karmakar, and Surajit Sengupta, The Journal of Physical Chemistry B 0, null (0), pMID: 25806836, http://dx.doi.org/10.1021/jp512952u .
- [31] Groot. R. D. and Warren, P. B., J Chem Phys 107, 4423 (1997).
- [32] S. Pradhan, A. Hansen, and B. K. Chakrabarti, Rev. Mod. Phys. 82, 499 (2010).
- [33] H. Kawamura, T. Hatano, N. Kato, S. Biswas, and B. K. Chakrabarti, Rev. Mod. Phys. 84, 839 (2012).
- [34] S. Biswas, S. Roy, and P. Ray, Phys. Rev. E 91, 050105 (2015).
- [35] S. Zapperi, P. Ray, H. E. Stanley, and A. Vespignani, Phys. Rev. Lett. 78, 1408 (1997).
- [36] Kallol Paul, Jeetu S. Babu, Ratul Dasgupta, and Smarajit Karmakar, manuscript under preparation (2015).
- [37] Rice J.R. and Thomson R., Philosophical Magazine 29, 73 (1974).
- [38] A. Hartmaier and P. Gumbsch, Journal of Computer-Aided Materials Design 6, 145 (1999).
- [39] Glenn E. Beltz, L. Blumberg Selinger, Kyung-Suk Kim, and Michael P. Marder, Fracture and Ductile vs. Brittle Behavior — Theory, Modelling and Experiment, MRS Proceedings (Cambridge University Press, 1999).
- [40] S. Ganguly, S. Sengupta, and P. Sollich, Soft Matter 11, 4517 (2015).
- [41] S. Ganguly, S. Sengupta, P. Sollich, and M. Rao, Phys. Rev. E 87, 042801 (2013).