Velocity-resolved [C ii] emission and [C ii]/FIR Mapping along Orion with Herschel *,***,**footnotemark: *,** Note: Accepted for publication in the Astrophysical Journal, 2015 August 12
Abstract
We present the first 7.5′11.5′ velocity-resolved (0.2 km s-1) map of the [C ii] 158 m line toward the Orion molecular cloud 1 (OMC 1) taken with the Herschel/HIFI instrument. In combination with far-infrared (FIR) photometric images and velocity-resolved maps of the H41 hydrogen recombination and CO =2-1 lines, this data set provides an unprecedented view of the intricate small-scale kinematics of the ionized/PDR/molecular gas interfaces and of the radiative feedback from massive stars. The main contribution to the [C ii] luminosity (85 %) is from the extended, FUV-illuminated face of the cloud (500, 5103 cm-3) and from dense PDRs (104, 105 cm-3) at the interface between OMC 1 and the H ii region surrounding the Trapezium cluster. Around 15 % of the [C ii] emission arises from a different gas component without CO counterpart. The [C ii] excitation, PDR gas turbulence, line opacity (from [13C ii]) and role of the geometry of the illuminating stars with respect to the cloud are investigated. We construct maps of the [C ii]/ and / ratios and show that [C ii]/ decreases from the extended cloud component (10-210-3) to the more opaque star-forming cores (10-310-4). The lowest values are reminiscent of the “[C ii] deficit” seen in local ultra-luminous IR galaxies hosting vigorous star formation. Spatial correlation analysis shows that the decreasing [C ii]/ ratio correlates better with the column density of dust through the molecular cloud than with /. We conclude that the [C ii] emitting column relative to the total dust column along each line of sight is responsible for the observed [C ii]/ variations through the cloud.
Subject headings
H ii regions — galaxies: ISM — infrared: galaxies — ISM: cloudsI. Introduction
The −- fine structure line (/91 K) of ionized carbon, [C ii] 158 m, is one of the most important cooling lines of the cold neutral medium [29] and among the brightest lines in photodissociation regions [58, PDRs, e.g.,]. Early observations showed that the line is very luminous [104], carrying from 0.1 to 1 % of the total far-IR (FIR) luminosity of galaxies [26]. The neutral carbon atom has an ionization potential of 11.3 eV, so that the ion C+ traces the H+/H/H2 transition, the critical conversion from atomic to molecular ISM. As a consequence, [C ii] emission/absorption from different ISM phases is expected. Recent velocity-resolved line surveys show that the average contribution to the [C ii] emission in the Milky Way is the H2 gas illuminated by far-UV (FUV; 6-13.6 eV) photons (55-75 %), the cold atomic gas (20-25 %) and the H ii ionized gas (5-20 %) [93, 94].
Star-forming complexes hosting massive OB stars are irradiated by strong FUV fields and most of their [C ii] emission is likely to arise from dense PDRs at the interface between H ii regions and their parental molecular cloud [112, e.g.,]. Therefore, the [C ii] 158 m line traces the FUV radiation field from massive stars and indirectly, the star formation rate (SFR) [113, 94, 53, e.g.,]. As in the Milky Way, the [C ii] emission in nearby galaxies is widespread and ultimately related to the star formation activity [101, 78, 60]. In addition, an undetermined fraction of the [C ii] arises from the diffuse neutral gas [75] and from the H ii ionized gas, the latter varying from 5 to 50%, depending on the ionizing radiation strength and electron density [1, e.g.,].
In normal and starburst galaxies, the [C ii]-to-FIR luminosity11 1 In this work we refer to the luminosity () computed in power units (erg s-1 or ). The conversion from velocity-integrated line intensities v = (K km s-1), with the continuum-subtracted brightness temperature (see Section II), to line surface brightness (), is =2 . For the [C ii] 158 m and CO =2-1 lines respectively, the conversion is (erg s-1 cm-2 sr-1)=7.010-6 (K km s-1) and 1.310-8 (K km s-1). ratio ([C ii]/) is in the 10-2 to 10-3 range. Low metallicity dwarf galaxies show the highest ratios [76, 10-2, e.g.,], whereas observations with ISO showed that local ultra-luminous galaxies (ULIRGs, 1012 ) display a deficiency, [C ii]/10-4, that is not straightforward to interpret [77, 74]. This fractional luminosity deficiency has been confirmed with new observations of ULIRGs, hosting intense star formation and often associated with galaxy mergers [47, 46, e.g.,]. This deficit, however, does not necessarily hold in the early Universe at high- [113, 18, e.g.,].
Interestingly, while it is difficult from the ground to detect the [C ii] emission in the local Universe (balloon, airborne, or space telescopes are needed to overcome the low atmospheric transmission at 158 m), the line does become accessible to ground-based submm observatories such as ALMA at redshifts 1. Indeed, the [C ii] line has been detected toward young galaxies [97, 21].
Most of the [C ii] emission arising from PDR gas in the Milky Way is associated with modest average FUV radiation fields, between 1-20 [93] and 100 [28], with the mean interstellar FUV field in Habing units [52, =1 is equal to 1.610-3 erg cm-2 s-1,]. These radiation fields are likely not representative of the efficient massive star forming modes expected in ULIRGs showing [C ii]/ deficits. Galactic high-mass star-forming regions, however, offer a more interesting template in which to investigate the [C ii] emission in the more extreme irradiation conditions prevailing these active galaxies. The Orion molecular cloud 1 (OMC 1), in the Orion A complex, lies behind the Orion Nebula cluster [86, e.g.,] and is the nearest (414 pc), and probably most studied high-mass star-forming region of the Milky Way [37, e.g.,].
OMC 1 is directly exposed to the UV radiation emitted by young massive stars in the Trapezium cluster, located 0.3 pc in front of the molecular cloud [11, e.g.,]. A region of several parsecs in size is exposed to FUV fluxes much higher than the average in the Milky Way [112, 73, 102, e.g.,]. The Trapezium stars have created a blister H ii region that on the far side is bounded by the molecular cloud. The most famous H ii/OMC 1 interface is the Orion Bar PDR (the “Bright Bar” seen in the visible-light images), a protrusion of OMC 1 in which the neutral cloud acquires a nearly edge-on geometry and thus the optically thin PDR emission is limb-brightened [56, 27, and references therein]. On the near side, toward the observer, several components of neutral atomic gas revealed by H i absorption cover the nebula, the Orion’s Veil [123, e.g.,].
Intermediate- and high-mass star formation is currently taking place in two locations: the Becklin-Neugebauer/Kleinmann-Low (BN/KL) region within OMC 1 [16, 117], and Orion South (S), an isolated molecular core located within the ionized gas cavity in front of OMC 1 [88, e.g.,]. Therefore, Orion is a unique region to study the spatial distribution of [C ii] and related quantities ([C ii]/, [C ii]/, /, etc.) in well characterized environments (dense PDRs, shocks, H ii regions, and lower density quiescent gas).
The [C ii] 158 m line has been previously mapped toward OMC 1 at low angular (55′′) and spectral (67 km s-1) resolution with the Kuiper Airborne Observatory [112, 54, KAO,] and also with balloon-borne FIR telescopes [80, e.g.,]. Pointed observations toward the Trapezium cluster region were also carried out by Boreiko & Betz [17] with a heterodyne receiver on board KAO. These observations employed a velocity resolution of 0.5 km s-1 and allowed the detection of two of the three [13C ii] hyperfine line components. The HIFI instrument [30] on board Herschel [92] allowed us to spectrally resolve (0.2 km s-1 resolution) and to map the [C ii] 158 m line with unprecedented sensitivity and angular resolution (11.4′′). Velocity-resolved spectroscopy offers the best way to characterise the origin of all possible [C ii] emission components and their kinematics. In addition, it allows one to map [13C ii] and estimate the [C ii] line opacity, a critical parameter to determine C+ column densities [111, 17, 45, 90].
In this work, we present initial results from a Herschel Open-Time program (OT1_jgoicoec_4) devoted to the spatial and velocity structure of the ionized and the warm molecular gas in OMC 1. In particular we present a large-scale velocity-resolved map of the [C ii] 158 m line, complemented by a map of the H41 recombination line, and existing CO =2-1 and FIR photometric observations. The paper is organized as follows. In Section II we present the data set. The [C ii] spatial distribution and gas kinematics is studied in Section III. In Section IV we analyze the [C ii] 158 m non-LTE excitation and derive C+ column densities. A spatial correlation analysis of different quantities often used in the extragalactic discussion is also carried out. Finally, our results are discussed in the context of the [C ii], CO and FIR diagnostic power and their link with the extragalactic emission.

II. Observations and Data Reduction
II.1. [C ii], H41 and CO 2-1 Heterodyne Observations
The [C ii] line at 1900.537 GHz [25] was mapped over a total area of 7.5′11.5′ (0.9 pc 1.4 pc) in 2012 August, using the HIFI instrument on board Herschel. A pair of Hot Electron Bolometer mixers was employed to observe the [C ii] line in HIFI band 7b in two orthogonal polarizations. We used the Wide Band Acousto-Optical Spectrometer providing a spectral resolution of 1.1 MHz and a bandwidth of 2.4 GHz (0.2 km s-1 and 380 km s-1 at 1900.5 GHz, respectively).
| Frequency | ||||
|---|---|---|---|---|
| Species | Transition | (GHz) | (K) | (s-1) |
| 12C+ | - | 1900.5369a | 91.21 | 2.32(6) |
| 13C+ | - | |||
| =1-0 | 1900.9500a,b | 91.23 | 1.55(6) | |
| =2-1 | 1900.4661a,b | 91.25 | 2.32(6) | |
| =1-1 | 1900.1360a,b | 91.23 | 7.73(7) | |
| CO | =2-1 | 230.5379 | 16.60 | 6.92(7) |
| H41 | =42-41 | 92.0344c | 89.50 | 4.85(1) |
Three 7.5′4′ On-The-Fly (OTF) submaps of 3 h each were needed to cover the region with a 10′′ sampling (ObsIDs: 1342250415, 1342250414 and 1342250412). The half-power beam width (HPBW) of HIFI at these frequencies is 11.4′′, i.e., the map is not fully sampled. Because of the large scale [C ii] emission [112] and risk of contaminating emission in the reference position, the OTF maps were performed using the Load-Chop referencing scheme [100]. In this mode, an internal chopper alternates between the sky and an internal cold load as the telescope slews over a scan leg. Although a nearby reference position (at a radial offset of 9′ from the map centre) was also observed, we reprocessed the data without subtracting this reference emission from the on-source data, therefore being insensitive to line contamination from self-chopping. The resulting data are mostly affected by so-called Electrical Standing Waves, that were removed in HIPE22 2 HIPE is a joint development by the Herschel Science Ground Segment Consortium, consisting of ESA, the NASA Herschel Science Center, and the HIFI, PACS, and SPIRE consortia. using the doHebCorrection task [63]. The residual optical standing waves resulting from resonances against the internal hot load (100 MHz period) and the diplexer optics (625 MHz) were treated using the FitHifiFringe task in HIPE. The three sub-maps were then compared pair by pair in a region of 7.5′0.6′ where they overlap on the sky. Antenna temperatures () were extracted for each overlapping pixel and [C ii] velocity channel. Scatter plots were formed to derive the inter-calibration factor between the respective coverage in each channel. We derived linear slopes deviating from unity by 5% between pairs of sub-maps. Since we cannot know a priori which map corresponds to the true intensity, we re-adjusted the fluxes by 2.5% depending on the sub-map, i.e. re-calibrated with respect to the mean intensities in the overlapping regions.
Through this work we use the main beam temperature scale ( in K) as opposed to . Given the latest HIFI efficiencies, both scales33 3 See: http://herschel.esac.esa.int/twiki/pub/Public/HifiCalibrationWeb/HifiBeamReleaseNote_Sep2014.pdf are related by 1.64 . For semi-extended (not infinite but larger than the main beam width of Herschel/HIFI) emission sources of uniform brightness temperature (), the main beam temperature is the most appropriate intensity scale (). The achieved rms noise was typically 1.5 K (1) per 0.2 km s-1 resolution channel and position. This rms is only a factor of 2.5 worse than that achieved by Boreiko & Betz [17] in their deep pointed observations after an integration of 3 h. Figure 1 (right) shows the baseline-subtracted [C ii] integrated line intensity map.
The H41 millimeter recombination line at 92.034 GHz was mapped with the IRAM-30m telescope at Pico Veleta (Spain) using the E090 receiver and the 200 kHz FFTS backend in 2013 November. The HPBW at this frequency is 27′′ and the typical rms noise in the map is low, 0.05 K per 0.65 km s-1 resolution channel. In this work we also make use of part of the high-sensitivity CO 2-1 large-scale map (10.8∘) at 230.538 GHz obtained by Berné et al. [14] with the multi-beam receiver HERA, also at the IRAM-30m telescope. The spectral and angular resolutions are 320 kHz and 11′′, respectively. The achieved rms noise is 0.2 K per 0.4 km s-1 channel [14, see]. Both H41 and CO 2-1 OTF maps are fully sampled.
Herschel/HIFI and IRAM-30m data were processed with the GILDAS/CLASS software. Figures 1, 6, and 7 show the [C ii] 158 m, H41 and CO 2-1 emission at their native angular resolutions but resampled to a common velocity grid of 0.65 km s-1. Offsets of selected positions are given with respect to the center of the [C ii] map: : 5h35m17.0s, : 22′33.7′′. Table 1 summarizes the main spectroscopic parameters of the lines discussed in this work. To match the FIR photometric observations and carry out a combined analysis, the line maps were also gridded and convolved to an uniform angular resolution of 25′′ (0.05 pc).


II.2. Photometric Observations and SED Fits
In order to determine the FIR luminosity44 4 from 40 to 500 m [105] and using =414 pc. and the dust continuum opacity toward each position of the [C ii] map, we also make use of fully sampled calibrated images of OMC 1 taken with the Herschel/SPIRE and PACS55 5 The central region of the photometric image (BN/KL outflows and IRc sources) contain saturated data points that are not used in our analysis. cameras [50, 96] at 70, 160, 250, 350 m photometric bands (from programs GT2pandre and OT1nbillot), and with JCMT/SCUBA2 at 850 m [57, project JCMTCAL;].
We convolved all the photometric images to a 25′′ resolution (that of the 350 m image) and fitted the resulting spectral energy distribution (SED) per 12.5′′-pixel with a modified black body at an effective dust temperature ();
| (1) |
where is the solid angle subtended by each pixel. Fit examples are shown in the Appendix. The dust continuum opacity is parametrized as , with the dust opacity close to the [C ii] 158 m line, and a grain emissivity index. The resulting and maps, where we have allowed to be a free parameter of the fits, are shown in Figures 8(a) and (f). The mean value is 2.40.5 (1) but we note that the derived FIR luminosities and dust opacities, the relevant quantities for our analysis, do not change significantly by fixing to a constant value of 2. We also estimated the pixel-averaged gas column density and mass. In particular, we used the SPIRE 250 m image assuming that it corresponds to optically thin dust emission and computed the equivalent gas mass per pixel as:
| (2) |
[55], where is the 250 m flux density within , is the gas-to-dust mass ratio and is the dust absorption cross-section divided by the dust mass. We adopt /=25 gr cm-2, computed from grain properties taken from Draine’s tabulations [70, and references therein] for a grain size distribution that leads to a / ratio compatible with observations of Orion (see Section III.2).
III. Results
III.1. Global Morphology of the [C ii] 158m Emission
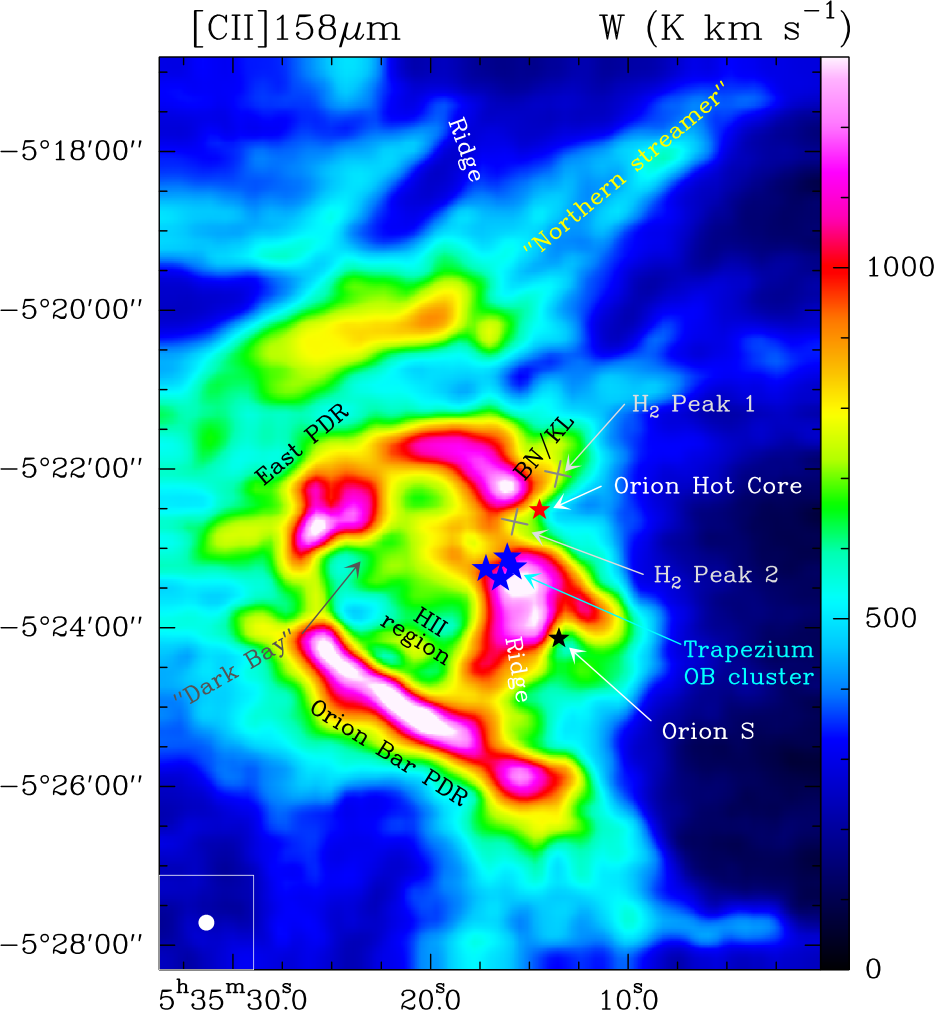
Figure 1 (left) shows a composite image of OMC 1 in the integrated line emission of CO 2-1 (red), [C ii] 158 m (blue) and H41 (green). This image shows the H ii/PDR/molecular gas stratification expected in molecular clouds irradiated by strong UV fields from nearby massive stars.
The H41 recombination line traces dense ionized gas from the blister H ii region surrounding the Trapezium. The H41 line peaks near the OB stellar cluster and is also bright adjacent to the Orion Bar PDR. Despite the different angular resolutions, the H41 emission morphology is similar to the brightest regions seen in the visible-light H images of the Orion Nebula (M42) [99, Figure 2 left;].

Figure 3 shows [C ii], CO 2-1 and H41 spectra extracted from representative lines of sight toward OMC 1, namely the northern streamer, BN/KL, the Trapezium, the Orion Bar, the East PDR, and the extended cloud face in the south. OMC 1 has an overall face-on geometry, with the molecular cloud located 0.3-0.6 pc behind the ionizing stars [56, 123, e.g.,]. Therefore, the observed 10-15 km s-1 blue-shift of the H41 line relative to the [C ii] and CO lines (Figure 3) is consistent with streamers of ionized gas escaping from the high-pressure H ii/OMC 1 interface and moving toward the observer [37, e.g.,].
The regions of brightest [C ii] 158 m emission delineate the far edges of the H ii blister and follow a roughly spherical shell distribution (as projected in the plane of the sky) with emission peaks near the Trapezium, at the east of BN/KL (that we refer to as the “East PDR”) and along the Orion Bar PDR (Figure 1 right). These “interface” regions show very bright [C ii] emission, with main beam temperature peaks of 150 K (or a surface brightness of 510-3 erg s-1 cm-2 sr-1 for the average v5 km s-1 line-width, see Figure 3). In addition, a more extended component of fainter [C ii] 158 m emission exists. In particular, the average line peak temperature in the map is 70 K. This reflects the presence of a lower density and cooler component, the extended FUV-illuminated “face” of OMC 1 previously detected in [C ii] at lower angular and spectral resolutions [112, 54]. This extended component is also seen in the wide-field images of M42 taken in the emission from other low ionization potential (13.6 eV) atoms (see the reddish nebular emission in Figure 2 taken with the [S ii] filter in the visible). It is also seen in the near-IR vibrationally excited H2 emission attributed to large-scale FUV fluorescence [73].
Most of the [C ii] (and obviously CO) emission is expected to arise from the neutral cloud. This can be readily seen from the similar [C ii] 158 m and CO 2-1 line profiles and also similar line peak velocities (Figure 3). At the small spatial scales revealed by our observations (5000 AU), however, both the integrated intensity map (Figure 1 left) and the velocity channel maps (Figure 7) show that the [C ii] and CO 2-1 spatial distribution does not exactly match. This is more obvious toward (nearly) edge-on PDRs, like the Orion Bar, because the irradiated cloud edge (emitting [C ii]) can be resolved from the more shielded molecular gas, where CO reaches its abundance peak (3 mag for dense gas and strong FUV fields, see the representative model in Fig. 5).
The integrated intensity maps also reveal regions of moderately bright [C ii] 158 m emission, but very weak CO emission counterpart (northeastern areas). In addition, they show regions, such as the shocked gas toward H2 Peaks 1 and 2 in Orion BN/KL outflows, where the CO line luminosities are exceptionally high [43, see also].
Finally, Figure 4 shows the good spatial correspondence between the [C ii] 158 m integrated intensity (contours) and the Spitzer/IRAC 8 m emission [79, e.g.,]. This image is dominated by fluorescent IR emission from PAHs [4, after absorption of UV photons, e.g.,] and by very small grain emission, with minor contribution from [Ar iii] toward the H ii region and from H2 lines toward particular positions of enhanced shocked gas emission [103].
III.2. Template Regions and Representative PDR Model
Based on our knowledge of Orion [37, 112, 11, e.g.,], and in order to ease the interpretation of the [C ii] and related maps, we introduce three different template regions (or sightlines). We first consider a 200′′ (0.4 pc) radius circle centered on Ori C, the brightest star of the Trapezium (e.g., the white dotted circle shown in Figure 4). We define the “extended cloud face” component for positions outside this circle. Secondly, a small 0.1 pc circle around the Trapezium defines lines of sight that go through the “H ii region” component around the H41 emission peak. Finally, we consider a spherical shell, or annulus, delineated by the =0.16 pc and =0.24 pc circles. This region represents “PDR interfaces” between OMC 1 and the H ii region. These PDRs (specially the Bar) show a more edge-on configuration and are illuminated by the strong, almost unattenuated, UV field from the Trapezium stars.
To guide our interpretation, Figure 5 shows the predicted structure of the H/H2 and C+/C/CO transitions as a function of visual extinction () for physical conditions (=2104 and =2105 cm-3) representative of the H ii/OMC 1 interface near the Trapezium (see Section IV). This homogeneous, stationary slab cloud model was computed with the Meudon PDR code [68]. We adopted [C/H]=1.410-4 [109, from HST absorption observations towards the star HD 37021 in the Trapezium,] and a flat extinction curve compatible with observations of Orion [69, 22, 5, 2]. In particular, an extinction to color index ratio () of 5.5, and =3.510-22 mag cm-2 were adopted. These values are different than the standard grain properties used in diffuse cloud models ( and =5.310-22 mag cm-2) and are consistent with larger than standard size grains in Orion. Larger grains lead to an increased penetration of FUV photons, larger size of the C+ zone ((C+)1 mag), higher C+ column densities, and shift the peak CO formation layer to larger deeper inside the cloud [42, see also].
More in general, an ionization front can move into the molecular cloud. Ionized gas will rapidly photoevaporate from the cloud surface and the PDR structure will not be in equilibrium [15, e.g.,]. Thus, dynamical effects might alter the picture shown in Figure 5. Non-stationary PDR models predict that a well defined C+/CO transition layer always exists, although the layer is slightly shifted closer to the cloud surface (by only 0.5 for / conditions appropriate to OMC 1) due to advection of CO from inside the cloud [115]. Since the predicted C+ column density in these models does not vary much compared to that in stationary models, the general predictions shown in Figure 5 for C+ should remain valid.


III.3. Kinematics: [C ii] 158 m Velocity Channel Maps
Figures 6 and 7 show continuum-subtracted [C ii] 158 m velocity channel maps compared to those of H41 and CO 2-1 lines respectively. Both figures show the emission in 1 km s-1 velocity channels from v to km s-1 ([C ii] 158 m in colored maps and H41 or CO 2-1 lines in white contours). They reveal the intricate small spatial-scale kinematics of the ionized/PDR/molecular gas interfaces.
The velocity-centroid of the molecular cloud emission66 6 The Orion A molecular complex to which OMC 1 belongs shows a velocity gradient of 0.7 km s-1 pc-1 over 25 pc [10, e.g.,]., traced by CO, lies at v(8-10) km s-1. The [C ii] 158 m spectrum average over all mapped positions is characterized by a very bright component peaking at v km s-1, with a line-width of 5 km s-1 (lowest panel in Figure 3), in agreement with CO velocity and line widths.
This emission mostly arises from the H ii/OMC 1 interfaces close to the Trapezium (inside the 200′′ radius circle) and also from the large-scale FUV-illuminated face of the molecular cloud (outside). Therefore, the main [C ii] spectral component that coincides with CO (vLSR5-17 km s-1) is dominated by C+ in dense PDR gas and represents 85 % of the total [C ii] luminosity in the map. The emission is so bright that the [13C ii] =2-1 line, the strongest [13C ii] hyperfine component [90], is also detected toward the highest column density peaks (see the inset in Figure 3 and the channel maps between 17 and 20 km s-1 in Figures 6 and 7).
Other specific regions such as the Orion Bar PDR show [C ii] line peak velocities at v(10-12) km s-1 and thus have a slightly differentiated kinematics. In fact, [C ii] shows widespread emission in a broad range of velocities outside the main spectral component range. On the other hand, the CO 2-1 emission range is much more restricted, with the high velocity CO emission seen at 0 km s-1 and 15 km s-1 being very localized, and mostly arising from the molecular outflows surrounding Orion BN/KL and S.
Despite the relatively flat [C ii] intensity distribution suggested by previous lower resolution observations, the [C ii] channel maps show complicated structures and velocity patterns. This is true even away from the Trapezium, where filamentary structures and emission striations are seen at several velocity intervals. At the v8-10 km s-1 velocity of the neutral cloud, the H41 emission delineates the far edges of the expanding H ii blister in close interaction with the cloud. This produces a bright shell-shaped [C ii] emission from compressed PDRs immediately beyond the ionization fronts. This is the signature of the UV radiation eating into the cloud.
Also at v8-10 km s-1, but away from the H ii region, [C ii] shows narrow striations or sheet-like structures that are roughly perpendicular to the main molecular ridge (north-to-south) and do not show much CO emission. As suggested by the overlap with the visible-light images of M42 (Figure 2), these photoevaporative [C ii] structures demonstrate that the entire field and velocity range is permeated by FUV photons.
The most negative velocities show H41 emission around the Trapezium. This is probably the edge of the H ii blister that is expanding toward the observer. The analogous [C ii] emission has some spatial correspondence but it also shows specific blue-shifted structures that do not follow the H41 emission and that must lie in the line of sight toward OMC 1.
III.3.1 C+ Gas with no CO Counterpart
In certain velocity ranges the observed [C ii] emission does not have any CO emission counterpart. The most outstanding structure with no, or very little, CO emission is a blue-shifted [C ii] emission “streamer” (vLSR=2 to 5 km -1) that goes north of Orion BN/KL and also a compact region that fills the cavity inside the bright [C ii] shell-like structure (Figure 2). These structures are not coincident with H41 emission tracing H ii gas, suggesting that they arise from warm neutral gas of low shielding (0-4 mag), in which very little or no CO exists (due to the elevated FUV field in the region and thus rapid photodissociation). Interestingly, they do coincide with foreground depressions of the visible-light emission known as the Dark Bay and the Northern Dark Lane that separates M42 and M43 nebulae (blue contours in Figure 2 ).
The column density of material in these structures is sufficient to have significant hydrogen in molecular form [19, consistent with the detection of radio OH lines in absorption toward the Dark Bay region, e.g.,]. Hence, they can be referred to CO-dark H2 gas [49, 126], which can also be detected by dust extinction of visible light [87]. In [C ii] emission, they represent large-scale structures of C+ gas surrounding OMC 1 and showing blue-shifted velocities relative to the molecular cloud (dark blue contours in Figure 2 right). In terms of luminosity, the [C ii] emission from v to 5, not related to OMC 1, accounts for 12% of the total [C ii] luminosity.
Surprisingly, the [C ii] line shows emission components at even more negative LSR velocities throughout the region, in particular in the v to 2 km s-1 range, and a fainter blue emission wing at v to 10 km s-1 (see spectra in Figure 3). Their combined contribution to the total [C ii] luminosity is however small, 3%.
Some of the structures showing [C ii] emission but no CO counterpart can be associated, both spatially and in velocity space, with particular regions of H i absorption observed against the radio continuum. They are produced by the “Veil”, a collection of absorbing H i layers in the line of sight toward Orion with little H2, less than one part in 106 [121, 2]. For a detailed explanation of the different H i absorbing velocity components (A, B, C, D …) see e.g., van der Werf et al. [123]. In particular, components A and B of the H i absorption maps, produce strong H i opacity in the vLSR0 to + km s-1 range. Components A and B are interpreted as a foreground veil of nearly atomic gas in front of the Orion nebula. Thus the [C ii] emission in the vLSR0 to + km s-1 range, and outside the Dark Bay and North Dark lane regions, likely arises from these neutral atomic layers of the Veil (cyan contours in Figure 2 right).
Component C of the H i absorption (from vLSR4 to km s-1) is only found at the southwestern edge of OMC 1 and we also detect [C ii] emission at those velocities and positions. Finally, H i absorption components D1 and D2 near the Bar appear in the vLSR20 to km s-1 range and are interpreted as an expanding shell of atomic gas [123]. The most blue-shifted [C ii] emission (vLSR10 km s-1) is detected toward the southern regions of the map. Hence, part of this [C ii] emission may arise from D1 and D2. In addition, a fraction of this blue-shifted [C ii] emission may arise from the foreground H ii region that lies between the Veil and the Trapezium, and that is not the main H ii region interacting with OMC 1. [N ii] 6585Å emission line, and P iii 1335Å and S iii 1190Å absorption lines centered at vLSR13 km s-1 arise from this foreground H ii region [2, e.g.,]. Unfortunately, the sensitivity of our [C ii] observations is insufficient to map these faint features and to determine a definite association.
H i emission tracing denser gas associated with the molecular cloud is detected at vLSR km s-1, outside the strong H i absorption range of the Veil. Indeed, we find specific regions that show coincident [C ii] and H i red-shifted emission. The brightest one is the Orion Bar, where both [C ii] and H i trace the most exposed PDR layers, in which H2 is photodissociated. In addition, an elongated [C ii] and H i emission feature without CO counterpart (vLSR km s-1) extends in the southwest direction beyond the Bar and along the Bar prolongation seen at visible wavelengths (Figure 2). Another remarkable emission feature is the high-velocity [C ii] and H i line-wing detected toward Orion BN/KL outflows. Its presence confirms that the shocked material is illuminated by FUV radiation [24, 43].
All in all, our observations demonstrate the link between [C ii] and both H i absorption (hydrogen mostly atomic gas) and H i emission (hydrogen predominantly molecular). In particular, 15% of the total [C ii] luminosity does not have a CO counterpart. Most arises from cold H i gas and from CO-dark H2 gas (e.g., the Dark Bay), but also from H ii gas. The contribution from ionized gas is expected to decrease with increasing electron density () and effective temperature () of the ionizing stars (as carbon becomes doubly ionized). Both quantities are high toward the Trapezium, 39,000 K for Ori C star [107], and (0.5-1)104 cm-3 in the surrounding H ii region [129]. For these conditions, models predict that the contribution of [C ii] from ionized gas is small, of the order of 10% of the PDR plus H ii emission [1]. This agrees with our general conclusion that most of the observed [C ii] luminosity in Orion arises from dense PDR gas.

III.3.2 [C ii] Line Broadening and C+ Gas Turbulence
The [C ii] 158 m line-width of the main spectral component varies between vFHWM3.5 km s-1 toward the extended “face” of OMC 1, 4.0 km s-1 toward the Orion Bar, and 5.5 km s-1 toward the Trapezium. The two latter values are likely affected by opacity broadening (see Section IV.1 for a determination of [C ii] opacities). In particular, for 1-3, opacity broadening increases the line widths by 10-30% [91, 90, e.g.,]. We note that the line widths of the C91 radio recombination line toward the Orion Bar are 2.0-2.5 km s-1 [128].
In the dense PDR gas traced by the [C ii] main spectral component inside the 200′′ radius circle, the gas temperature is 300-1000 K (see Figure 5 and Section IV.1.1), implying a thermal broadening of =( /)1/20.5-0.8 km s-1. The nonthermal velocity dispersion (from turbulence and macroscopic motions) is =()1/2 where =vFHWM/2.355. For the above line-widths and gas temperatures, one obtains =1.2-1.7 km s-1 (after opacity broadening correction). This has to be compared with the isothermal sound speed in the warm PDR gas, =( /)1/21.4-3.0 km s-1 (with the mean mass per atom). In other words, the nonthermal velocity dispersion in the dense PDR gas is subsonic or only weakly supersonic (with Mach numbers / of 0.4-1.2).
In the intermediate vLSR=2 to 5 km -1 components, the [C ii] line is narrower, for example vFHWM2.5-3.0 km s-1 toward the blue-shifted streamer that coincides with the North-Dark-Lane. On the other hand, the most blue-shifted [C ii] component with neither CO nor H41 counterpart, for example the features at vLSR7 km s-1 toward (150′′,300′′) or at vLSR5 km s-1 toward (37′′,274′′), show again broader line-widths of vFHWM4.7 km s-1 (Figure 3). Assuming optically thin [C ii] emission and 300 K, we find an increased 2 km s-1 (or /2) in these CO-dark components surrounding OMC 1. These results suggest that the gas turbulence is more strongly dissipated in the dense H ii/OMC 1 interfaces than in the surrounding, more turbulent, halo components.
III.4. Surface Luminosity Maps
Figure 8 shows maps of different luminosity77 7 Line luminosity per pixel integrating all [C ii] spectral components. and luminosity ratios that are often discussed in the context of star formation and galaxy properties [23, e.g.,].
III.4.1 Dust Opacity, Mass and Surface Density
Figure 8(a) shows a map of per pixel obtained by integrating the dust SED6 fits at each position. Despite the relatively small area covered (1.25 pc2), the FIR intensity exhibits variations of 3 orders of magnitude (excluding Orion BN/KL). is obviously high toward the high column density88 8 Using , with obtained from Equation (2). regions in the molecular ridge ( cm-2) and locally, it reaches even higher values toward the embedded star forming cores in Orion BN/KL. Figure 8(f) shows a map of the dust opacity () from Equation (1) for each line of sight. The observations reveal moderate FIR opacities toward Orion S and along the molecular ridge (). The FIR opacity then decreases from the Bar () to the extended regions (). Note that the 160 m dust emission toward Orion BN/KL is optically thick [1, 43, and Sect. V.4.1].
The total gas mass in the mapped region is computed from the optically thin dust emission at 250 m using Equation (2). For the assumed grain properties (see Section III.2), we derive in the 0.9 pc 1.4 pc mapped area [43, excluding Orion BN/KL that adds 100 ;]. This is equivalent to a surface density of 2000 pc-2. We note that a / ratio higher than the assumed in this work will increase our gas mass estimate and the -to- conversion value accordingly. Unfortunately, the exact grain composition and optical properties in molecular clouds like OMC 1 are not fully constrained [44], and they likely change on small scales [8]. Owing to the similar gas masses reported from large-scale 13CO and submm continuum mapping [10, 72, 14], we estimate that our and values are uncertain by a factor of 2.
| [C ii]/ | / | [C ii]/ | / | |||
|---|---|---|---|---|---|---|
| () | (Habing field) | |||||
| OMC 1 ………………………………… | 3.8(5.4)10-3 | 3.6(6.2)10-6 | 1200(900) | 43(27) | 7.5103 | 0.03(0.03) |
| (full mapaafootnotemark: ) | ||||||
| Extended Cloud ……………………. | 4.7(6.0)10-3 | 4.5(7.5)10-6 | 1400(900) | 35(20) | 3.2103 | 0.02(0.02) |
| (0.4 pc) | ||||||
| Dense PDR interface …………….. | 1.1(0.5)10-3 | 6.6(2.2)10-7 | 1600(500) | 87(24) | 3.3104 | 0.08(0.05) |
| (0.160.24 pc annulusaafootnotemark: ) | ||||||
| Toward H ii around Trapezium .. | 9.3(3.9)10-4 | 5.4(1.8)10-7 | 1700(400) | 126(18) | 3.3104 | 0.05(0.02) |
| (0.1 pc) |
III.4.2 [C ii]/ and [C ii]/ Maps
Figure 8(d) shows the spatial distribution of the [C ii]/ luminosity ratio toward OMC 1. [C ii]/ varies from the more extended and translucent cloud component, where cm-2 and [C ii] carries up to 1-5 % of the FIR luminosity, to the dense molecular ridge, where cm-2 and [C ii] only carries 0.01%. The mean (median) value in the map is [C ii]/. This is similar to the value observed toward translucent clouds of the Galaxy [59]. Indeed, low angular resolution surveys of the Milky Way show that the typical [C ii]/ ratio in regions of weak [C ii] emission is 410-3, and decreases to 10-3 toward star-forming regions where the [C ii] line is brighter [82, e.g.,].
The map per pixel in Figure 8(a) can be used to estimate, to first order, the spatial distribution of . Assuming that at large scales the entire column density of dust is heated by absorption of FUV photons, dust grains re-radiate in the FIR at a characteristic temperature () and;
| (3) |
[58, see] where is the FUV field in Habing units99 9 At the distance of OMC 1 and considering the pixel size in Fig. 8(a), the scale per pixel is equivalent to (per pixel). This relation neglects dust heating by embedded sources. Here we assume that owing to the high FUV field in the region, this extra heating does not dominate at large scales. For the same reason, and owing to the warm dust grain temperatures, we neglect the dust emission at 500 m in the estimation.. The factor of 1/2 approximately takes into account the absorption of visible photons by dust. The maximum value near the Trapezium is 105, whereas the lowest values in the mapped area are 500. The mean value inside the 200′′ radius circle is 2104 (the used in the representative PDR models shown in Figure 5). These FUV fluxes are in good agreement with early estimates based on lower angular resolution observations and PDR modelling [120, 112, e.g.,].
The [C ii] and CO 2-1 luminosities in the observed area are [C ii]=173 and =0.15 . Figure 8(e) shows the [C ii]/ map. The spatial distribution is markedly different from that of [C ii]/. In particular, the [C ii]/ ratio shows differences locally, from a few hundred in the strong outflows around Orion BN/KL, to 5000 in the peculiar northeastern positions almost devoid of CO emission (see white marks in the map shown in Figure 8(c)). At other positions of the map, the ratio reaches high values (1000), either because the observations trace regions of low extinction (i.e., low CO columns) or nearly edge-on PDRs for which the C+/CO transition is spatially resolved. Table 2 summarizes the mean values extracted from the maps toward the different regions of the cloud.
IV. Analysis
IV.1. [C ii] 158 m Excitation and Column Densities
Collisions with electrons, H atoms and H2 molecules contribute to the excitation of the [C ii] - fine structure levels [45, see discussion by]. The critical densities () for collisions of C+ with, , H and H2 are 44 / cm3 at =8000 K [125], and 3000 (2400) H / cm3 [12] and 4500 (3400) H2 / cm3 at (500) K [124]. Owing to the similar collisional rates with H2 and H, the [C ii] excitation in neutral gas is nearly independent of the molecular fraction. As the gas density increases above , the excitation temperature of the - transition tends to thermalize with . For optically thick lines, line-trapping further reduces the critical densities, thus reaching thermalization (=) at lower densities. Also for optically thick lines, a strong FIR background with high values increases but reduces the [C ii] line intensity.
When , the [C ii] excitation becomes sub-thermal (). If significant C+ columns of low-density gas exist in front of a FIR continuum source, the [C ii] line will be seen in absorption if [39, e.g.,], where K is the equivalent temperature at 1900.537 GHz, and is the continuum brightness temperature at 158 m. [C ii] line self-absorptions can also be produced by excitation gradients within the [C ii] emitting region [95, 48, e.g.,].
One potential problem in interpreting the [C ii] 158 m emission is the difficulty inferring the line opacity. Toward many positions, our observations resolve the [13C ii] =2-1 line1010 10 Corrected line strengths for the [13C ii] =2-1, 1-0 and 1-1 hyperfine lines at 1900.466, 1900.950 and 1900.136 GHz respectively have been published by Ossenkopf et al. [90]. The relative line strengths are 0.625, 0.250 and 0.125. These are slightly different from those of Cooksy et al. [25] that were used in the analysis of Stacey et al. [111] and Boreiko & Betz [17], and resulted in 12C/13C isotopic ratios lower than the usual value of 67. arising from the main spectral component at v km s-1 (see spectra in Figure 3 and maps in the highest-velocity panels of Figures 6 and 7). The second brightest component, the [13C ii] =1-0 line, is only detected toward a few positions of very bright [C ii] emission (e.g. the Orion Bar and BN/KL, see Figure 3). Assuming that the total integrated intensity of the three [13C ii] lines is [13C ii] = /0.625, one can derive the [C ii] line opacity from1111 11 Toward the Orion Bar and BN/KL, the [13C ii] =2-1 line is blended with the red-shifted [C ii] emission. To avoid overestimating the [C ii] 158 m line opacity toward these positions, we used the [13C ii] =1-0 line (which is not blended with any spectral feature) and assumed [13C ii] = .:
| (4) |
[90, e.g.,] where is the [C ii] 158 m opacity at line center, is the line peak main beam temperature (continuum-subtracted) and [] is the isotopic ratio [66, 67 in Orion,]. For optically thick [C ii] 158 m emission, the excitation temperature () of the transition can be computed from:
| (5) |
At these FIR wavelengths, the background is dominated by dust emission so that the continuum level adjacent to the [C ii] line, for an equivalent background temperature of K, is K, roughly the range of continuum levels detected by HIFI. For the main [C ii] 158 m spectral component we find , thus the continuum emission has a minor effect on . However, the situation can be different in more extreme and luminous environments.
Once and have been determined, the C+ column density can be computed from:
| (6) |
where is the line width in km s-1 of an assumed Gaussian line-profile. From the [C ii] and [13C ii] spectra averaged over the mapped region (main spectral component) we find K, and cm-2. The highest C+ column density peaks are found near the Trapezium, the Orion Bar, the East PDR and northeast of Orion BN/KL. In these emission peaks, the excitation temperatures and line opacities ( K and ) are higher than the average. The 25′′ beam-averaged C+ column density toward these peaks is cm-2.

The inferred excitation temperatures can be used to further constrain the origin of the [C ii] emission at the FUV-illuminated surface of the molecular cloud. In particular, the mean 100 K values inferred from the map require the fractional population of the 2 level, (2)/(2+2), to be 0.45. The representative PDR model in Figure 5 shows that the conditions for producing significant [C ii] emission are quite restrictive. For high FUV radiation fields, the C+ layers extend to 3-4 mag but the gas temperature falls much faster for any reasonable density. Figure 5 shows that a fractional population 0.45 of the 2 level requires high gas densities (5103 for even 500 K, see Figure 10). Hence, the bright [C ii] emission from OMC 1 traces narrow cloud surface layers (4 mag) and not the entire line of sight.
In the extended regions, the [13C ii] lines are not detected and the [C ii] 158 m line is weaker. This suggests that the line is optically thin or effectively thin [45]. The line opacity can be derived if one knows . Here we make the approximation ([C ii])/. Figure 9(a) shows a column density map, computed under these assumptions, of the blue-shifted component (vLSR2 to 5 km s-1) that includes the Dark Bay and the Northern Dark Lane emission. We adopted a constant 80 K (intermediate between in the OMC 1/H ii interfaces and that in the atomic Veil [3]. The resulting (C+) toward the Dark Bay (1.41018 cm-2) is equivalent to (C+)/410173.5 mag (i.e., significant H2 must be present) assuming that the bulk of the gas-phase carbon is in C+, with an abundance of 1.410-4 [109]. This value is consistent with the extinction peak determined toward the Dark Bay [87]. Other sightlines with (C+)81017 cm-2 (2 mag) are likely associated with C+ in nearly atomic H i gas (e.g., toward the Traprezium). The integrated C+ column density in the map (vLSR2 to 5 km s-1 component) is compatible with the observed [C ii] fractional luminosity of 12% (Section III.3).
In addition, Figure 9(b) shows a (C+) map of the OMC 1 component (vLSR5 to 17 km s-1) adopting 100 K from the map averaged spectrum. Figure 9(c) shows the resulting map of the total C+ column density along each line of sight, (C+)Total=(C+)OMC1+(C+)blue+(C+), where we have added, at each position, (C+)=1017 cm-2 from additional foreground emission components at vLSR2 km s-1. The integrated column density in the 2 km s-1 component is consistent with the 3% contribution to the total [C ii] luminosity. This is equivalent to 0.25 mag (i.e., fully atomic or ionized gas). We finally note that along many sightlines, the C+ column in the Veil is comparable to that computed in the OMC 1 surface. In these approximate maps of the C+ components without CO counterpart, 30 % of the C+ mass is in CO-dark H2 gas.
Figure 9(d) shows the column density map obtained from the dust emission10. Both (C+)Total and maps can be used to estimate the fraction () of the total column density traced by [C ii] along each line of sight. In particular, Figure 9(e) shows the distribution of the =[(C+)/]/1.410-4 ratio at 25′′ resolution. Note that this map is similar to the [C ii]/ map shown in Figure 8(d). The lowest values are inferred toward the high column density ridge (bluish regions with 5 %). These fractions are consistent with the presence of a massive molecular cloud behind the [C ii] emitting surfaces. The typical fractions outside the ridge are 20-30 % (greenish regions). Far from the Trapezium, toward the extended cloud component, fractions higher than 50 % are only inferred toward the most translucent lines of sight. The [C ii] emission toward the dense PDRs around the Trapezium is slightly optically thick and is higher than the average value assumed in the map. The corrected fraction using the column of (C+)1019 cm-2 computed from [13C ii] is 40 %.
We also used the C+ column map to compute the “PDR mass” in OMC 1. In particular, we integrate the equivalent =(C+)OMC1/1.410-4 column traced by [C ii] as , where is the area of pixel , is the H atom mass and is the mean atomic weight. We derive 200 , i.e., the PDR mass fraction traced by [C ii] is 8 % (within a factor of 2).
IV.1.1 [C ii] Radiative Transfer Models
In order to constrain the range of physical conditions that reproduce the observed [C ii] 158 m emission toward OMC 1, we have run a grid of non-local and non-LTE radiative transfer models of the doublet that take into account line trapping and opacity broadening [41, see Appendix in]. For consistency, we included illumination by a FIR background continuum field and a combined treatment of gas and dust emission/absorption. Hence, at a given wavelength the opacity is given by . We used a constant column density of (C+)=31018 cm-2, the mean value we infer from the OMC 1 map, and a nonthermal velocity dispersion km s-1 (see Sec. III.3.2). The models use the latest available collisional rates of C+ with , H and H2 (with a LTE H2 ortho-to-para ratio at each ) and assume and (H)=0.25 (H2) (a molecular fraction, 2 (H2)/[(H)+2 (H2)], of 0.9). For gas densities =2105 cm-3 and =500 K, this choice of parameters implies that the [C ii] - collisional rate is due to collisions with H2 molecules (70%), H atoms (25%) and electrons (5%). The FIR background radiation field is modelled as thermal emission at 30 K (roughly the mean dust temperature we derive from SED fits) and the temperature of the dust grains mixed with the C+ atoms is set to 50 K (typical of highly illuminated PDRs at mag).
Figure 10 shows model results in the form of iso- contours.
The mean [C ii] excitation temperature in the Herschel/HIFI map is 100 K.
This plot shows that the minimum gas density required to produce this =100 K is
5103 cm-3.
Toward the H ii /OMC 1 interfaces (the spherical shell of PDRs around the Trapezium) reaches higher
values (250-300 K). This sets a higher limit to the gas density of
105 cm-3 (including the Orion Bar).
The more elevated temperatures in these dense PDRs (300 K)
are consistent with the =400-700 K values
inferred from H2 pure rotational lines [5] and with 540 K derived from
H i emission, both measurements toward the Orion Bar PDR [123].

Finally, the presence of a foreground halo of low-excitation material can produce [C ii] absorption. Such a halo will also absorb or scatter the [C ii] line photons emitted inside the cloud, if the absorption is produced at similar velocities. This may be the case of components A and B of the H i absorption in the Veil. These components peak at vLSR0-6 km s-1 [123] and coincide with the blue-wing of the [C ii] emission seen in the main spectral component. The gas temperature and density in components A and B of Orion’s Veil are estimated from H i lines to 50-80 K and (H)102.5-3.4 cm-3 [121, 2]. For the FIR background in OMC 1 and for the parameters in our grid, we do predict [C ii] absorption for low excitation gas (white line in Figure 10). Hence, the [C ii] emission dips seen in some velocity intervals may be produced by [C ii] absorption in the Veil (e.g. toward the Orion Bar PDR at vLSR km s-1, toward the southwest (-150′′,-300′′) position at vLSR km s-1 or toward the (-62′′,250′′) position in the northern streamer at vLSR km s-1, see channel maps).
In any case, our [C ii] excitation models confirm that the gas density in the FUV-illuminated face of OMC 1 is high. The blue-shifted [C ii] emission caused by the Veil also shows that the density must be relatively high in these foreground components. This agrees with the general notion that the elevated stellar density in the Orion cluster is a consequence of hundreds of stars that formed from a remarkably dense condensation [37, 98, e.g.,].


IV.2. Correlation Diagrams
Figure 11 shows correlation plots between several quantities that are also used in the discussion of the [C ii] extragalactic emission (one point, one galaxy). Here we present their spatial correlation in a template massive star-forming region. In these plots, the black points represent positions outside the 200′′ (0.4 pc) radius circle, the “extended cloud face” component. Green squares represent lines of sight toward the “H ii region” component around the Trapezium stars, and red triangles represent positions in the “dense PDR interface” annulus. Gray points are other positions inside the 200′′ circle that do not fall in the latter two categories.
Figure 11(a) shows that the [C ii]/FIR ratio decreases with increasing FIR intensity. In OMC 1 we find that log ([C ii]/FIR)0.6log ([erg s-1 cm-2 sr-1])2.6, with a correlation coefficient of =0.93. This is reminiscent of the “[C ii] deficit” observed in local ULIRGs when compared to starburst and normal galaxies [77, 74, 47, e.g.,]. In a local complex like Orion, the decrease of [C ii]/ obviously occurs at orders of magnitude lower FIR luminosities and seems dominated by the strong variations of in the region. The blue line in Fig. 11(a) shows a linear model for a constant [C ii] intensity cloud (the median value of the map sample).
Figure 11(b) shows that increases with . Figure 11(c) shows a [C ii]/- scatter plot. In many studies, in which a complete SED cannot be constructed, is replaced by the or flux ratio. Theoretical models show that the photoelectic heating efficiency decreases for high values (also producing higher dust temperatures), because grains and PAHs get more positively charged and it becomes more difficult to photo-eject additional electrons [119, 89]. As the grain charge increases for high fields, the gas heating and cooling are reduced and a larger fraction of the FUV field is converted into dust FIR luminosity (thus lower [C ii]/ ratios can be expected). Although such a trend is suggested by Figure 11(c), the dust temperatures obtained from the SED fits, =314 K (1), do not change much over the mapped region and other effects seem to dominate the observed [C ii]/ variations at large spatial scales.
In particular, most of the dust emission in the extended cloud is consistent with an roughly constant temperature of 30 K. This leads to the approximately linear relation between dust opacity and FIR intensity shown in Figure 11(b). However, the inferred dust temperatures toward some lines of sight of small are lower than 30 K, resulting in lower values than those expected in a constant cloud (blue line Figure 11(b)), as well as in high [C ii]/ ratios in Figure 11(a). On the other hand, the dust is warmer toward the dense PDRs and H ii region, and high intensities are observed above the constant- blue line in Figure 11 (b). The higher dust temperatures toward the central of OMC 1 likely reflect higher values and also contribution from internal dust heating by embedded sources. However, their associated [C ii]/ ratios lie above the linear model that assumes constant [C ii] emission in Figure 11(a), revealing enhanced [C ii] intensity toward these regions. Still, the FIR intensity increases more than [C ii] (Figure 11(d)), and the resulting [C ii]/ ratios are low toward lines of sight of high dust temperatures, see Figure 11(c) and Section V.4.1.
Figure 11(d) shows that, except for high FIR intensities, the [C ii] 158 m intensities are reasonably well correlated with the FIR emission (=0.75), with 4.110-42.210-3 (in erg s-1 cm-2 sr-1 units). The [C ii] intensities, however, are better correlated with the PAH emission traced by the IRAC 8 m image (=0.91, Figure 11(f)), with 2.610-21.610-3 (also in erg s-1 cm-2 sr-1 units). As opposed to FIR, this correlation seems to hold for high [C ii] and PAH intensities. Finally, Figure 11(e) shows a correlation plot of [C ii]/ with . This plot shows much more scatter, but suggests that [C ii]/ decreases from the extended cloud to the “H ii region” component (highest values).
V. Discussion
V.1. [C ii], CO and FIR Diagnostic Power
Dense PDR models predict that the low- 12CO lines saturate (1) close to the CO abundance peak and thus the [C ii]/ ratio depends mostly on (C+) and , i.e., on and [61, see e.g., PDR models by]. For densities below 104 cm-3 and 103, the [C ii] 158 m line dominates the gas cooling [61] and the [C ii]/ ratio provides a good approximation to the grain photoelectric heating efficiency. For higher densities or values (i.e., the OMC 1/H ii interfaces around the Trapezium), [C ii] collisional de-excitation plays a role and [O i] starts to dominate the warm gas cooling. [O i] 63,145 m lines are certainly useful [54] although they are also bright in dissociative shocks where the [C ii] line is faint [43, e.g.,]. In addition, the opacity of the [O i] 63 m line is higher (=1.6 for a [O/C]=2.2 abundance ratio) and lies at wavelengths of higher dust opacity (2.5-6.3 times higher for =1-2). The [O i] 63 m line opacity problem is difficult to circumvent, because 18O does not have nuclear spin (producing hyperfine splittings in 13C+), and the isotopic shift with respect to 16O is only 1.5 km s-1 [20, 23.5 MHz,]. Therefore, [C ii] is a robust tracer of the presence of FUV photons also in dense gas.
As noted in the literature, [C ii]/ approximately follows (Figure 12). For most of the mapped positions, the observed luminosities appear well correlated (=0.89 and slope of 775). Stacey et al. [110] suggested that, to a first approximation, the [C ii]/ and / luminosity ratios can be compared with PDR models to constrain the FUV radiation field and the gas density. Most of the points in Figure 12 roughly lie on a straight line. In the frame of PDR models [61, e.g.,] this line approximately follows the decrease of (from left to right) and the decrease of (from bottom to top). Comparing our spatially resolved luminosity ratios1212 12 Scaling our data by (40-500 m)1.5 and assuming 8 (erg s-1 cm-2 sr-1) for optically thick thermalized CO gas. (Figure 12) with the plot in Figure 5 of Stacey et al. [113], based on PDR models of Kaufman et al. [61] for a =10 mag slab, one sees that the lowest [C ii]/310-4 and /310-6 values near the Trapezium are consistent with high 104 fields and 105 cm-3. On the other hand, the highest [C ii]/10-2 values, corresponding to /10-4 ratios in the extended cloud component are consistent with lower FUV fields and gas densities, 102 and 103-4 cm-3 respectively.

In addition, our maps reveal regions in which the luminosity ratios lie outside the parameter space allowed by =10 mag PDR models (blue pentagons in Figure 12). These are specific positions with very high [C ii]/5000 luminosities and low opacities at the northeast of the map. Since they do not coincide with the H ii region, we conclude that they must be associated with lower density neutral gas at low (thus low CO abundances for 1 values). Indeed, a much better match with PDR models is found by considering the 3 mag cloud models of Kaufman et al. [61].
V.2. [C ii] and the Star Formation Rate in Orion
Herschel/HIFI has allowed the first velocity-resolved [C ii] survey of the Galactic plane, in which the contribution of the different ISM phases to the [C ii] emission has been constrained [93, e.g.,]. The combined [C ii] emission from all components added together correlates with the SFR in similar manner as in nearby galaxies. Including observations of the Milky Way, the LMC and several nearby galaxies dominated by star formation, Pineda et al. [94] find: log (SFR [ yr-1])0.89 log ([C ii][erg s-1])36.3. Using this correlation and the total [C ii] luminosity toward OMC 1, we derive SFR3.810-5 yr-1 in the mapped area. This is very similar to the rate obtained using SFR( yr-1) [62, e.g.,] and the observed luminosity toward OMC 1 (2105 ).
In addition, extinction maps of galactic star-forming regions suggest that the SFR correlates with the mass () of the UV-shielded (7 mag) dense gas ((H2)104 cm-3), the reservoir that ultimately forms stars [6, 64, 65, e.g.,]. These studies suggest SFR [ yr-1] (1.2-1.8)10 (), and this corrrelation holds from star-forming regions to galaxies [36, 127]. Taking the masses inferred from our observations, we estimate 2400 (using the total mass deduced from the dust emission and subtracting the PDR contribution inferred from [C ii]), and use the above relation to derive SFR(2.9-4.3)10-5 yr-1. Therefore, the different methods provide consistent SFR values in Orion.
Taking into account the mapped area, our derived SFR is equivalent to a very high SFR surface density of =(2.3-3.4)10-5 yr-1 pc-2. Together with the high surface density inferred from the mass estimates (2000 pc-2), these values place the core of Orion at an extreme of a Kennicutt–Schmidt-type surface density relation ( with close to 1). These, and even higher surface densities are also inferred toward luminous galaxy mergers hosting intense star formation [38].
V.3. [C ii]/ Variations and Extragalactic Link
The reduced [C ii]/ luminosity observed toward local ULIRGs (1012 ) has been difficult to interpret. Dust extinction, optically thick [C ii] emission, reduced photoelectric heating efficiency or soft UV fields from less massive stars have been invoked [74, e.g.,]. In addition, extragalactic observations with Herschel suggest that the “line deficit” (relative to or /) also applies to other FIR fine structure lines such as [O i], [N ii] or [O iii] arising either from PDRs or H ii regions [47].


The / ratio in particular, is expected to be proportional to the ionization parameter (the number of H ionizing photons, (H), divided by the density and by the distance to the ionizing stars). The FIR line deficit becomes more apparent in galaxies with very high /80 values [47, 46]. This threshold has been suggested to separate normal galaxies from ultra-luminous mergers characterized by very high SFRs [38].
These authors suggest that the ISM conditions and the star-formation efficiency in these galaxies are different from those in normal and starburst galaxies. In this context, the FIR line deficits (including [C ii]) would be explained by the much higher ionization parameters and more extreme conditions of the H ii/PDR regions they host [47, e.g.,]. Photoionization models including dust grains indeed predict reduced [C ii]/ values for high log parameters [3]. One of the predicted effects is that grains absorb a higher fraction of the available UV photons relative to the gas, leaving fewer photons to ionize and heat the gas. Models of the radiative pressure on grains do show that dusty H ii regions have a different ionization balance and that they compress the gas and dust into a dense ionized shell [32]. This is very suggestive of the shell-like structure revealed by the [C ii] and H41 emission around the Trapezium. On the other hand, Draine [32] concludes that owing to the accumulation of gas and dust in a dense shell, the fraction of photons that ionize the gas actually increases (relative to a uniform H ii region). In this context, the effects of increasing may not be so severe.
Observational evidence for the presence of PAH and grains in H ii regions is increasing [85]. Their role in modulating the FUV field reaching the neutral cloud surface needs to be taken into account. The H ii region around the Trapezium contains dust and is indeed characterized by a relatively high ionization parameter [9, log 1.48 and (H)1049 s-1,]. The presence of grains in the ionized nebula can be inferred from the depleted abundances of refractory elements like Mg, Si and Fe from the gas phase [108, e.g.,].
In Orion, the sightlines with /80 show a very good spatial correspondence with the dense H ii ionized gas traced by the H41 line and so they do trace regions of high ionization parameter (white thick contour in Figure 13) In particular, the highest / ratios are observed close to the H41 emission peaks: the dense ionized gas toward the Trapezium cluster and also the ionization front that precedes the Orion Bar PDR. These regions are characterized by more extreme UV irradiation conditions (104).
We finally note that the luminosity of the large-scale vibrationally excited H2 line emission toward OMC 1 is dominated by FUV-exited fluorescent emission in PDR gas [73, 98%, see] even though the collisionally excited (shocked) H2 dominates the small-scale emission of high surface brightness (e.g., toward BN/KL and other outflows). Like the extended [C ii] emission we have mapped, this FUV-exited H2 emission traces the FUV-illuminated face of Orion and may also dominate the extragalactic near-IR H2 emission.
V.4. An Explanation for the “[C ii] Deficit”
Figure 14 shows the spatial distribution of the two [C ii]/ regimes found toward OMC 1. Cyan contours for low 10-410-3 ratios toward the core of the cloud, and red contours for high 10-310-2 ratios toward the extended cloud face component (increasing from the center of OMC 1 and outwards). In Figure 14 (left), the [C ii]/ contours are shown on top of the / map. Figure 14 (right) shows the same [C ii]/ contours on top of the map.
V.4.1 Geometry and (C+) Relative to Total Column
Since most of the [C ii] emission arises from 4 mag FUV-irradiated cloud surface layers, the local opacity of the dust grains mixed with the C+ atoms () is generally small, . Therefore, the dust opacity does not seem important locally, but it may be relevant if the [C ii] sources are embedded in large columns of dust or if many [C ii] emitting surfaces in a clumpy medium are included in the telescope beam.
The average 160 m dust opacity inside the 200′′ circle region surrounding the Trapezium is only moderate ( or 50 mag). Therefore, the 160 m continuum emission traces the column density of dust in the molecular cloud that lies behind the ionized nebula, weighted by . The [C ii] emission, however, does not arise from the entire line of sight but from the FUV-illuminated face of the cloud.


Figure 15 shows the [C ii]/ luminosity ratio as a function of . Both quantities are clearly tightly related. Therefore, the relative geometry of the illuminating stars with respect to the molecular cloud is important to understand the variations of [C ii]/. Toward OMC 1, it can be idealized as a slab of constant [C ii] emission arising from the foreground face of the molecular cloud (see a simplified sketch in Figure 16). In this case, and for constant , [C ii]/ would vary as 1/, with being proportional to the dust column toward each line of sight1313 13 In the most general case, /()/(, with and only coupled inside clouds at high densities 106 cm-3. For the 1 range of and values toward OMC 1, [C ii]/ can be approximated by /[C ii]/(, with the constant varying a factor of 2 depending on the exact and values. Thus, if does not vary much, the FIR intensity raises with increasing total column density through the cloud, as shown in Figure 11(b).. When this slab model is defined to intercept the median [C ii]/ and values of the sample, the resulting curve satisfactorily reproduces the 3 orders of magnitude [C ii]/ variations observed throughout the map (blue curve in Figure 15). The observed scatter with respect to the model is likely produced by small variations of , grain charge, and of [C ii] in lines of sight with the same but different .
Gerin et al. [39] have carried out small maps of the [C ii] 158 m line toward a limited sample1414 14 At the average distance of 4 kpc of these massive star-forming regions, the 50′′50′′ mapped areas are equivalent to 11 pc2. The typical spatial resolution toward these more distant SFR regions with Herschel is 0.2 pc. of more distant massive star-forming regions in the Milky Way (W31C, W49N, W51, DR21(OH), …). These observations show that the [C ii] absorption produced by diffuse clouds on the line of sight can reduce the [C ii]/ ratio by 50 %, if the vLSR range of the absorbing clouds is not spectrally-resolved. Velocity-unresolved observations toward bright FIR continuum sources with foreground diffuse clouds thus result in apparently weaker [C ii] luminosities. However, the most important effect revealed by the velocity-resolved [C ii] emission observations is the decrease of [C ii]/ by large factors as one moves from the extended cloud component to the FIR continuum peak. Just like we have demonstrated in Orion (the [C ii]/ and the =[(C+)/]/1.410-4 maps shown in Figures 8(d) and 9(e) are similar), we believe that the decrease of [C ii]/ is due to the increase in the total column density throughout the cloud relative to the (surface) [C ii] emitting column.
In addition, local low-metallicity galaxies such as the nearby LMC [67, e.g.,], but also early galaxies at 6 [21], show enhanced [C ii] emission relative to their FIR emission. These values are interpreted as the consequence of higher penetration of FUV photons due to the lower dust content (lower extinction). This agrees with our view of galaxies having clouds of larger C+ column densities relative to their total dust column.
V.4.2 Dust Attenuation
The Trapezium cluster and associated H ii region are only half enveloped by the molecular cloud. The [C ii] emitting region is thus facing us and is mostly unattenuated by foreground dust. Other massive star-forming regions or galaxies may be embedded in large amounts of dust (buried starbursts in galactic nuclei in particular). In such cases, the [C ii] emission itself will be attenuated by (a dust screen), where now represents the dust opacity between the observer and the [C ii] emitting layers (Figure 16). For (H2)1024 cm-2 (1), the expected [C ii]/ values can be very low, lower than 510-5 (black dotted curve in the inset of Figure 15). The prototypical example in the Milky Way is Sgr B2, the most massive starburst in the Galactic Center. Sgr B2 also shows a pronounced decrease of [C ii]/ as the dust opacity increases from the extended cloud to the (FIR) optically thick cores and embedded H ii regions [40, 33, e.g.,]. This reasoning agrees with recent observations of local LIRGs in which the [C ii]/ deficit is restricted to their nuclei and not their extended disks [31].
An intermediate case may exist in which the C+ gas and the FIR emitting dust grains are well mixed through the entire line of sight (Figure 16). In this case, the intrinsic [C ii] emission will be attenuated by / [118, e.g.,]. This model provides less extreme corrections at large extinctions (magenta dashed curve in Figure 15). Given the surface origin of the [C ii] emission, this model is however less realistic for OMC 1, but it may apply to low metallicity galaxies (lower / and dust-to-gas mass ratios) in which larger columns of C+ relative to the total dust column exist due to the much higher penetration of the FUV radiation field.
Protostellar sources in Orion BN/KL are embedded in large column densities of material and thus very low [C ii]/ ratios can be expected. Using the Herschel/PACS spectroscopic data [43] we derive [C ii]/2.410-5 and 2.7 toward the hot core and IRc sources, and [C ii]/7.710-5 and 1.2 toward the adjacent H2 Peak 1 outflow region. Both positions are shown in the inset panel of Figure 15. In the frame of the simple geometrical models discussed above, the [C ii]/ ratio toward H2 Peak 1 is still compatible with the foreground surface [C ii] emission model. The [C ii]/ ratio toward the hot core is even lower, but this is likely a consequence of the higher FIR luminosity due to internal dust heating from the protostellar sources. In any case, the embedded [C ii] emission model provides extinction corrections that are too large.
V.4.3 Inhomogeneities and FUV radiation penetration
The structure of molecular clouds is not perfectly homogeneous [116, 34, e.g.,] and FUV radiation from massive stars can penetrate to deeper cloud depths than in homogeneous clouds. Our representative (homogeneous) PDR models for =2105-4 cm-3, and dust grain properties appropriate to Orion, predict (C+)(1.2-1.6)1018 cm-2. These C+ column densities are a factor of 2 larger than the predictions of PDR models using standard ISM grain properties (Section III.2). However, they are still lower, by a factor of 3, than the (C+) columns inferred toward many positions of OMC 1 (see Section IV). These higher values suggest a degree of inhomogeneity at 25′′ scales (0.05 pc). As noted by Stacey et al. [112], an inhomogeneous structure facilitates the propagation of FUV photons far from the Trapezium and contributes to the increase in the fraction of the volume that is effectively producing [C ii] (more surfaces along the line of sight).
VI. Summary and Conclusions
We have presented the first 7.5′11.5′ (0.9 pc 1.4 pc) velocity-resolved map of the [C ii] 158 m line toward OMC 1. In combination with FIR photometry and H41 and CO =2-1 line maps, we obtained the following results:
- 1.
The main contribution to the [C ii] luminosity (85 %) is from the extended, FUV-illuminated face of the cloud (500, 5103 cm-3) and from dense PDRs (104, 105 cm-3) at the interface between OMC 1 and the H ii region surrounding the Trapezium cluster. In addition, 15 % of the [C ii] emission arises from a different gas component without CO counterpart. Part of this emission can be associated with filamentary structures that photoevaporate from the cloud and with depressions of the visible-light emission previously seen in the images of the Orion nebula (the Dark Bay, the Northern Dark Lane and other components in the atomic H i gas Veil). An additional but minor contribution can be associated with ionized gas.
- 2.
The highest C+ column density peaks are found toward the Trapezium, the Orion Bar, and specific PDRs to the east of BN/KL. These bright [C ii] emission regions ( K) follow a spherical shell structure (in projection on the sky) surrounding the back edge of the blister H ii region. Several of these OMC 1/H ii interfaces have nearly edge-on orientations. The excitation temperatures and line opacities derived from the [C ii] and [13C ii] lines are K and . Hence, the [C ii] line toward these peaks is slightly optically thick, and traces high excitation dense PDR gas (300 K and 105 cm-3).
- 3.
[C ii]/ decreases from the extended cloud component (10-210-3) to the cloud center (10-310-4). The latter values are reminiscent of the “[C ii] line deficit” seen toward local ULIRGs. The [C ii]/ variations can be explained by the approximately face-on geometry of the molecular cloud relative to the externally illuminating stars. This creates a [C ii] emission layer at the FUV-illuminated surface of the cloud. The FIR emission, however, approximately traces the bulk of material along each line of sight. Indeed, [C ii]/ is spatially correlated with the dust column density in a way that agrees with a simple face-on slab model. Trying to link the local and the extragalactic emission, we conclude that the [C ii] emitting column relative to the total dust column density along each line of sight determines the observed [C ii]/ variations, with the lowest ratios observed toward the highest column density peaks. This also implies that the specific grain properties and dust-to-gas mass ratio are important parameters in determining the [C ii]/ ratio.
- 4.
We show that the / ratio follows the hydrogen ionizing photons traced by the H41 line, reaching /80 toward the H ii region around the Trapezium. These high / values are interesting proxies of the ionization parameter , and are similar to the threshold where luminous galaxy mergers start to show “[C ii] emission deficits”. Indeed, the surface densities we infer toward OMC 1 (2000 pc-2 and =(2.3-3.4)10-5 yr-1 pc-2) are comparable to those inferred in galaxies hosting vigorous star-formation. The interesting point of course is that these conditions, those of a young massive cluster still surrounded by its dense parental molecular cloud, can dominate the FIR emission at kpc galactic scales.
The [C ii] 158 m line is undoubtedly a bright and powerful diagnostic of the FUV-illuminated ISM. In combination with other tracers ([O i], CO, dust SEDs, PAHs and H i), a very detailed picture of the dominant environment and prevailing physical conditions can be extracted. In addition, observations of molecular ions (CO+, HOC+, CF+ or CH+) directly related to C+, are becoming interesting tools to constrain the properties of the “C+ layers” in FUV-illuminated H2 gas [114, 35, 83, 51, 81, e.g.,]. Even more exotic ions such as OH+ or ArH+ are more specific tracers of low H2 fraction (nearly atomic) gas where [C ii] is also expected [84, 122, 106]. Most of them can be observed with ALMA.
Facilities: Herschel Space Observatory, IRAM-30m
Notes Added after Proofs: Three relevant papers were discovered after proof reading, below we include their most pertinent information related to this work:
- •
O’Dell & Harris (2010, AJ, 140, 985) presented a more detailed geometrical model of the Orion molecular cloud, Orion nebula and Veil (see their Figure 13).
- •
Díaz-Santos et al. (2013, ApJ, 774, 68) determined the [C ii]/ ratio in a sample of 202 local LIRG and ULIRG galaxies. The [C ii]/ ratio was found to scale with the strength of the the 9.7 m silicate absorption feature, except for “optically thick” galaxies showing very large 9.7 m strengths. Unlike the MIR dust emission/absorption, the FIR/submm emission is more sensitive to the total column density of dust in dense clouds. Thus, their observed trend is consistent with our detailed interpretation of the [C ii]/ variations.
- •
Compared to local ULIRGs, Rigopoulou et al. (2014, ApJL, 781, L15) found enhanced [C ii]/ luminosity ratios in a sample of intermediate redshift (0.2z0.8) ULIRGs observed with Herschel/SPIRE. This result is more similar to observations of high redshift galaxies with ALMA, and can also be understood as variations of the [C ii] emitting column relative to the total dust column density toward each galaxy.
References
- [1] Abel, N. P. 2006, MNRAS, 368, 1949
- [2] Abel, N. P., Ferland, G. J., O’Dell, C. R., Shaw, G., & Troland, T. H. 2006b, ApJ, 644, 344
- [3] Abel, N. P., Dudley, C., Fischer, J., Satyapal, S., & van Hoof, P. A. M. 2009, ApJ, 701, 1147
- [4] Allamandola, L. J., Tielens, A. G. G. M., & Barker, J. R. 1989, ApJS, 71, 733
- [5] Allers, K. N., Jaffe, D. T., Lacy, J. H., Draine, B. T., & Richter, M. J. 2005, ApJ, 630, 368
- [6] André, P., Men’shchikov, A., Bontemps, S., et al. 2010, A&A, 518, LL102
- [7] Audit, E., & Hennebelle, P. 2005, A&A, 433, 1
- [8] Arab, H., Abergel, A., Habart, E., et al. 2012, A&A, 541, A19
- [9] Baldwin, J. A., Ferland, G. J., Martin, P. G., et al. 1991, ApJ, 374, 580
- [10] Bally, J., Langer, W. D., Stark, A. A., & Wilson, R. W. 1987, ApJ, 312, L45
- [11] Bally, J. 2008, hsf1, 459
- [12] Barinovs, Ğ., van Hemert, M. C., Krems, R., & Dalgarno, A. 2005, ApJ, 620, 537
- [13] Bernard-Salas, J., Habart, E., Arab, H., et al. 2012, A&A, 538, AA37
- [14] Berné, O., Marcelino, N., & Cernicharo, J. 2014, ApJ, 795, 13
- [15] Bertoldi, F., & Draine, B. T. 1996, ApJ, 458, 222
- [16] Blake, G. A., Sutton, E. C., Masson, C. R., & Phillips, T. G. 1987, ApJ, 315, 621
- [17] Boreiko, R. T., & Betz, A. L. 1996, ApJ, 467, L113
- [18] Brisbin, D., Ferkinhoff, C., Nikola, T., et al. 2015, ApJ, 799, 13
- [19] Brogan, C. L., Troland, T. H., Abel, N. P., Goss, W. M., & Crutcher, R. M. 2005, ASPC, 343, 183
- [20] Brown, J. M., Evenson, K. M., & Zink, L. R. 1993, Phys. Rev. A, 48, 3761
- [21] Capak, P. L., Carilli, C., Jones, G., et al. 2015, Nature, 522, 455
- [22] Cardelli, J. A., Clayton, G. C., & Mathis, J. S. 1989, ApJ, 345, 245
- [23] Carilli, C. L., & Walter, F. 2013, ARA&A, 51, 105
- [24] Chen, J.-H., Goldsmith, P. F., Viti, S., et al. 2014, ApJ, 793, 111
- [25] Cooksy, A. L., Blake, G. A., & Saykally, R. J. 1986, ApJ, 305, L89
- [26] Crawford, M. K., Genzel, R., Townes, C. H., & Watson, D. M. 1985, ApJ, 291, 755
- [27] Cuadrado, S., Goicoechea, J. R., Pilleri, P., et al. 2015, A&A, 575, A82
- [28] Cubick, M., Stutzki, J., Ossenkopf, V., Kramer, C., Rollig, M. 2008, A&A, 488, 623
- [29] Dalgarno, A., & McCray, R. A. 1972, ARA&A, 10, 375
- [30] de Graauw, T., Helmich, F. P., Phillips, T. G., et al. 2010, A&A, 518, LL6
- [31] Díaz-Santos, T., Armus, L., Charmandaris, V., et al. 2014, ApJ, 788, LL17
- [32] Draine, B. T. 2011, ApJ, 732, 100
- [33] Etxaluze, M., Goicoechea, J. R., Cernicharo, J., et al. 2013, A&A, 556, AA137
- [34] Falgarone, E., Phillips, T. G., & Walker, C. K. 1991, ApJ, 378, 186
- [35] Fuente, A., Rodrıguez-Franco, A., Garcıa-Burillo, S., Martın-Pintado, J., & Black, J. H. 2003, A&A, 406, 899
- [36] Gao, Y., & Solomon, P. M. 2004, ApJ, 606, 271
- [37] Genzel, R., & Stutzki, J. 1989, ARA&A, 27, 41
- [38] Genzel, R., Tacconi, L. J., Gracia-Carpio, J., et al. 2010, MNRAS, 407, 2091
- [39] Gerin, M., Ruaud, M., Goicoechea, J. R., et al. 2015, A&A, 573, AA30
- [40] Goicoechea, J. R., Rodríguez-Fernández, N. J., & Cernicharo, J. 2004, ApJ, 600, 214
- [41] Goicoechea, J. R., Pety, J., Gerin, M., et al. 2006, A&A, 456, 565
- [42] Goicoechea, J. R., & Le Bourlot, J. 2007, A&A, 467, 1
- [43] Goicoechea, J. R., Chavarría, L., Cernicharo, J., et al. 2015, ApJ, 799, 102
- [44] Goldsmith, P. F., Bergin, E. A., & Lis, D. C. 1997, ApJ, 491, 615
- [45] Goldsmith, P. F., Langer, W. D., Pineda, J. L., & Velusamy, T. 2012, ApJS, 203, 13
- [46] González-Alfonso, E., Fischer, J., Sturm, E., et al. 2015, ApJ, 800, 69
- [47] Graciá-Carpio, J., Sturm, E., Hailey-Dunsheath, S., et al. 2011, ApJ, 728, LL7
- [48] Graf, U. U., Simon, R., Stutzki, J., et al. 2012, A&A, 542, L16
- [49] Grenier, I. A., Casandjian, J.-M., & Terrier, R. 2005, Sci, 307, 1292
- [50] Griffin, M. J., Abergel, A., Abreu, A., et al. 2010, A&A, 518, L3
- [51] Guzmán, V., Pety, J., Gratier, P., et al. 2012, A&A, 543, LL1
- [52] Habing, H. J. 1968, Bull. Astron. Inst. Netherlands, 19, 421
- [53] Herrera-Camus, R., Bolatto, A. D., Wolfire, M. G., et al. 2015, ApJ, 800, 1
- [54] Herrmann, F., Madden, S. C., Nikola, T., et al. 1997, ApJ, 481, 343
- [55] Hildebrand, R. H. 1983, QJRAS, 24, 267
- [56] Hogerheijde, M. R., Jansen, D. J., & van Dishoeck, E. F. 1995, A&A, 294, 792
- [57] Holland, W. S., Bintley, D., Chapin, E. L., et al. 2013, MNRAS, 430, 2513
- [58] Hollenbach, D. J., & Tielens, A. G. G. M. 1999, RvMP, 71, 173
- [59] Ingalls, J. G., Reach, W. T., & Bania, T. M. 2002, ApJ, 579, 289
- [60] Kapala, M. J., Sandstrom, K., Groves, B., et al. 2015, ApJ, 798, 24
- [61] Kaufman, M. J., Wolfire, M. G., Hollenbach, D. J., & Luhman, M. L. 1999, ApJ, 527, 795
- [62] Kennicutt, R. C., Jr. 1998, ApJ, 498, 541
- [63] Kester, D., Avruch, I., & Teyssier, D. 2014, AIPC, 1636, 62
- [64] Lada, C. J., Lombardi, M., & Alves, J. F. 2010, ApJ, 724, 687
- [65] Lada, C. J., Forbrich, J., Lombardi, M., & Alves, J. F. 2012, ApJ, 745, 190
- [66] Langer, W. D., & Penzias, A. A. 1990, ApJ, 357, 477
- [67] Lebouteiller, V., Cormier, D., Madden, S. C., et al. 2012, A&A, 548, A91
- [68] Le Petit, F., Nehmé, C., Le Bourlot, J., & Roueff, E. 2006, ApJS, 164, 506
- [69] Lee, T. A. 1968, ApJ, 152, 913
- [70] Li, A., & Draine, B. T. 2001, ApJ, 554, 778
- [71] Lilley, A. E., & Palmer, P. 1968, ApJS, 16, 143
- [72] Lis, D. C., Serabyn, E., Keene, J., et al. 1998, ApJ, 509, 299
- [73] Luhman, M. L., Jaffe, D. T., Keller, L. D., & Pak, S. 1994, ApJ, 436, L185
- [74] Luhman, M. L., Satyapal, S., Fischer, J., et al. 1998, ApJ, 504, L11
- [75] Madden, S. C., Geis, N., Genzel, R., et al. 1993, ApJ, 407, 579
- [76] Madden, S. C., Poglitsch, A., Geis, N., Stacey, G. J., & Townes, C. H. 1997, ApJ, 483, 200
- [77] Malhotra, S., Helou, G., Stacey, G., et al. 1997, ApJ, 491, L27
- [78] Malhotra, S., Kaufman, M. J., Hollenbach, D., et al. 2001, ApJ, 561, 766
- [79] Megeath, S. T., Gutermuth, R., Muzerolle, J., et al. 2012, AJ, 144, 192
- [80] Mookerjea, B., Ghosh, S. K., Kaneda, H., et al. 2003, A&A, 404, 569
- [81] Nagy, Z., Van der Tak, F. F. S., Ossenkopf, V., et al. 2013, A&A, 550, AA96
- [82] Nakagawa, T., Yui, Y. Y., Doi, Y., et al. 1998, ApJS, 115, 259
- [83] Neufeld, D. A., Schilke, P., Menten, K. M., et al. 2006, A&A, 454, L37
- [84] Neufeld, D. A., Goicoechea, J. R., Sonnentrucker, P., et al. 2010, A&A, 521, LL10
- [85] Ochsendorf, B. B., & Tielens, A. G. G. M. 2015, A&A, 576, A2
- [86] O’Dell, C. R. 2001, ARA&A, 39, 99
- [87] O’Dell, C. R., & Yusef-Zadeh, F. 2000, AJ, 120, 382
- [88] O’Dell, C. R., Henney, W. J., Abel, N. P., Ferland, G. J., & Arthur, S. J. 2009, AJ, 137, 367
- [89] Okada, Y., Pilleri, P., Berné, O., et al. 2013, A&A, 553, A2
- [90] Ossenkopf, V., Röllig, M., Neufeld, D. A., et al. 2013, A&A, 550, AA57
- [91] Phillips, T. G., Huggins, P. J., Wannier, P. G., & Scoville, N. Z. 1979, ApJ, 231, 720
- [92] Pilbratt, G. L., Riedinger, J. R., Passvogel, T., et al. 2010, A&A, 518, LL1
- [93] Pineda, J. L., Langer, W. D., Velusamy, T., & Goldsmith, P. F. 2013, A&A, 554, AA103
- [94] Pineda, J. L., Langer, W. D., & Goldsmith, P. F. 2014, A&A, 570, AA121
- [95] Plume, R., Kaufman, M. J., Neufeld, D. A., et al. 2004, ApJ, 605, 247
- [96] Poglitsch, A., Waelkens, C., Geis, N., et al. 2010, A&A, 518, L2
- [97] Riechers, D. A., Carilli, C. L., Capak, P. L., et al. 2014, ApJ, 796, 84
- [98] Rivilla, V. M., Martín-Pintado, J., Jiménez-Serra, I., & Rodríguez-Franco, A. 2013, A&A, 554, AA48
- [99] Robberto, M., Soderblom, D. R., Bergeron, E., et al. 2013, ApJS, 207, 10
- [100] Roelfsema, P. R., Helmich, F. P., Teyssier, D., et al. 2012, A&A, 537, AA17
- [101] Rodriguez-Fernandez, N.J., Braine, J., Brouillet, N., & Combes, F. 2006, A&A, 453, 77
- [102] Rodriguez-Franco, A., Martin-Pintado, J., & Fuente, A. 1998, A&A, 329, 1097
- [103] Rosenthal, D., Bertoldi, F., & Drapatz, S. 2000, A&A, 356, 705
- [104] Russell, R. W., Melnick, G., Gull, G. E., & Harwit, M. 1980, ApJ, 240, L99
- [105] Sanders, D. B., & Mirabel, I. F. 1996, ARA&A, 34, 749
- [106] Schilke, P., Neufeld, D. A., Müller, H. S. P., et al. 2014, A&A, 566, AA29
- [107] Simón-Díaz, S., Herrero, A., Esteban, C., & Najarro, F. 2006, A&A, 448, 351
- [108] Simón-Díaz, S., & Stasińska, G. 2011, A&A, 526, AA48
- [109] Sofia, U. J., Lauroesch, J. T., Meyer, D. M., & Cartledge, S. I. B. 2004, ApJ, 605, 272
- [110] Stacey, G. J., Geis, N., Genzel, R., et al. 1991, ApJ, 373, 423
- [111] Stacey, G. J., Townes, C. H., Geis, N., et al. 1991b, ApJ, 382, L37
- [112] Stacey, G. J., Jaffe, D. T., Geis, N., et al. 1993, ApJ, 404, 219
- [113] Stacey, G. J., Hailey-Dunsheath, S., Ferkinhoff, C., et al. 2010, ApJ, 724, 957
- [114] Störzer, H., Stutzki, J., & Sternberg, A. 1995, A&A, 296, L9
- [115] Störzer, H., & Hollenbach, D. 1998, ApJ, 495, 853
- [116] Stutzki, J., & Guesten, R. 1990, ApJ, 356, 513
- [117] Tercero, B., Cernicharo, J., Pardo, J. R., & Goicoechea, J. R. 2010, A&A, 517, AA96
- [118] Thronson, H. A., Jr., Majewski, S., Descartes, L., & Hereld, M. 1990, ApJ, 364, 456
- [119] Tielens, A. G. G. M., & Hollenbach, D. 1985, ApJ, 291, 722
- [120] Tielens, A. G. G. M., & Hollenbach, D. 1985b, ApJ, 291, 747
- [121] Troland, T. H., Heiles, C., & Goss, W. M. 1989, ApJ, 337, 342
- [122] van der Tak, F. F. S., Nagy, Z., Ossenkopf, V., et al. 2013, A&A, 560, AA95
- [123] van der Werf, P. P., Goss, W. M., & O’Dell, C. R. 2013, ApJ, 762, 101
- [124] Wiesenfeld, L., & Goldsmith, P. F. 2014, ApJ, 780, 183
- [125] Wilson, N. J., & Bell, K. L. 2002, MNRAS, 337, 1027
- [126] Wolfire, M. G., Hollenbach, D., & McKee, C. F. 2010, ApJ, 716, 1191
- [127] Wu, J., Evans, N. J., II, Gao, Y., et al. 2005, ApJ, 635, L173
- [128] Wyrowski, F., Schilke, P., Hofner, P., & Walmsley, C. M. 1997, ApJ, 487, L171
- [129] Zuckerman, B. 1973, ApJ, 183, 863